 Open Access Article
Effect of the calcination temperature of cerium–zirconium mixed oxides on the structure and catalytic performance of WO3/CeZrO2 monolithic catalyst for selective catalytic reduction of NOx with NH3
Haidi Xua,
Mengmeng Suna,
Shuang Liub,
Yuanshan Lic,
Jianli Wang*b and
Yaoqiang Chen *abc
*abc
aInstitution of New Energy and Low-Carbon Technology, Sichuan University, Chengdu, 610064, PR China. E-mail: nic7501@scu.edu.cn; Fax: +86-28-85418451; Tel: +86-28-85418451
bCollege of Chemistry, Sichuan University, Chengdu 610064, PR China. E-mail: wangjianli@scu.edu.cn; Fax: +86-28-85418451; Tel: +86-28-85418451
cCollege of Chemical Engineering, Sichuan University, Chengdu 610064, PR China
First published on 3rd May 2017
Abstract
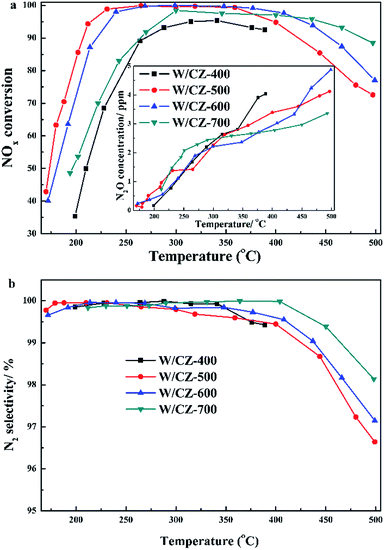
A series of WO3/CeZrO2 catalysts, prepared at different calcination temperatures (400, 500, 600 and 700 °C) of cerium–zirconium mixed oxides (CeZrO2) for the selective catalytic reduction of NOx with ammonia (NH3-SCR), were investigated via various characterizations, such as N2 physisorption, XRD, Raman, NH3-TPD, DRIFTS, XPS and H2-TPR. The catalytic performance of NH3-SCR was remarkably promoted by modestly increasing the calcination temperature of CeZrO2: WO3/CeZrO2-500 possessed the lowest light-off temperature (173 °C) and complete conversion temperature (205 °C), while W/CeZrO2-600 could achieve greater than 90% NOx conversion in a broad temperature range of 220–455 °C. The characterization results indicated that modest enhancement of the calcination temperature of CeZrO2 was beneficial to stabilizing the structure of the catalysts. The largest amount of Lewis acid sites, Ce3+ and surface active oxygen species, as well as strong redox properties of WO3/CeZrO2-500 should together contribute to its better low-temperature deNOx activity. Moreover, increasing the calcination temperature of cerium–zirconium mixed oxides resulted in the enhancement of Brønsted acid sites, which was responsible for the widened operation temperature window. Therefore, WO3/CeZrO2 serial catalysts with appropriate calcination treatment of CeZrO2 would be a good choice for the removal of NOx emitted from diesel engines.
1 Introduction
Nitrogen oxides (NOx), caused by fossil fuel combustion, are notable and known as the major causes of haze, photochemical smog, acid rain, ozone depletion and the greenhouse effect, among various air contaminants. The technique of selective catalytic reduction of NOx with NH3 (NH3-SCR) is the most widely and efficiently employed to control NOx emitted from the coal-fired power plants and the diesel engines, and V2O5–WO3/TiO2 is currently the most commercially used NH3-SCR catalyst in the industry.1–3 However, some disadvantages still exist in this catalyst system, such as poor thermal stability, narrow operating temperature window, the unselective oxidation of NH3, which produces the ozone-depleting, greenhouse gas, N2O, at high temperatures, and sublimated V2O5 generates biological toxicity in the environment.2,4 In order to overcome the above problems and meet the EURO VI standard, it is greatly significant to develop novel eco-friendly NH3-SCR catalysts with outstanding low-temperature deNOx conversion, wide operation temperature window and high N2 selectivity.Recently, CeO2 has been extensively used in various catalytic reactions due to its being non-toxic, inexpensive and having oxygen storage/release properties. Moreover, the addition of ZrO2 into CeO2 can obviously promote the thermal stability and oxygen storage properties of pure CeO2.5,6 In fact, cerium–zirconium mixed oxides have been demonstrated to be one of the most promising materials for deNOx among the new vanadium-free catalytic systems. Li et al.7 reported that the WO3/CeO2–ZrO2 catalyst was efficient for NH3-SCR and 10 wt% WO3/CeO2–ZrO2 could achieve nearly 100% NOx conversion in the temperature range of 200–500 °C with 1![[thin space (1/6-em)]](https://www.rsc.org/images/entities/char_2009.gif) :
:![[thin space (1/6-em)]](https://www.rsc.org/images/entities/char_2009.gif) 1 (molar ratio) of NO/NO2; furthermore, it displayed higher thermal stability than the conventional V2O5–WO3/TiO2 catalyst under similar reaction conditions.
1 (molar ratio) of NO/NO2; furthermore, it displayed higher thermal stability than the conventional V2O5–WO3/TiO2 catalyst under similar reaction conditions.
Cerium–zirconium mixed oxides have recently attracted significant attention and have been modified to improve their catalytic performance in the field of NH3-SCR. Si et al.8 found that more than 80% NOx could be converted over 3.8% NiO-6.2% SO42−/CeO2–ZrO2 catalyst in the temperature range of 280–400 °C, which could result from the fact that the addition of Ni improved the Lewis acidity of CeO2–ZrO2 to increase the low-temperature activity, and Brønsted acid sites introduced by SO42− facilitated NH3 adsorption instead of NH3 oxidation to promote the high-temperature activity. NbOx supported on Ce0.75Zr0.25O2 can also effectively enhance the deNOx activity of cerium–zirconium mixed oxides for the increase of active sites and surface acidity.9 In addition, Ding et al.1 believed that the introduction of Nb remarkably improved the SO2/H2O resistance and hydrothermal ability of CeZrOx. Zhang and his group reported that the NH3-SCR performance of MnOx/CeO2–ZrO2 was significantly dependent on the morphology of Ce0.9Zr0.1O2; the catalyst nanorods having more Mn4+ and adsorbed surface oxygen as well as oxygen vacancies displayed higher NOx conversion than nanotubes and nanopolyhedra.10,11 Our previous works showed that the Fe–W/Ce0.68Zr0.32O2 with Ce/Zr (molar ratio) of 68![[thin space (1/6-em)]](https://www.rsc.org/images/entities/char_2009.gif) :
:![[thin space (1/6-em)]](https://www.rsc.org/images/entities/char_2009.gif) 32 displayed the best NH3-SCR performance, compared to other Fe–W/CexZr1−xO2 with different Ce/Zr.12,13 In the above studies, it has been found that the NH3-SCR activity of WO3/CeZrO2 catalyst was obviously affected by the calcination temperature of the carrier; however, the optimum calcination temperature of cerium–zirconium mixed oxides and the effects of the calcination temperature on the NH3-SCR performance of catalysts have not been investigated to our knowledge, which should play a key role in the practical application of the serial catalysts.
32 displayed the best NH3-SCR performance, compared to other Fe–W/CexZr1−xO2 with different Ce/Zr.12,13 In the above studies, it has been found that the NH3-SCR activity of WO3/CeZrO2 catalyst was obviously affected by the calcination temperature of the carrier; however, the optimum calcination temperature of cerium–zirconium mixed oxides and the effects of the calcination temperature on the NH3-SCR performance of catalysts have not been investigated to our knowledge, which should play a key role in the practical application of the serial catalysts.
In the present study, a series of WO3/CeZrO2 catalysts with different calcination temperatures of CeZrO2 were employed for the NH3-SCR reaction, and the optimum calcination temperature of the carrier and its effects on the NH3-SCR performance were studied separately. The relationships among catalytic activity, structure and surface acidy sites are explored herein. N2 physisorption, XRD, Raman, H2-TPR, XPS, NH3-TPD and NH3-DRIFTS were employed to characterize the physical and chemical properties of the catalysts.
2. Experimental
2.1 Catalyst preparation
The carrier material, cerium–zirconium mixed oxides (CeZrO2, denoted as CZ), was prepared by the conventional co-precipitation method with CeO2/ZrO2 = 68/32 molar ratio; the detailed preparation process has been described in our previous study.13 The obtained precipitate was filtered and washed by de-ionized water, followed by dried at 70 °C for 24 h and at 400, 500, 600 and 700 °C for 3 h, respectively. Finally, CZ-T (where T is the calcination temperature, e.g. 400 °C) powders were obtained as carriers. A series of W/CZ-T catalysts with 10 wt% WO3 were prepared by supporting the precursor ammonium metatungstate (AR grade, 99%, Anda, China) on CZ-T using the incipient wetness impregnation method. The obtained catalyst powders were dried at 70 °C for 24 h, and then calcined at 500 °C for 3 h in air (except that the W/CZ-400 catalyst was calcined at 400 °C). The resulting four catalyst powders were subsequently coated on honeycomb cordierites (cylinder, diameter: 11 mm, length: 26 mm, bulk: 2.5 cm3, 62 cell per cm2, Corning, USA), and then dried at 120 °C overnight and calcined at 400 °C (only the W/CZ-400 catalyst) or 500 °C for 3 h. Finally, a series of W/CZ-T monolithic catalysts with the coating content of about 160 g L−1 was obtained.2.2 Catalytic activity measurements
The NH3-SCR activity measurements of the prepared monolithic catalysts were carried out in a fixed-bed quartz tube flow reactor at atmospheric pressure. The flue gas composition was as follows: 500 ppm NO, 500 ppm NH3, 5% O2, balance N2. The premixed gases (2.0% NO in N2, 2.0% NH3 in N2 and 99.99% O2) were supplied by Testing Technology Research Institute, China. Reactant gases were regulated by mass-flow controllers before entering the reactor. Under typical conditions, 2.5 cm3 monolithic catalyst sample was used in each run and the total flow rate was about 1250 mL min−1, yielding the GHSV of 30![[thin space (1/6-em)]](https://www.rsc.org/images/entities/char_2009.gif) 000 h−1 by volume. The separate NH3/NO oxidation activity was tested in the absence of NO/NH3, respectively. The concentrations of NH3, NOx and N2O in the inlet and outlet gases were continually analyzed by an FT-IR (Antaris IGS, Nicolet). The data were recorded after 30 min when the reaction reached a steady state for each test.
000 h−1 by volume. The separate NH3/NO oxidation activity was tested in the absence of NO/NH3, respectively. The concentrations of NH3, NOx and N2O in the inlet and outlet gases were continually analyzed by an FT-IR (Antaris IGS, Nicolet). The data were recorded after 30 min when the reaction reached a steady state for each test.
The NOx/NH3 conversions (XNOx/XNH3) and N2 selectivity (SN2) were calculated as follows:
 | (1) |
 | (2) |
2.3 Characterizations
The textural properties of all catalysts were measured by N2 adsorption–desorption at −196 °C on a Quantachrome automated surface area & pore size analyzer (Autosorb SI). The samples were pretreated at 300 °C for 3 h prior to the measurement. The surface areas were determined by the Brunauer–Emmett–Teller (BET) model.Powder X-ray diffraction (XRD) patterns of samples were collected in the 2θ range of 10–80° using a Rigaku D/max-RA diffractometer equipped with a Cu Kα (λ = 0.15406 nm) radiation resource operated at 40 kV and 100 mA, respectively.
Visible Raman spectra of all catalysts were collected on a Lab-RAM HR laser Raman spectrograph with a spectral resolution of 2 cm−1 at room temperature. A Nd:Yag laser of 532 nm was used as the excitation source, with a power output of 30 mW. All specimens were illuminated through a 50× objective and in powder form to prevent diffusion problems. Raman spectra were collected and recorded over the spectral range of 200–1000 cm−1. The specification of the grating was 600 g mm−1.
The in situ diffuse-reflectance infrared Fourier transform spectroscopy (DRIFTS) of adsorbed species arising from NH3 adsorption at various temperatures over the catalysts, were collected in the range of 4000–650 cm−1 using Thermo Nicolet 6700 FTIR spectrometer. Diffuse reflectance measurements were performed in situ in a high temperature cell equipped with a KBr window. The catalyst was heated to 350 °C under N2 at a total flow rate of 100 mL min−1 for 1 h to remove any adsorbed impurities, then it was cooled down to 50 °C, exposed to 1000 ppm NH3/N2 (100 mL min−1) for 1 h, and subsequently flushed with N2. Afterwards, the DRIFTS spectra of catalysts were collected between 50 and 300 °C at a 50 °C interval. The background spectrum was collected once every 50 °C in the flowing N2 during the cooling process.
NH3-TPD experiments were carried out in a fixed-bed quartz reactor. A typical sample mass of 100 mg and a gas flow rate of 30 mL min−1 were used during the experiments. The experiment included four stages: (1) degasification of the sample in N2 at 400 °C for 1 h to clear the surface, (2) adsorption of 2 vol% NH3-98% N2 at 120 °C for 1 h, (3) isothermal desorption in N2 at 120 °C until no NH3 was detected and (4) temperature programmed desorption in N2 at 10 °C min−1 up to 500 °C. The detector was a thermal conductivity detector.
The X-ray photoelectron spectral (XPS) data were recorded on a Thermo Escalab 250Xi electron spectrophotometer at 15 kV and 14.9 mA electric current using Al Kα radiation (1486.6 eV), and operating in a constant pass energy mode (20 eV pass energy). The C 1s peak at 284.8 eV was used for the calibration of binding energy values, and the semi-quantitative surface relative atomic concentrations were obtained from eqn (3). The pressure in the analytical chamber was about 10−8 Pa.
 | (3) |
Temperature programmed reduction of H2 (H2-TPR) experiments were performed in TP-5076 (Xianquan, Tianjin) with a thermal conductivity detector. All catalysts (100 mg) were pretreated in a quartz tubular mico-reactor in a flow of N2 at 450 °C for 1 h to yield a clean surface, and then cooled down to room temperature. The reduction was carried out in a flow of 5 vol% H2 to 95 vol% N2 to 750 °C, with a heating rate of 10 °C min−1.
3 Results and discussion
3.1 Catalytic performance
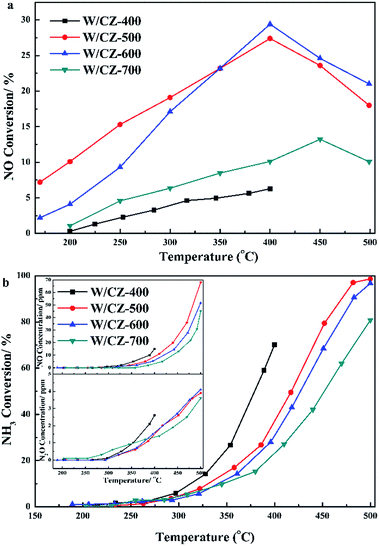
Moreover, the seperated NH3 oxidation tests were also carried out over catalysts and the results are presented in Fig. 2b. W/CZ-400 possessed the highest NH3 oxidation ability among the four catalysts. The activity of NH3 oxidation over the catalysts increased in the sequence of W/CZ-700 < W/CZ-600 < W/CZ-500 < W/CZ-400, which was consistent with the order of the high-temperature NOx conversion in Fig. 1a. This meant that W/CZ-700 possessed the highest NH3-SCR activity in the high temperature range (above 400 °C), while the minimum high-temperature NOx conversion was obtained over the W/CZ-400 catalyst. Furthermore, it could be seen that NO was the main product besides N2 for the NH3 oxidation reaction, and no more than 5 ppm N2O was generated over all catalysts, shown in the insets of Fig. 2b. However, the generated amount of NO over W/CZ-500 was obviously larger than those over W/CZ-600 and W/CZ-700 catalysts, which further proved that the decrease in the high-temperature NOx conversion of W/CZ-500 can be ascribed to the generation of more NO from the non-selective oxidation of NH3.
| Reaction conditions | W/CZ-500 (°C) | W/CZ-600 (°C) | ||
|---|---|---|---|---|
| T50 | T90 | T50 | T90 | |
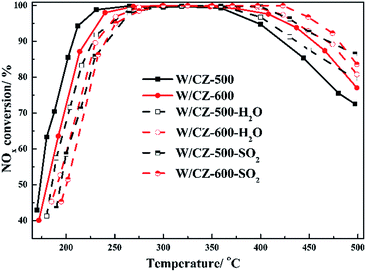
| Without | 173 | 205 | 180 | 220 |
| H2O | 186 | 227 | 190 | 231 |
| SO2 | 194 | 242 | 201 | 240 |
3.2 N2 physisorption
Textural properties, including the surface area, average pore radius and cumulative pore volume of W/CZ-T catalysts, were listed in Table 2, and the corresponding N2 adsorption–desorption isotherms and pore size distributions of catalysts were shown in Fig. 4a and b, respectively. For all catalysts, the isotherms corresponded to type IV with H2 hysteresis loop, with a relatively wide ink-bottle shaped pore according to the IUPAC classification, indicating the presence of a mesoporous texture.18–20 With increasing calcination temperature, the N2 adsorbed volume per weight showed an obvious decrease and the closure point of the hysteresis loop also moved to higher P/P0, revealing that much more large mesopores were formed after high temperature calcination of the carrier. The pore radius of the serial catalysts increased as described by Kelvin equation in the following order: W/CZ-700 > W/CZ-600 > W/CZ-500 > W/CZ-400, while the surface area and cumulative pore volume of catalysts exhibited an inverse order as shown in Table 2.| Samples | Surface area (m2 g−1) | Pore volume (cm3 g−1) | Pore radius (nm) | Decreasing rate of the surface area (%) |
|---|---|---|---|---|
| W/CZ-400 | 112.0 | 0.24 | 3.9 | — |
| W/CZ-500 | 93.6 | 0.21 | 5.3 | 16.4 |
| W/CZ-600 | 82.9 | 0.19 | 5.7 | 11.4 |
| W/CZ-700 | 52.8 | 0.15 | 6.0 | 33.1 |
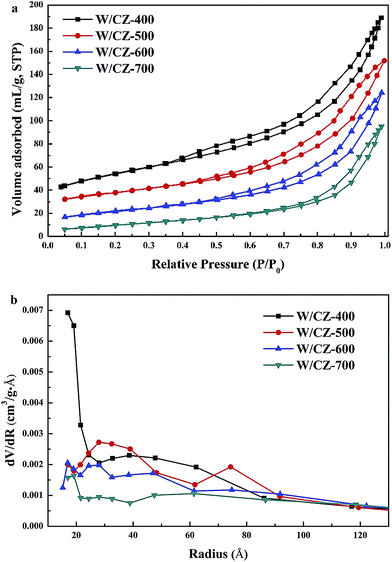 | ||
| Fig. 4 Nitrogen adsorption/desorption isotherms (a) and the pore size distributions (b) of W/CZ-T catalysts. | ||
Fig. 4b exhibited the pore size distributions of catalysts with different calcination temperatures of the carrier. For the serial catalysts, as the calcination temperature increased, the pore radii shifted to higher values, which was attributed to the coagulation of nanoparticles, leading to the grain growth and thus to the elimination of smaller pores and the formation of larger ones.21 It has been proved that the pore radius and pore volume affect the mass and heat transformation of the reactants and products.22 As summarized in Table 2, W/CZ-400 possessed the largest pore volume, but its pore radius was the smallest among the four samples, and pores were mainly distributed in the range of ≤ 2 nm, from Fig. 4b, which could inhibit the mass transformation of the reactant molecules. W/CZ-700 had the largest pore radius, but most of the pores were collapsed, leading to the decrease in pore volume, which could make the movement of the reactant molecules to the reaction active sits difficult. However, compared with the two catalysts analysed above, the W/CZ-500 and W/CZ-600 catalysts exhibited the appropriate pore volume and radius, which was beneficial to the mass transformation of the reactant molecules and the contact with the active sites, and finally improved the NH3-SCR activity. Moreover, the decreasing ratio (summarized in Table 2) of the surface area from W/CZ-500 to W/CZ-600 was smaller than those from W/CZ-400 to W/CZ-500 and from W/CZ-600 to W/CZ-700. This suggested that the W/CZ-500 and W/CZ-600 catalysts, with the support calcined at the temperature range of 500–600 °C, could hold relatively stable textural properties.
3.3 XRD
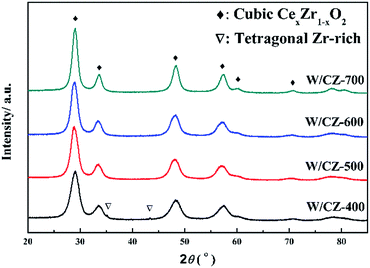
XRD patterns of W/CZ-T catalysts are depicted in Fig. 5 and the detailed parameters were listed in Table 3. Cubic Ce0.75Zr0.25O2 phases (PDF-28-0271) were detected in the XRD patterns of W/CZ-400, W/CZ-500 and W/CZ-600, and with enhancing calcination temperature, an increase in the intensity of diffraction peaks could be seen due to better crystallization of this cubic phase. It was worth noting that the 2θ value showed a slight shift to higher values with increasing calcination temperature, and the cubic Zr0.4Ce0.6O2 phase (PDF-38-1439) was detected over W/CZ-700 catalyst (Fig. 5). According to the literature,19,21 the radius of Zr4+ (0.84 Å) is smaller than that of Ce4+ (0.97 Å), and the incorporation of zirconia into the ceria lattice led to the shrinkage of the crystal cells, which induced a shift of 2θ value to higher values. Consequently, the incorporation of more zirconia into the ceria lattice resulted in an increase in the 2θ value after higher temperature calcination. Furthermore, in Table 3, the average crystallite size of CexZr1−xO2 calculated by the Scherrer equation was enhanced from 4.9 nm to 6.8 nm by increasing the calcination temperature from 400 °C to 700 °C, which suggested a progressive increase of Zr content into the Ce cubic lattice and the crystal sintering with the increase of the calcination temperature.22 However, the crystal size of CexZr1−xO2 increased by 12.2%, from 4.9 nm at 400 °C to 5.5 nm at 500 °C; but it only increased by 5.4% from 5.5 nm to 5.8 nm, implying that the crystal size was basically unchanged when the calcination temperature increased from 500 °C to 600 °C; when the temperature was further increased to 700 °C, the crystal size increased by 17.2% from 5.8 nm to 6.8 nm. The above results further implied that the catalyst could retain a stable structure when the CZ carrier was calcined between 500 °C and 600 °C.| Samples | Phase | 2θ (°) | Crystal size (nm) | Increasing rate of the crystal size |
|---|---|---|---|---|
| W/CZ-400 | Ce0.75Zr0.25O2 | 28.75 | 4.9 | — |
| W/CZ-500 | Ce0.75Zr0.25O2 | 28.87 | 5.5 | 12.2% |
| W/CZ-600 | Ce0.75Zr0.25O2 | 28.95 | 5.8 | 5.4% |
| W/CZ-700 | Zr0.4Ce0.6O2 | 29.05 | 6.8 | 17.2% |
Additionally, two weak diffraction peaks located at 35.2° and 43.5° could be observed in the pattern of W/CZ-400, which could be ascribed to the tragonal Zr-rich phases. The presence of the tetragonal Zr-rich phase implies the structural heterogeneity of W/CZ-400, which could depress NOx conversion.23 There was no evidence of the presence of any ZrO2 phases from the other three catalysts within the detection limits of the XRD technique, or the remaining zirconia was mostly in amorphous form and was probably located in grain boundaries.24 The crystallite size of W/CZ-700 evidently increased after calcination at 700 °C, as a result of the particle aggregation; moreover, the transformation from cubic Ce0.75Zr0.25O2 to cubic Zr0.4Ce0.6O2 phase existed in the process of increased calcination from 400 to 700 °C. The above two phenomena both resulted in the decrease in textural properties of W/CZ-700 (in Table 2) and could go against the dispersion of WO3 on CZ, which finally decreased the NH3-SCR activity of W/CZ-700. It was interesting that no diffraction peak ascribed to crystalline tungsten species could be observed, so it could be assumed that the impregnated tungsten oxides were in a highly dispersed or amorphous state on the surface of CZ.
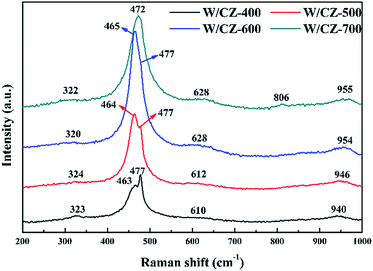
3.4 Raman spectroscopy
As an effective characterization technique to achieve detailed information about the fine structure, normalized Raman spectroscopy studies were conducted on W/CZ-T catalysts, and the results were presented in Fig. 6. The prominent peak at about 465 cm−1 corresponded to the F2g vibration mode of cubic CeO2, which could be considered as the symmetric breathing vibrational mode of the O anions around Ce cations.19,22 However, a shift in the Raman frequency to higher wavenumber from 463 cm−1 at 400 °C to 472 cm−1 at 700 °C was observed, which resulted from the incorporation of more Zr into the lattice of the cerium zirconium solid solution, as evidenced by XRD results. It was surprise that a less prominent band at around 477 cm−1 was visible in the Raman spectra of catalysts; the intensity of this band gradually decreased with increasing the calcination temperature, and finally the band vanished in the spectrum of W/CZ-700. Combined with the analysis of XRD, this Raman band could be ascribed to the tetragonal ZrO2 or Zr-rich phase. The above phenomenon further corroborated the XRD results, which signified that more Zr was incorporated into the Ce–Zr solid solution with the increase of calcination temperature, the composition of the cubic phase was changed and caused the disappearance of the Raman band ascribed to tetragonal ZrO2, until 700 °C.24 In addition, another two peaks located at around 320 and 620 cm−1 for all samples in Fig. 5 could be attributed to the existence of a defective structure.25A broad weak peak centered at approximately 950 cm−1 was found for all catalysts, which may be ascribed to the symmetrical W![[double bond, length as m-dash]](https://www.rsc.org/images/entities/char_e001.gif) O stretching mode of the dispersed tungsten oxide species on the surface of the support.26 The intensity of the band for W/CZ-600 was the strongest among the investigated samples, suggesting that the catalyst possessed more highly dispersed WO3 on the carrier than the other catalysts. Under the same loading conditions of WO3 for the four catalysts, higher surface area was conducive to the dispersion of WO3 on the carrier CZ, while W/CZ-700 with the smallest surface area may result in the micro-crystallization of WO3. In the spectrum, the band at around 806 cm−1 was only observed for W/CZ-700, likely due to the presence of polytungstate species, which also showed lower dispersion of WO3 due to smaller surface area after calcination at 700 °C.27–29 Therefore, higher calcination temperature could inhibit the dispersion of WO3 on the surface of CZ, which may decrease the surface acidity of catalysts and finally affect the NH3-SCR activity.
O stretching mode of the dispersed tungsten oxide species on the surface of the support.26 The intensity of the band for W/CZ-600 was the strongest among the investigated samples, suggesting that the catalyst possessed more highly dispersed WO3 on the carrier than the other catalysts. Under the same loading conditions of WO3 for the four catalysts, higher surface area was conducive to the dispersion of WO3 on the carrier CZ, while W/CZ-700 with the smallest surface area may result in the micro-crystallization of WO3. In the spectrum, the band at around 806 cm−1 was only observed for W/CZ-700, likely due to the presence of polytungstate species, which also showed lower dispersion of WO3 due to smaller surface area after calcination at 700 °C.27–29 Therefore, higher calcination temperature could inhibit the dispersion of WO3 on the surface of CZ, which may decrease the surface acidity of catalysts and finally affect the NH3-SCR activity.
3.5 Acidity
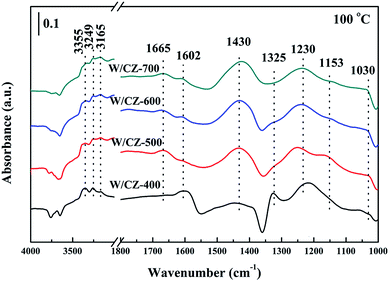
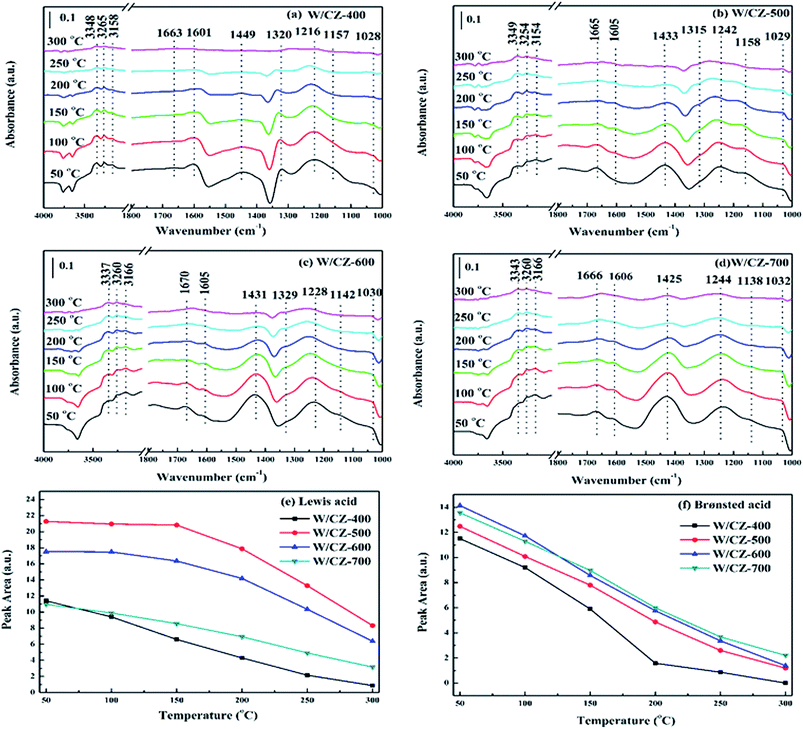
In order to further investigate the acid strength, NH3 desorption was performed on the W/CZ-T series catalysts in the temperature range of 50–300 °C, and the results were displayed in Fig. 8a–d. For the four catalysts, peak intensities corresponding to both Lewis and Brønsted acid sites decreased with increasing measurement temperature, and the Lewis acid sites presented higher stability, compared with the Brønsted acid sites: at 300 °C, the band at 1240 cm−1 could be obviously observed, whereas the band at about 1430 cm−1 nearly disappeared, except for W/CZ-700, which could be a reason for the higher activity of W/CZ-700 than other catalysts at high temperatures.
To illustrate in detail the relationships between the changes in acid sites and the NH3-SCR activity, the Lewis and Brønsted acidities of W/CZ-T catalysts were obtained by calculating the areas of the corresponding DRIFTS spectra (from Fig. 8a–d) at the different temperatures, and the results were shown in Fig. 7e and f, respectively. The total acidity (Lewis acidity plus Brønsted acidity) of catalysts decreased in the sequence: W/CZ-500 > W/CZ-600 > W/CZ-700 > W/CZ-400. Both Lewis and Brønsted acidities over all catalysts decreased with increasing measurement temperature. Among the investigated catalysts, W/CZ-500 possessed the largest amount of Lewis acid sites at each temperature. Further improving the calcination temperature resulted in the decline of the total Lewis acidity over W/CZ-600 and W/CZ-700, while the total Lewis acidity of W/CZ-400 was lower than that of W/CZ-700, as shown in Fig. 8e. The above analyses were consistent with the low-temperature SCR activity, because the literature has proposed that a low reaction temperature was favourable for NH3 adsorption to form Lewis acid sites, which was beneficial for improving the low-temperature NH3-SCR activity.31,34,35 Furthermore, in Fig. 8e, the amount of the total Brønsted acidity was gradually enhanced by improving the calcination temperature of CZ from 400 °C to 700 °C, which meant that the increase in the calcination temperature resulted in the generation of more Brønsted acid sites on the catalyst surface. NH3 oxidation was mostly carried out on the Lewis acid sites rather than on Brønsted acid sites; more Brønsted acid sites could inhibit the oxidation of NH3 and promote the high-temperature NH3-SCR activity.8,35 The changes in NH3-SCR activity in Fig. 1 and NH3 oxidation activity in Fig. 2b both followed the above rules. In short, W/CZ-500, with the most Lewis acid sites and the relatively small amount of Brønsted acid sites, showed the highest low-temperature SCR activity and relatively lower high-temperature activity; while W/CZ-600 (700) possessed better high-temperature activity than other W/CZ-T catalysts.
| Samples | Low temperature | High temperature | Total (a.u.) | ||||
|---|---|---|---|---|---|---|---|
| Ta (°C) | L1 (a.u.) | Ta (°C) | B (a.u.) | Ta (°C) | L2 (a.u.) | ||
| a Central temperature of the reduction peak. | |||||||
| W/CZ-400 | 150 | 2930 | 237 | 6904 | 372 | 961 | 10![[thin space (1/6-em)]](https://www.rsc.org/images/entities/char_2009.gif) 795 795 |
| W/CZ-500 | 134 | 6982 | 229 | 13![[thin space (1/6-em)]](https://www.rsc.org/images/entities/char_2009.gif) 507 507 |
350 | 3830 | 24![[thin space (1/6-em)]](https://www.rsc.org/images/entities/char_2009.gif) 319 319 |
| W/CZ-600 | 146 | 4405 | 236 | 15![[thin space (1/6-em)]](https://www.rsc.org/images/entities/char_2009.gif) 263 263 |
368 | 1550 | 21![[thin space (1/6-em)]](https://www.rsc.org/images/entities/char_2009.gif) 218 218 |
| W/CZ-700 | 151 | 4020 | 234 | 14![[thin space (1/6-em)]](https://www.rsc.org/images/entities/char_2009.gif) 960 960 |
362 | 1973 | 20![[thin space (1/6-em)]](https://www.rsc.org/images/entities/char_2009.gif) 953 953 |
3.6 XPS
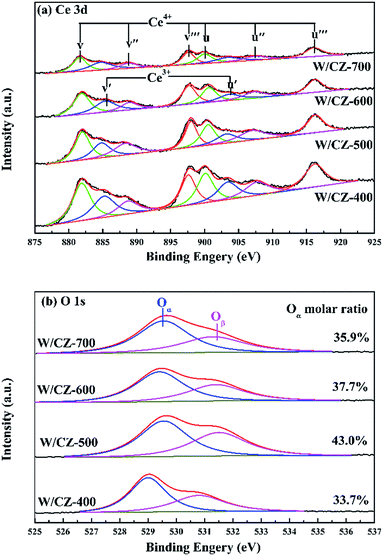
W/CZ-T catalysts were investigated using the XPS technique to achieve a better understanding of the surface chemical state for different elements over the catalysts. The surface atomic concentrations of elements were summarized in Table 5, and the XPS spectra of Ce 3d and O 1s were presented in Fig. 10a and b, respectively.| Samples | Surface atom concentration from XPS (%) | Oβ/(Oα + Oβ) (%) | Ce3+/(Ce3+ + Ce4+) (%) | |||
|---|---|---|---|---|---|---|
| O | Ce | Zr | W | |||
| W/CZ-400 | 72.9 | 15.1 | 9.4 | 2.6 | 33.7 | 19.5 |
| W/CZ-500 | 78.8 | 11.1 | 7.1 | 3.0 | 43.0 | 22.7 |
| W/CZ-600 | 77.7 | 9.1 | 9.5 | 3.7 | 37.7 | 20.5 |
| W/CZ-700 | 77.6 | 6.4 | 11.4 | 4.6 | 35.9 | 18.6 |
The intensities of XPS peaks corresponding to Ce 3d clearly decreased with increasing the calcination temperature of CZ, as shown in Fig. 10a. The atomic ratios of Ce3+/(Ce3+ + Ce4+) in Ce on the catalyst surface were calculated by referring the literature, and the value of W/CZ-500 was obviously larger than those of other catalysts.8,35 It is well known that more Ce3+ could generate the charge imbalance and unsaturated chemical bonds, which could promote the formation of oxygen vacancies and less bound oxygen.9 The curves of O 1s could be fitted to two peaks for all the catalysts, shown in Fig. 10b. The primary peak centered at about 529.5 eV was attributed to the lattice oxygen O22− in metal oxides, denoted as Oα, while the additional shoulder peak located at about 531.4 eV was assigned to the chemisorbed oxygen, such as O2−, O− and OH groups belonging to some deficiencies in the surface of transition metal oxides and hydroxyl-like groups, labeled as Oβ.13,37 In Fig. 10b, it was obvious that the binding energy (BEs) of the Oα band for W/CZ-400 was lower than (about 0.5 eV) that of other catalysts, but further increasing the calcination temperature of CZ did not lead to an obvious change in the BE of O 1s. The above phenomena indicated that W/CZ-400 possessed more lattice oxygen species located at lower BE; i.e., other catalysts had more surface chemisorbed oxygen at higher BE. This is in accordance with the change trend of the relative amount of Oβ listed in Table 5. The relative amount of Oβ was quantified based on the area of Oβ divided by the sum of the area of Oα and Oβ, which were 33.7%, 43%, 37.7% and 35.9% over W/CZ-400, W/CZ-500, W/CZ-600 and W/CZ-700, respectively. The above changes in Oβ/(Oα + Oβ) over W/CZ-T catalysts were accompanied by the same trend for the values of Ce3+/(Ce3+ + Ce4+), because the formation of more Ce3+ could directly increase the relative amount of the chemisorbed oxygen species and promote the oxidation ability of catalysts.28 Thus, more Ce3+ and surface chemisorbed oxygen were helpful to promote the oxidation of NO to NO2, which was well in agreement with the results of NO oxidation (Fig. 2a). It has been proved that the low-temperature NH3-SCR activity can be accelerated by introducing some NO2 into the NH3-SCR system due to the “Fast SCR” reaction.38 Therefore, W/CZ-500 displayed the best low-temperature NH3-SCR activity because of the largest amounts of Ce3+ and surface chemisorbed oxygen among the investigated catalysts.
3.7 H2-TPR
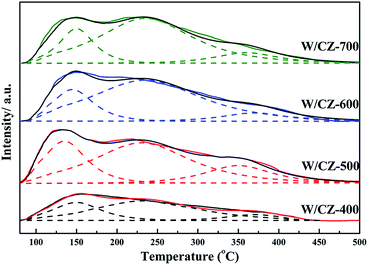
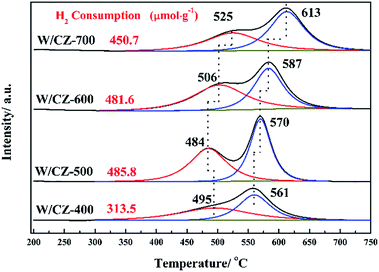
Fig. 11 displayed the H2-TPR profiles of W/CZ-T catalysts to estimate the effect of the calcination temperature of CZ on the reducibility of different catalysts. H2 consumption of different reduction peaks was calculated by deconvoluting the curves and using CuO as the standard sample, the results were listed in Table 6. As seen from Fig. 11, peak 1 was ascribed to the reduction of the surface active oxygen from CZ mixed oxides; peak 2 could be attributed to the reduction of the lattice oxygen from the bulk metal oxides, i.e., non-active lattice oxygen.12,39 Obviously, the calcination temperature of the carrier modified the redox properties of W/CZ-T catalysts. In Fig. 11, the central temperatures of the reduction peaks gradually shifted to higher temperatures with improving the calcination temperature, but the reduction temperature of active oxygen species (peak 1) on W/CZ-500 was significantly lower than those of other catalysts by 10–40 °C, implying the occurrence of a more facile reduction over W/CZ-500 at lower temperatures. Moreover, W/CZ-500 possessed the largest amount of surface active oxygen species among the investigated catalysts; the sequence for the amount of surface active oxygen species was W/CZ-500 > W/CZ-600 > W/CZ-700 > W/CZ-400. This trend was consistent with the change in surface chemisorbed oxygen as summarized in Table 5 from XPS, so it also correlated well with the results of NO and NH3 oxidation activity as presented in Fig. 2a and b, which further illuminated the reasons for the excellent low-temperature NH3-SCR activity of W/CZ-500 and the better high-temperature NOx conversion of W/CZ-600 (700).28,404 Conclusions
CeZrO2 carriers were obtained at different calcination temperatures to prepare WO3/Ce0.68Zr0.32O2 serial catalysts for application in the NH3-SCR reaction. The calcination temperature remarkably affected the NH3-SCR activity and the operation temperature window of the catalysts. Among them, WO3/CeZrO2-500 with CeZrO2 calcined at 500 °C showed excellent low-temperature activity (achieved greater than 90% NOx conversion at 205 °C) and WO3/CeZrO2-600 exhibited the broadest operation temperature window (220–455 °C). The characterization results demonstrated that the WO3/CeZrO2-500 catalyst possessed the largest amounts of Lewis acid sites and Ce3+ with surface active oxygen species, and the strongest redox properties among all the catalysts, all of which were responsible for its remarkable low-temperature NH3-SCR activity. More Brønsted acid sites were detected over WO3/CeZrO2-600 than WO3/CeZrO2-500, which contributed to its having the broadest operation temperature window among the four catalysts. WO3/CeZrO2 serial catalysts with modest calcination treatment of the carrier are promising candidates for the elimination of NOx from diesel engines.Acknowledgements
This work was financially supported by the National High-Tech Research and Development (863) Program of China (Grant 2015AA034603) and the Science and Technology Project of Chengdu City (Grant 2015-HM01-00475-SF).References
- S. Ding, F. Liu, X. Shi and H. He, Appl. Catal., B, 2016, 180, 766–774 CrossRef CAS.
- C. Tang, H. Zhang and L. Dong, Catal. Sci. Technol., 2016, 6, 1248–1264 CAS.
- S. S. R. Putluru, L. Schill, A. Godiksen, R. Poreddy, S. Mossin and R. Fehrmann, Appl. Catal., B, 2016, 183, 282–290 CrossRef CAS.
- W. Shan, Y. Geng, X. Chen, N. Huang, F. Liu and S. Yang, Catal. Sci. Technol., 2016, 6, 1195–1200 CAS.
- J. Kašpar, P. Fornasiero and M. Graziani, Catal. Today, 1999, 50, 285–298 CrossRef.
- H. W. Jen, G. W. Graham, W. Chun, R. W. McCabe, J. P. Cuif, S. E. Deutsch and O. Touret, Catal. Today, 1999, 50, 309–328 CrossRef CAS.
- Y. Li, H. Cheng, D. Li, Y. Qin, Y. Xie and S. Wang, Chem. Commun., 2008, 12, 1470–1472 RSC.
- Z. Si, D. Weng, X. Wu, J. Yang and B. Wang, Catal. Commun., 2010, 11, 1045–1048 CrossRef CAS.
- Z. Ma, X. Wu, Z. Si, D. Weng, J. Ma and T. Xu, Appl. Catal., B, 2015, 179, 380–394 CrossRef CAS.
- R. Gao, D. Zhang, P. Maitarad, L. Shi, T. Rungrotmongkol, H. Li, J. Zhang and W. Cao, J. Phys. Chem. C, 2013, 117, 10502–10511 CAS.
- P. Maitarad, D. Zhang, R. Gao, L. Shi, H. Li, L. Huang, T. Rungrotmongkol and J. Zhang, J. Phys. Chem. C, 2013, 117, 9999–10006 CAS.
- H. Xu, Y. Wang, Y. Cao, Z. Fang, T. Lin, M. Gong and Y. Chen, Chin. Sci. Bull., 2014, 59, 3956–3965 CrossRef CAS.
- H. Xu, Y. Li, B. Xu, Y. Cao, X. Feng, M. Sun, M. Gong and Y. Chen, J. Ind. Eng. Chem., 2016, 36, 334–345 CrossRef CAS.
- Z. Huang, Z. Zhu and Z. Liu, Appl. Catal., B, 2002, 39, 361–368 CrossRef CAS.
- C. Lin and H. Bai, Ind. Eng. Chem. Res., 2004, 43, 5983–5988 CrossRef CAS.
- L. Chen, J. Li, M. Ge and R. Zhu, Catal. Today, 2010, 153, 77–83 CrossRef CAS.
- H. Xu, Y. Wang, Y. Cao, Z. Fang, T. Lin, M. Gong and Y. Chen, Chem. Eng. J., 2014, 240, 62–73 CrossRef CAS.
- D. Zhao, Q. Huo, J. Feng, B. F. Chmelka and G. D. Stucky, J. Am. Chem. Soc., 1998, 120, 6024–6036 CrossRef CAS.
- Y. Cui, R. Fang, H. Shang, Z. Shi, M. Gong and Y. Chen, J. Alloys Compd., 2015, 628, 213–221 CrossRef CAS.
- G. Leofanti, M. Padovan, G. Tozzola and B. Venturelli, Catal. Today, 1998, 41, 207–219 CrossRef CAS.
- A. Papavasiliou, A. Tsetsekou, V. Matsouka, M. Konsolakis, I. V. Yentekakis and N. Boukos, Appl. Catal., B, 2009, 90, 162–174 CrossRef CAS.
- L. Lan, S. Chen, Y. Cao, M. Zhao, M. Gong and Y. Chen, J. Colloid Interface Sci., 2015, 450, 404–416 CrossRef CAS PubMed.
- P. Ning, Z. Song, H. Li, Q. Zhang, X. Liu, J. Zhang, X. Tang and Z. Huang, Appl. Surf. Sci., 2015, 332, 130–137 CrossRef CAS.
- B. M. Reddy and A. Khan, Langmuir, 2003, 19, 3025–3030 CrossRef CAS.
- B. M. Reddy, A. Khan, P. Lakshmanan, M. Aouine, S. Loridant and J. C. Volta, J. Phys. Chem. B, 2005, 109, 3355–3363 CrossRef CAS PubMed.
- X. Li, M. Shen, H. Zhu, F. Gao, Y. Kong, L. Dong and Y. Chen, J. Phys. Chem. B, 2005, 109, 3949–3955 CrossRef CAS PubMed.
- S. S. Chan, I. E. Wachs and L. L. Murrell, J. Catal., 1984, 90, 150–155 CrossRef CAS.
- Y. Peng, K. Li and J. Li, Appl. Catal., B, 2013, 140–141, 483–492 CrossRef CAS.
- A. Gutiérrez-Alejandre, P. Castillo, J. Ramírez, G. Ramis and G. Busca, Appl. Catal., A, 2001, 216, 181–194 CrossRef.
- Y. Peng, C. Liu, X. Zhang and J. Li, Appl. Catal., B, 2013, 140–141, 276–282 CrossRef CAS.
- S. Ding, F. Liu, X. Shi, K. Liu, Z. Lian, L. Xie and H. He, ACS Appl. Mater. Interfaces, 2015, 7, 9497–9506 CAS.
- A. S. Mamede, E. Payen, P. Grange, G. Poncelet, A. Ion, M. Alifanti and V. I. Pârvulescu, J. Catal., 2004, 223, 1–12 CrossRef CAS.
- N. Yang, R. Guo, W. Pan, Q. Chen, Q. Wang and C. Lu, Fuel, 2016, 169, 87–92 CrossRef CAS.
- L. Lietti and P. Forzatti, J. Catal., 1994, 147, 241–249 CrossRef CAS.
- H. Xu, Q. Zhang, C. Qiu, T. Lin, M. Gong and Y. Chen, Chem. Eng. Sci., 2012, 76, 120–128 CrossRef CAS.
- R. Foo, T. Vazhnova, D. B. Lukyanov, P. Millington, J. Collier, R. Rajaram and S. Golunski, Appl. Catal., B, 2015, 162, 174–179 CrossRef CAS.
- X. Du, X. Gao, Y. Fu, F. Gao, Z. Luo and K. Cen, J. Colloid Interface Sci., 2012, 368, 406–412 CrossRef CAS PubMed.
- F. Liu, H. He, Y. Ding and C. Zhang, Appl. Catal., B, 2009, 93, 194–204 CrossRef CAS.
- J. Yu, Z. Si, L. Chen, X. Wu and D. Weng, Appl. Catal., B, 2015, 163, 223–232 CrossRef CAS.
- P. W. Seo, S. P. Cho, S. H. Hong and S. C. Hong, Appl. Catal., A, 2010, 380, 21–27 CrossRef CAS.
| This journal is © The Royal Society of Chemistry 2017 |

