 Open Access Article
Creative Commons Attribution 3.0 Unported Licence
Effect of hypoxia on the pharmacokinetics and metabolism of zaleplon as a probe of CYP3A1/2 activity
Wenwen Gongac,
Pingxiang Xua,
Shanshan Guoa,
Xiaorong Lia,
Zengliang Jina,
Yuming Zhaoa,
Ming Fan*b and
Ming Xue *a
*a
aDepartment of Pharmacology, Beijing Laboratory for Biomedical Detection Technology and Instrument, School of Basic Medical Sciences, Capital Medical University, Beijing 100069, China. E-mail: xuem@ccmu.edu.cn
bDepartment of Nerobiology, School of Basic Medical Sciences, Capital Medical University, Beijing, China. E-mail: fanmingchina@126.com
cDepartment of Pharmacology, Military General Hospital of Beijing PLA, Beijing, China
First published on 11th May 2017
Abstract
The objective of this study was to compare the pharmacokinetics and metabolism of zaleplon (ZAL) in rats under hypoxic and normoxic condition and the effect of hypoxia on the protein expression and activities of the main metabolic enzyme CYP3A1/2. The LC-MS/MS method was successfully used for the determination of ZAL in rat plasma after an oral administration under normoxic and hypoxic exposure. The expressions of CYP3A1/2 proteins were determined by the Western blotting method. The activity of CYP3A1/2 in rat liver microsomes was determined by the LC-MS/MS method using testosterone as the probe drug. The metabolites of ZAL in rats were identified by LC-MSn by comparison of their ESI-MSn spectra and chromatographic retention times to those of the parent drug between the normoxic and the hypoxic group. The results indicated that the values of AUC and Cmax were significantly higher in the hypoxia exposure for 3 d (H3) group than that in the normoxic group, and the Vd and CL were markedly lower in the H3 group than those in the normoxic group. Hypoxia could markedly inhibit the protein expression and activities of CYP3A1/2, resulting in reduction of the metabolic rate of the drug and enhancement of the systematic exposure. Our data indicated that the expression and activity of CYP3A1/2 mainly affected the drug metabolism and pharmacokinetic characteristics of ZAL under the hypoxic condition.
Introduction
Zaleplon (ZAL) is a nonbenzodiazepine sedative-hypnotic drug and is a member of the pyrazolopyrimidine class of compounds, which preferentially binds to the benzodiazepine-binding site on the γ-aminobutyric acid (GABA) receptors containing the α1 receptor subunit.1–3 The pharmacokinetic results indicate that ZAL is absorbed rapidly and reaches peak plasma concentration in about 1 hour. Its half-life is approximately 1 hour in humans. This drug is mainly metabolized by CYP3A4 in humans and CYP3A1/2 in rats.4 ZAL has some conspicuous advantages in treatment of insomnia such as quick effect, reduced hangover, rebound insomnia and withdrawal symptoms.Hypoxia can cause dysfunction, damage and death to cells, tissues and organisms, and is associated with many pathophysiological processes and diseases such as stroke, asthma, emphysema, angina pectoris, myocardial infarction and tumors.5 Hypoxia induced at high altitude causes a subnormal oxygen concentration in cells which affects the drug metabolic and pharmacokinetic capacity.6,7 Several studies indicate that hypoxia markedly alter the pharmacokinetic characteristics of some drugs.8–12 About 30–40% of the cytochrome P-450 isoforms belongs to the CYP3A subfamily in liver and 70% of that in intestine. More than 60% of the drugs in clinical practice are metabolized by the CYP3A enzyme; therefore, it is very important to evaluate the activity and expression of CYP3A protein.13
Acute mountain sickness (AMS) is a dangerous hypoxic illness that can affect humans who rapidly reach a high altitude above 3500 meters.14,15 The symptoms of AMS mainly include insomnia, dyspnea, headache, fatigue and nausea, among them, insomnia is more serious and lasting.16 A series of physiological and pathological changes are produced under the high altitude hypoxia. These changes related to the physical and metabolic system include the cardiovascular, respiratory, nervous and endocrine system, leading to alteration of drug metabolism and pharmacokinetics, and then affect the in vivo effects and toxicities of drugs.
The objective of this study is to investigate the differences of pharmacokinetics and metabolite profile of ZAL between the normoxic and hypoxic rats, and explore the effects of hypoxia on the CYP3A1/2 activity and protein expression in rats, which provides the important information for developing a novel drug. In addition, the outcomes of our study are expected to serve as a basis for the development of clinical guidelines on ZAL usage under both normoxic and hypoxic conditions.
Experimental
Chemicals and reagents
Zaleplon (ZAL) and the internal standard (IS) dexamethasone were purchased from the National Institute for Control of Pharmaceutical and Biological Products of China (Beijing, China). Testosterone, 6β-OH testosterone, tris-(hydroxymethyl)-aminomethane, β-nicotinnamide adenine dinucleotide 2′-phosphate reduced tetrasodium salt (NADPH) and mouse monoclonal antibody for β-actin were purchased from the Sigma Aldrich (St. Quentin Fallavier, France). Rabbit polyclonal antibody for CYP3A1 (ab22733) was purchased from the Abcam Co Ltd (Hong Kong). Rabbit polyclonal antibody for CYP3A2 (AB1276) was purchased from the Millipore Co Ltd (Temecula, Canada). Methanol (HPLC grade) was obtained from the Thermo Fisher Scientific (Waltham, Australia). Formic acid and ethyl acetate (LC-MS grade) were purchased from the Dikma Reagent Company (Beijing, China). Water used in the experiment was double distilled.Experimental animals
Male Sprague-Dawley rats (250 ± 20 g) were purchased from the Animal Center of Capital Medical University (ACCMU, Beijing, China). Animals were housed in individual cages with free access to food and water in a room with an automatically controlled illumination (a 12 h light–dark cycle), temperature and relative humidity. Animal studies were carried out in accordance with the Guide for the Care and Use of Laboratory Animals as adopted and promulgated by the National Health Ministry of China. Protocols of animal experiments had been approved by Animal Center of Capital Medical University. The experimental rats were exposed to a fractional concentration of inspired O2 (FiO2) of 9.0% after intragastric administration of drugs. The control rats were exposed to the normal air condition as the normoxic groups.Sample preparation
Plasma sample (50 μL) was mixed with dexamethasone (200 ng mL−1, 50 μL) as the IS, followed by liquid–liquid extraction using 300 μL ethyl acetate. About 250 μL of the upper organic layer was then transferred into a new tube and evaporated in a speed vacuum concentrator at 40 °C. The residue was dissolved by methanol, and vortexed for 60 s. An aliquot of 10 μL was injected into the LC-MS/MS system for analysis.After collecting the last blood sampling, the rats were sacrificed and the liver was immediately collected and dounched with ice-cold physiological saline solution. The liver was used for preparation of liver microsomes that were used for the Western blot and enzyme activities assay. The microsomes were prepared by using the method of differential centrifugation.17 All of the samples were frozen in liquid nitrogen and stored at −80 °C until use. The BCA commercial kits were used for determining protein concentrations.
Bile sample was extracted by using ethyl acetate (1![[thin space (1/6-em)]](https://www.rsc.org/images/entities/char_2009.gif) :
:![[thin space (1/6-em)]](https://www.rsc.org/images/entities/char_2009.gif) 3, v/v). The upper organic layer was then transferred into a new tube and evaporated in a speed vacuum concentrator at 40 °C. The residue was dissolved by 300 μL methanol and vortexed for 60 s. An aliquot of 10 μL was injected into the LC-MS/MS system for analysis.
3, v/v). The upper organic layer was then transferred into a new tube and evaporated in a speed vacuum concentrator at 40 °C. The residue was dissolved by 300 μL methanol and vortexed for 60 s. An aliquot of 10 μL was injected into the LC-MS/MS system for analysis.
LC-MS/MS assay
Standard stock solutions of ZAL (200 μg mL−1) and the IS (dexamethasone, 100 μg mL−1) were prepared in methanol and stored at 4 °C. Calibration was prepared by adding ZAL into rat blank plasma (100 μL) and yielding the final concentration series of 0.5, 1.0, 2.0, 10.0, 50.0, 100, 200, 500 and 1000 ng mL−1, respectively.The LC-MS-MS system consisted of a HPLC system (Agilent technology, Palo Alto, CA, USA) including a HP G1312A binary pump, a G1379A vacuum degasser and G1313A autosampler and triple quadrupole mass spectrometer equipped with electrospray ion (ESI) source (Series 6410, Agilent technologies, Palo Alto, CA, USA).
The analytes were separated on a ZORBAX Eclipse Plus C18 column (2.1 mm × 100 mm, 3.5 μm), protected with ZORBAX Eclipse plus C18 guard column (2.1 mm × 12.5 mm, 5 μm). The mobile phase solutions were composed of water containing 0.1% (v/v) formic acid and methanol (40![[thin space (1/6-em)]](https://www.rsc.org/images/entities/char_2009.gif) :
:![[thin space (1/6-em)]](https://www.rsc.org/images/entities/char_2009.gif) 60, v/v). The sample injection volume was 10 μL.
60, v/v). The sample injection volume was 10 μL.
The MS ionization source conditions were as follows: capillary voltage of 4.0 kV, drying gas temperature of 300 °C, drying gas flow: 10 L min−1, nebulizer pressure: 45 psi and corona current 10 nA. The sheath gas flow was 7 L min−1 and sheath gas temperature was 250 °C. The positive ion modes were performed with their selective reaction ion monitoring (SRM) for the quantitative analysis by the ESI mode. The SRM quantitative ions were then selected from the MS/MS data. The optimized precursor-to-product ion transitions were monitored for ZAL [M + H]+ m/z 306 → 236 with a fragmentor 155 V and CE 25 V and the IS [M + H]+ m/z 393 → 355 with fragmentor 110 V and CE 5 V, respectively.
Quantification was based on the IS method of plotting the peak areas ratios of the analyte/IS versus the nominal plasma concentration of the test compound with 1/x2 as weighting factors, which was fitted by least square linear regression. The precision and accuracy were performed to evaluate the method suitability. The extraction recovery for ZAL was assessed by comparing the peak area obtained from extracted sample against the amount of ZAL added in the extracted sample matrix. The matrix effect was evaluated by comparing the peak areas of the post-extracted blank plasma spiked with the working solutions with those of corresponding standard solutions. The stability of the sample was assessed by measuring the analysis data of QC samples under ambient, frozen and three freeze–thaw storage conditions with fresh prepared QC samples.
Pharmacokinetics of ZAL under normoxic and hypoxic conditions
Twelve rats were randomly divided into two groups, including six rats as the control group (normoxic group), and another six rats as the hypoxic group for 3 day (i.e. H3). The hypoxic rats were housed in the hypoxic chamber for 3 d in which the oxygen concentration was maintained at 9.0 ± 0.5% controlled by driving N2 in with an instant monitoring system. Both the groups were orally administered ZAL suspension at a dose of 1.04 mg kg−1. About 0.2 mL blood samples were collected from jugular vein into tubes pre-treated with 10 μL heparin sodium at 0.25, 0.5, 0.75, 1, 1.5, 2, 3, 4, 6, 8 and 12 h, centrifuged (10 min, 3000 rpm) and stored at −20 °C until analysis.Metabolism of ZAL under normoxic and hypoxic conditions
Six bile duct cannulated rats were randomly divided into two groups, including three rats as the control group (normoxic group), another three rats as the hypoxic group for 3 d (H3). The hypoxic rats were also housed in the hypoxic chamber for 3 d (the same apparatus with the pharmacokinetic study). Each group was orally administered ZAL suspension at a dose of 6.24 mg kg−1. The biliary sample was collected at 0–18 hour after the dose, and stored at −20 °C until analysis.Measurement of CYP3A activity
Fourteen rats were randomly divided into two groups, including seven rats as the control group (normoxia), another seven as the hypoxic group for 3 days (H3). The ability of hypoxia to alter the CYP3A was investigated in rat liver microsomes. Testosterone was used as a probe substrate that incubated in the reaction system mentioned above. The formation rates of 6β-hydroxylated testosterone were determined for evaluating the CYP3A activity.18,19The liver microsomes were diluted to 2 mg mL−1, testosterone was diluted to 400 μM and NADPH was diluted to 4 μM. 100 μL of the microsomes and 50 μL of testosterone solution were mixed and incubated for 15 min at 37 °C. The reaction started after 50 μL of NADPH solution was added to the mixture. 0.4 mL ice-cold acetonitrile with 160 ng mL−1 osalmide (the internal standards) was added to terminate the reaction when the reaction last for 30 min. The mixture was centrifuged at 12![[thin space (1/6-em)]](https://www.rsc.org/images/entities/char_2009.gif) 000 g for 5 min, and then 10 μL supernatant was used to determine the concentration of 6β-OH-testosterone using the LC-MS/MS system with positive ion mode. The m/z transition of 6β-hydroxylated testosterone was monitored at [M + H]+ m/z 305 → 269, and osalmide was monitored at [M + H]+ m/z 230 → 121. The production of 6β-OH-testosterone was positive correlation with the activity of the metabolic enzyme CYP3A1/2.
000 g for 5 min, and then 10 μL supernatant was used to determine the concentration of 6β-OH-testosterone using the LC-MS/MS system with positive ion mode. The m/z transition of 6β-hydroxylated testosterone was monitored at [M + H]+ m/z 305 → 269, and osalmide was monitored at [M + H]+ m/z 230 → 121. The production of 6β-OH-testosterone was positive correlation with the activity of the metabolic enzyme CYP3A1/2.
Determination of CYP3A1/2 by the Western blot
Twenty rats were randomly divided into four groups, i.e. five rats as the normoxia control group (normoxia), five rats as the positive drug control group (normoxia-ZAL), five rats as the hypoxic group for 3 d (H3), and five rats as the hypoxic drug group for 3 d (H3-ZAL). The liver microsomes (20 μg per lane) were isolated by 10% sodium dodecyl sulfate polyacrylamide gel electrophoresis (SDS-PAGE), and then transferred to polyvinylidene difluoride membranes, which were blocked at room temperature for 2 h in 5% nonfat milk (dissolved in TBST: tris-buffered saline, with 0.1% Tween 20, pH 7.4). The membranes were then incubated with rabbit polyclonal anti-CYP3A1 (1![[thin space (1/6-em)]](https://www.rsc.org/images/entities/char_2009.gif) :
:![[thin space (1/6-em)]](https://www.rsc.org/images/entities/char_2009.gif) 2000), or rabbit polyclonal anti-CYP3A2 (1
2000), or rabbit polyclonal anti-CYP3A2 (1![[thin space (1/6-em)]](https://www.rsc.org/images/entities/char_2009.gif) :
:![[thin space (1/6-em)]](https://www.rsc.org/images/entities/char_2009.gif) 4000), or mouse monoclonal anti-β-actin (1
4000), or mouse monoclonal anti-β-actin (1![[thin space (1/6-em)]](https://www.rsc.org/images/entities/char_2009.gif) :
:![[thin space (1/6-em)]](https://www.rsc.org/images/entities/char_2009.gif) 10
10![[thin space (1/6-em)]](https://www.rsc.org/images/entities/char_2009.gif) 000) for 1 h at room temperature and overnight at 4 °C. After being washed three times with TBST (each time for 10 min), the membranes were then probed with secondary antibody conjugated HRP (1
000) for 1 h at room temperature and overnight at 4 °C. After being washed three times with TBST (each time for 10 min), the membranes were then probed with secondary antibody conjugated HRP (1![[thin space (1/6-em)]](https://www.rsc.org/images/entities/char_2009.gif) :
:![[thin space (1/6-em)]](https://www.rsc.org/images/entities/char_2009.gif) 5000) for 1 h at room temperature. The blots were washed three times with TBST, every 10 min, followed by development with ECL plus. The density of the bands was quantitated using the Image J Ver. 1.48 u software.
5000) for 1 h at room temperature. The blots were washed three times with TBST, every 10 min, followed by development with ECL plus. The density of the bands was quantitated using the Image J Ver. 1.48 u software.
Data and statistical analysis
The method of non-compartmental model was used to analyze the pharmacokinetic profiles of ZAL under the conditions of normoxia and hypoxia. The pharmacokinetic parameters via non-compartmental model were calculated by the ware DAS Version 2.0 (Chinese Pharmacological Society, Beijing, China). For plasma PK, the area under the plasma concentration–time curve from time zero to the last measurable concentration (AUC(0→t)) was calculated using the trapezoidal rule; the AUC(0→∞) was obtained by extrapolating (AUC(0→t)) to infinity; the elimination half-life (t1/2) was calculated from the terminal log-linear portion of the plasma; and the total body clearance (Cl), apparent volume of distribution (Vd), mean residence time (MRT) and elimination rate constant (k) were calculated by the non-compartmental pharmacokinetic model.Statistical analyses were conducted using the SPSS Version 17.0 (SPSS Inc., Chicago, IL). All data were shown as the mean ± SD, p < 0.05 were considered significant difference.
Results and discussions
Validation of analytical method
Specificities of the identification peaks in LC-MS/MS are evaluated by assessing the blank plasma, and there are no endogenous substance to interfere with the peaks of ZAL and IS. Typical chromatograms of ZAL and IS are found in sampling with the resolution time of the peaks with approximate 2.6 and 4.9 min, respectively (Fig. 1). The calibration curves of ZAL in the biological samples are constructed by plotting the peak area ratio of ZAL/IS versus the concentrations of ZAL. The linear equations for determination of ZAL in plasma are: y = 2.6079x + 0.0122 (r2 = 0.994). The lower limit of quantification (LLOQ) data from the chromatograms of the blank samples, blank samples spiked with the analyte is 0.5 ng mL−1 for ZAL.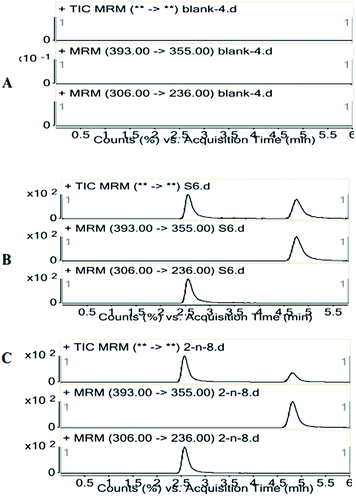 | ||
| Fig. 1 Representative SRM chromatography of a blank rat plasma (A); a spiked plasma sample and 200 ng mL−1 IS (B); a rat plasma sample 2 h after p.o. administration of 1.04 mg kg−1 zaleplon (C). | ||
The intra- and inter-day precision for the analytes in plasma are lower than 11.1%, and the accuracy was between −10.3% and 12.8% (see Table 1). The extraction recoveries are determined for six replicates of QC samples, and the results are summarized in Table 2. The matrix effect from three different sources, all the results are in the range of 90.1–98.5% (Table 2). It is suggested that the method is verified for determination of ZAL in rat plasma. The stability analysis is performed under similar conditions to those described above, and the results are presented in Table 3, indicating that there was no significant degradation of ZAL occurred in rat plasma after storage for 30 days at −80 °C, post treatment storage for 24 hours at room temperature, or three freeze–thaw cycles.
| Spiked | Intra-day (n = 6) | Inter-day (n = 18) | ||||
|---|---|---|---|---|---|---|
| Measured (mean ± SD) (ng mL−1) | Precision (RSD) (%) | Accuracy (%) | Measured (mean ± SD) (ng mL−1) | Precision (RSD) (%) | Accuracy (%) | |
| 1.0 | 0.97 ± 0.093 | 9.6 | −3.0 | 0.97 ± 0.11 | −2.7 | 11.1 |
| 50.0 | 54.6 ± 2.3 | 4.2 | 9.1 | 54.6 ± 2.7 | 9.1 | 5.0 |
| 1000 | 1030 ± 48.4 | 4.7 | 3.0 | 1030 ± 56.0 | 3.0 | 5.4 |
| Spiked (ng mL−1) | Recovery (n = 6) | Matrix effect (n = 3) | ||
|---|---|---|---|---|
| Measured mean ± SD (%) | Precision RSD (%) | Measured mean ± SD (%) | Precision RSD (%) | |
| 1.0 | 65.1 ± 5.5 | 8.5 | 92.5 ± 10.8 | 11.7 |
| 50.0 | 79.4 ± 10.2 | 12.8 | 90.2 ± 6.3 | 7.0 |
| 1000 | 84.3 ± 7.6 | 9.0 | 98.6 ± 3.3 | 3.3 |
| Spiked (ng mL−1) | Measured (mean ± SD) | Precision RSD (%) | Accuracy (%) |
|---|---|---|---|
| Storage for 30 days at −80 °C | |||
| 1.0 | 0.95 ± 0.048 | 5.1 | −5.1 |
| 50.0 | 50.1 ± 1.1 | 2.3 | 0.13 |
| 1000 | 1067 ± 53.0 | 5.0 | 6.7 |
![[thin space (1/6-em)]](https://www.rsc.org/images/entities/char_2009.gif) |
|||
| Post treatment storage for 24 hours at room temperature | |||
| 1.0 | 0.90 ± 0.056 | 6.2 | −10.0 |
| 50.0 | 50.6 ± 2.5 | 4.9 | 1.2 |
| 1000 | 1065 ± 63.2 | 5.9 | 6.5 |
![[thin space (1/6-em)]](https://www.rsc.org/images/entities/char_2009.gif) |
|||
| Three freeze–thaw cycles | |||
| 1.0 | 0.90 ± 0.13 | 13.9 | −9.6 |
| 50.0 | 52.2 ± 2.3 | 4.4 | 4.4 |
| 1000 | 990 ± 26.2 | 2.6 | −1.0 |
Effect of hypoxia on phamacokinetics of ZAL
The plasma concentration–time curves of ZAL are plotted in the normoxia and H3 group (shown in Fig. 2). The values of the area under plasma drug concentration–time curve (AUC) and the plasma peak concentration (Cmax) are significantly higher in hypoxia than that in normal rats (p < 0.01). The pharmacokinetic parameters of ZAL after oral administration of 1.04 mg kg−1 are affected significantly by hypoxia exposure. The values of apparent distribution volume (Vd) are significantly decreased in rats exposed to hypoxia (p < 0.01). And there are no marked differences for some pharmacokinetic parameter such as the time to reach peak concentration (tmax), plasma drug half life (t1/2) and mean retention time (MRT) between nomoxic and hypoxic conditions (see Table 4).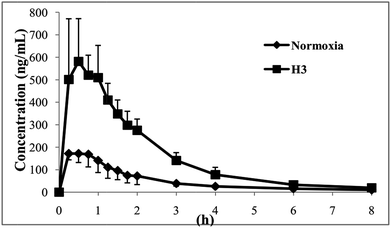 | ||
| Fig. 2 Mean plasma concentration–time curves of zaleplon after an oral administration zaleplon (1.04 mg kg−1) to rats (normoxia: n = 6, H3: n = 6). | ||
| PK parameters | Unit | Normoxia | H3 |
|---|---|---|---|
| a *p < 0.05 and **p < 0.01 showed significantly different between the normoxic and H3 groups. | |||
| AUC(0→t) | h ng mL−1 | 396 ± 118 | 1306 ± 212** |
| AUC(0→∞) | h ng mL−1 | 427 ± 119 | 1344 ± 209** |
| MRT(0→t) | h | 2.1 ± 0.37 | 1.9 ± 0.31 |
| t1/2 | h | 2.3 ± 0.78 | 1.5 ± 0.56 |
| tmax | h | 0.46 ± 0.25 | 0.54 ± 0.19 |
| CLz/F | L h−1 kg−1 | 2.6 ± 0.83 | 0.79 ± 0.11** |
| Vd | L kg−1 | 8.7 ± 4.2 | 1.7 ± 0.68** |
| Cmax | ng mL−1 | 193 ± 36.5 | 606 ± 206** |
Metabolites and metabolic profiles
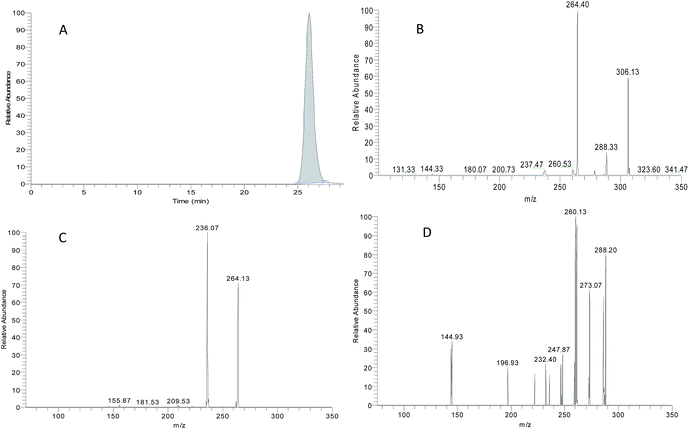
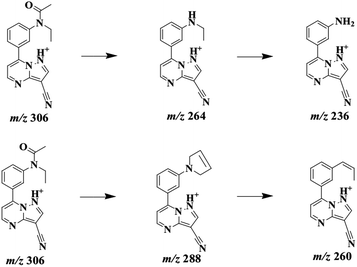
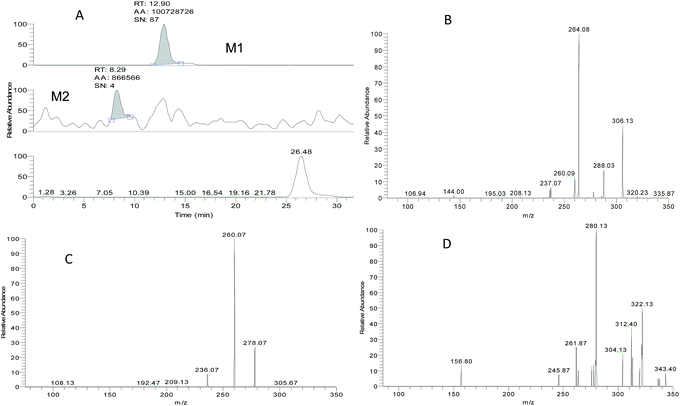
ZAL is observed as its protonated molecule [M + H]+ at m/z 306 with a retention time of 26.12 min. The mass spectra and chromatograms of the product ions for ZAL protonated molecule are shown in Fig. 3. The [M + H]+ ion at m/z 306 formed two prominent product ions at m/z 264 ([M + H − CH3 − CO]+) and m/z 288 ([M + H − H2O]+) when a collision of 36% was used. The ion m/z 264 was further subjected to MS3 analysis and produced an ion at m/z 236 ([M + H − C2H4]+). The ion m/z 288 was further subjected to MS3 analysis and produced an ion at m/z 260 ([M + H − HCN]+). The proposed MS fragmentation pathways of ZAL is illustrated in Fig. 4.ZAL was observed as its protonated molecule [M + H]+ at m/z 306 with a retention time of 26.48 min comparing with the standard compound (see Fig. 5A). The MSn (n = 2–3) spectra gave prominent ions at m/z 264 and 288. The retention time and the MSn spectra were the same as those of ZAL. Therefore, this compound was confirmed as ZAL, the unchanged parent drug (see Fig. 5B). M1 was observed as its protonated molecule [M + H]+ at m/z 278 with a retention time of 12.90 min, which was the major metabolite of ZAL by the decyanoethylation (shown in Fig. 5C). A prominent ion at m/z 260 ([M + H − 18]+) was observed in the MS/MS spectra (Fig. 6), resulting from the loss of H2O. The metabolite M2 was observed as its protonated molecule [M + H]+ at m/z 322 with a retention time of 8.29 min, which was the major metabolite of ZAL by the oxidation (shown in Fig. 5D and 6). A prominent ion at m/z 280 ([M + H − 42]+) was observed in the MS/MS spectra (Fig. 6), resulting from the loss of –CH3O.
 | ||
| Fig. 6 Proposed fragmentation pathways of the metabolites of zaleplon by ESI-MS with positive ion mode. | ||
According to peak area normalization method, the relative content percentages of the parent drug and the metabolites of ZAL were caculated by the data system in Xcalibur work station (shown in Table 5). The results indicated that the percentage of ZAL in the H3 group was markedly higher than that in the normoxic group (p < 0.05), indicating that hypoxia could significantly reduce the metabolic rate of the parent ZAL. Meanwhile, the ratio of the main metabolite N-deethyl-ZAL (M1, m/z 278) catalyzed by the CYP3A in hypoxic rat was lower than that in the normoxic rats (p < 0.05), indicating that hypoxia also could significantly reduced the metabolism of ZAL. There were no differences for the metabolite M2 between the normoxic and hypoxic rats.
| Zaleplon | M1 | M2 | |
|---|---|---|---|
| a *p < 0.05 showed significantly different in percentages of zaleplon and its metabolites between the normoxic and H3 groups. | |||
| Normoxia | 41.6 ± 7.7 | 57.9 ± 7.7 | 0.50 ± 0.25 |
| H3 | 59.6 ± 7.6* | 39.7 ± 7.7* | 0.62 ± 0.15 |
Effect of hypoxia on CYP3A activity
It is essential to measure the CYP3A activity in liver for evaluating and understanding the drug metabolism and toxicity, therefore, the main metabolic enzyme CYP3A activity was detected in microsomal protein from the rat livers in the normoxic and hypoxic rats.18,19 Both normoxic and hypoxic rats, 6β-hydroxylation testosterone were generated at a rate of (1091 ± 51.5) and (870 ± 46.9) pmol mg per protein per min, respectively. The data showed that the CYP3A activity in the hypoxic rat livers was statistically lower than that in normoxic livers for the generation of 6β-hydroxylation testosterone (p < 0.05), suggesting that hypoxia also could significantly decrease the CYP3A activity, resulting a reduction of metabolism of ZAL and augmentation of plasma drug concentration.Effect of hypoxia on the CYP3A1/2 protein expression
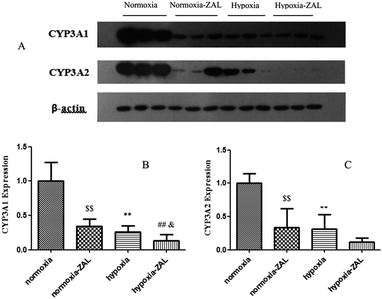
ZAL was mainly catalyzed by the metabolic enzyme CYP3A1/2 in rats.7 The CYP3A1/2 protein levels in rat livers were measured by the Western blot (see Fig. 7). It was found that hypoxia could markedly decrease the expression levels of the CYP3A1/2 protein. And among them, the decrease extent of the CYP3A2 protein was larger than that of the CYP3A1, which were decreased by 74% and 63% of those of control rats, respectively. The data also showed that ZAL was also the inhibitor of the metabolic enzyme CYP3A. The level of the CYP3A protein decreased in liver was concordance with the activity of the liver microsomes. These results could interpret our findings of the drug metabolism and pharmacokinetics of ZAL.In recent years, there are many reports about the influence of acute and chronic hypoxia on the cytochrome P450 enzymes and transmembrane transporters, resulting in alteration of in vivo disposition and pharmacokinetic characteristics for some drugs, which further affect the pharmacological activities, toxicities and clinical effects.9–12 In the altitude area of 3780 meters with acute and chronic hypoxic environment, the main pharmacokinetic parameter of sulfamethoxazole, including t1/2, MRT and AUC, in the healthy volunteers were significantly enhanced, but the clearance markedly decreased.20 However, at the 4360 m altitude plateau with heavy hypoxia, the clearance of acetazolamide in the volunteer was found to increase, and the values of the MRT and Vd were significantly lower than those in the low altitude plain.21 Therefore, hypoxia could actually affect the drug disposition and pharmacokinetic characteristics, but for different drugs the low oxygen could cause different changes of in vivo process and pharmacokinetics. Generally, the alterations of the in vivo metabolic process and pharmacokinetics for most of drugs in humans and animals were mainly associated with the metabolic enzymes and transporters such as P-glycoprotein (P-gp).7 It was found that the expression levels of the CYP1A1, CYP1A2, 2B4, 2C5 and 2C16 proteins in animals were significantly reduced after acute hypoxic exposure, and the activity and protein expression of CYP3A6 and P-gp were significantly increased.22 The studies also showed that the activities of CYP2D6 and CYP3A4 were reduced, the CYP1A2 activity was increased, and the CYP2C19 activity was not changed for those healthy volunteers who had entered the plateau of 4559 m for 24 hours, resulting in alteration of pharmacokinetics.23
ZAL has been widely used in treatment of the chronic or acute transient insomnia in clinical practice for several years.2 The studies have focused on its effects in decreasing sleep latency. ZAL-treated subjects with either chronic or transient insomnia have experienced shorter periods of sleep latency than that of the placebo-treated subjects.2,3 Tolerance to ZAL does not appear to occur, nor do rebound insomnia or withdrawal symptoms after stopping treatment. ZAL is found to be extensively metabolized and rapidly eliminated in humans.24 The pharmacokinetic data indicate that ZAL is absorbed rapidly and reaches peak plasma concentration in about 1 hour. The half-life is approximately 1 hour in humans at normoxic conditions. The metabolites of ZAL mainly included 5-oxo-ZAL and desethyl-ZAL in humans and animal species. In humans and monkeys, the major metabolite of ZAL is the 5-oxo-ZAL, and in rats and mice the major metabolite is the N-desethyl-ZAL (M1). The transformation of ZAL to desethyl-ZAL and 5-oxo-ZAL are suggested to be mediated by the cytochrome P450 enzyme including CYP3A1/2 and CYP3A4.25–28
Our findings demonstrated that hypoxia could markedly increase the absorption and in vivo exposure of ZAL in rats. Compared with the normoxic group, the values of AUC and Cmax were significantly higher in the H3 rats than that in the normoxic rats. The parameter Vd and CL were significantly lower in the H3 group than those in the control group. Generally, the alterations of the in vivo metabolic process and pharmacokinetics for most of drugs in humans and animals were related with the CYP3A and some transporters such as P-gp. But for the drug ZAL, the P-gp is not the major factor for affecting the in vivo drug exposure because ZAL belongs to the first-order kinetic process in vivo transportation.7,29,30 Our studies indicated that the significant changes existed in the absorption, distribution and excretion of ZAL under the low O2 environment were formed from the in vivo acute systemic hypoxia that down-regulated the expression level of the selected CYP3A protein and inhibited the activity of the metabolic enzyme, resulting in alteration of the in vivo disposition and kinetics of ZAL in rats.
Hypoxia usually alters peripheral vasoconstriction; venous return and drug enzymes, eventually leading to blood flow and drug metabolic changes. Our studies indicated that hypoxia could markedly change the pharmacokinetic characteristics of some drugs.9–12 The present results also showed that there were an increase of AUC and Cmax of ZAL in hypoxic rats via inhibiting the activities and expression of the CYP3A1/2 proteins, suggesting that CYP3A1/2 may play a key role for pharmacokinetic change under hypoxia. Thus, even application of the treatment doses, an increased effect and toxic reaction may be appeared in hypoxic or high altitude environment. This paper reports, for the first time, the data on the pharmacokinetic characteristics and metabolic mechanism of ZAL under hypoxia. Our data provides very valuable information to guide the clinical usage in the hypoxic and high altitude medicine, as well as a better understanding of safety and efficacy of the drug.
Conclusion
In this paper, for the first time, the effect of hypoxia on the pharmacokinetics and metabolism of zaleplon as a probe of CYP3A1/2 activity was studied. A LC-MS/MS method has been developed for determination of ZAL in rat plasma. The performance criteria for the precision and accuracy, recovery and matrix effect, sensitivity, linearity and stability have been assessed and were within the FDA recommended guidelines. The results indicated that this method could be successfully used for the pharmacokinetic studies of ZAL between hypoxia and normoxic rats. Our study indicated that the low oxygen environment could cause the inhibition of rat liver CYP3A1/2 enzyme expression and activity, resulting in enhancement of the systematic exposure and reduction of the elimination of ZAL. Thus, even application of the treatment doses, an increased effect and toxic reaction may be appeared in hypoxic or high altitude environment, which is worth noting the safety of the drug in hypoxic clinical medication.Acknowledgements
The authors thank the National Basic Research Program of China (2012CB518200) and the Program of National Foundation of Natural Sciences of China (81173121, 81202537 & 81573683) for their financial supporting.Notes and references
- K. E. Vanover and J. E. Barrent, Psychopharmacology, 1994, 115, 289–296 CrossRef CAS PubMed.
- M. Dooley and G. L. Plosker, Drugs, 2000, 60, 413–445 CrossRef CAS PubMed.
- K. J. Holm and K. L. Goa, Drugs, 2000, 59, 865–889 CrossRef CAS PubMed.
- R. Mandrioli, L. Mercolini and M. A. Raggi, Curr. Drug Metab., 2010, 11, 815–829 CrossRef CAS PubMed.
- N. J. Serkova, N. A. Reisdorph and M. C. Issot van Patot, Toxicol. Mech. Methods, 2008, 18, 81–95 CrossRef CAS PubMed.
- C. Fradette and P. Du Souich, Curr. Drug Metab., 2004, 5, 257–271 CrossRef CAS PubMed.
- P. du Souich and C. Fradette, Expert Opin. Drug Metab. Toxicol., 2011, 7, 1083–1100 CrossRef CAS PubMed.
- A. G. Vij, K. Kishore and J. Dey, Indian J. Med. Res., 2012, 135, 211–216 CAS.
- W. Z. Xu, Y. Zhao, Y. Qin, B. K. Ge, W. W. Gong, Y. T. Wu, X. R. Li, Y. M. Zhao, P. X. Xu and M. Xue, Molecules, 2016, 21, 874–887 CrossRef PubMed.
- W. W. Gong, S. H. Liu, P. X. Xu, M. Fan and M. Xue, Molecules, 2015, 20, 6901–6912 CrossRef CAS PubMed.
- T. Shao, Y. Qin, P. X. Xu, W. Z. Xu, L. Zhao, Y. Ma, W. J. Hao and M. Xue, Chin. Pharmacol. Bull., 2016, 32, 1601–1607 Search PubMed.
- W. Z. Xu, Y. Zhao, Y. Qin, B. B. Xia, W. W. Gong, P. X. Xu and M. Xue, Journal of International Pharmaceutical Research, 2016, 43, 336–340 Search PubMed.
- F. P. Guengerich, Mol. Interv., 2003, 3, 194–204 CrossRef CAS PubMed.
- P. H. Hackett and R. C. Roach, N. Engl. J. Med., 2001, 345, 107–114 CrossRef CAS PubMed.
- B. A. Beidleman, C. S. Fulco, S. R. Muza, P. B. Rock, J. E. Staab, V. A. Forte, M. D. Brothers and A. Cymerman, High Alt. Med. Biol., 2009, 10, 253–260 CrossRef PubMed.
- Y. Johmura, T. Takahashi and Y. Kuroiwa, J. Neurol. Sci., 2007, 263, 174–176 CrossRef PubMed.
- G. G. Gibson and P. Skett, Introduction to Drug Metabolism, Blankie Academic & Professional, London, 2nd edn, 1994, pp. 217–9 Search PubMed.
- K. Kobayashi, K. Urashima, N. Shimada and K. Chiba, Biochem. Pharmacol., 2002, 63, 889–896 CrossRef CAS PubMed.
- R. L. Walsky and R. S. Obach, Drug Metab. Dispos., 2004, 32, 647–660 CrossRef CAS PubMed.
- X. Y. Li, F. Gao, Z. Q. Li, W. L. Feng and R. L. Ge, Clin. Ther., 2009, 31, 2744–2754 CrossRef CAS PubMed.
- W. A. Ritschel, C. Paulos, A. Arancibia, M. A. Agrawal, K. Wetzelsberger and P. W. Lucker, J. Clin. Pharmacol., 1998, 38, 533–539 CrossRef CAS PubMed.
- C. Fradette, J. Batonga, S. Teng, M. M. Piquette and P. du Souich, Drug Metab. Dispos., 2007, 35, 765–771 CrossRef CAS PubMed.
- G. Jürgens, H. R. Christensen, K. Brøsen, J. Sonne, S. Loft and N. V. Olsen, Clin. Pharmacol. Ther., 2002, 71, 214–220 CrossRef PubMed.
- B. Beer, J. R. Ieni, W. H. Wu and D. Clody, J. Clin. Pharmacol., 1994, 34, 335–344 CrossRef CAS PubMed.
- W. H. Wu, A. Dicioccio, P. W. Demaio, P. Amorusi, A. P. Tonelli and P. R. Mayer, Pharm. Res., 1996, 13, S487 Search PubMed.
- A. S. Rosen, P. Fournie, M. Darwish, P. Danjou and S. M. Troy, Biopharm. Drug Dispos., 1999, 20, 171–175 CrossRef CAS PubMed.
- A. B. Renwick, H. Mistry, S. E. Ball, D. G. Walters, J. Kao and B. G. Lake, Xenobiotica, 1998, 28, 337–348 CrossRef CAS PubMed.
- T. Chiaki, S. Kazumi, U. Naoto, W. Yoko, T. Yoshitaka, O. Shigeru and K. Shigeyuki, Drug Metab. Pharmacokinet., 2013, 28, 269–273 CrossRef.
- H. Yao, P. Y. Shi, X. M. Huang, Z. H. Shen, Y. Su, C. L. Yang, M. L. Zhu, L. Y. Huang, A. L. Liu and X. H. Lin, RSC Adv., 2017, 7, 13570–13583 RSC.
- W. B. Li, J. Li, R. Wang, H. Xie and Z. P. Jia, Drug Metab. Rev., 2015, 47, 191–198 CrossRef CAS PubMed.
| This journal is © The Royal Society of Chemistry 2017 |

