 Open Access Article
Two-dimensional SnS nanoflakes: synthesis and application to acetone and alcohol sensors
M. F. Afsarab,
M. A. Rafiq *b and
A. I. Y. Tokc
aDepartment of Physics and Applied Mathematics, Pakistan Institute of Engineering and Applied Sciences, Nilore, Islamabad 45650, Pakistan
bMicro and Nano Devices Group, Department of Metallurgy and Materials Engineering, Pakistan Institute of Engineering and Applied Sciences, Nilore, Islamabad 45650, Pakistan. E-mail: aftab@cantab.net; Fax: +92 51 924 8600; Tel: +92 51 1111 Tel: +92 51 1111 74327 ext. 3247
cSchool of Materials Science and Engineering, Nanyang Technological University, Singapore 639798, Singapore
First published on 18th April 2017
Abstract
SnS nanoflakes were synthesized using a solid state reaction method at 600 °C and their gas sensing properties were investigated. X-ray diffraction (XRD), energy dispersive X-ray spectroscopy (EDS) and Transmission Electron Microscopy (TEM) analysis revealed the formation of a pure, polycrystalline, orthorhombic phase of SnS nanoflakes. The response of the SnS nanoflakes sensor to reducing gases such as acetone and alcohols (ethanol, methanol and 1-butanol) was measured from 25 °C to 200 °C. The response of the SnS nanoflakes sensor was highest for acetone (∼1000% at 100 °C). It was determined that the optimal operating temperature of the SnS nanoflakes sensor was 100 °C for acetone and 1-butanol. Fast response and recovery times of these sensors were observed for all gases. With an increase in temperature from 25 °C to 200 °C, response and recovery times of the SnS nanoflakes sensor were improved for all gases. Finally, the SnS nanoflakes sensor characteristics have been compared to the characteristics of other metal oxide/sulphide nanostructure sensors reported in previous studies. Moreover, the SnS nanoflakes sensor showed good stability and reproducibility at 100 °C for acetone. As acetone in human breath is a marker for diagnosis of diabetes, this work demonstrates a possible use of SnS nanoflakes in diabetes diagnosis.
Introduction
Tin sulphide (SnS) is an important IV–VI semiconductor with an indirect band gap value of 1.087 eV. In recent years, SnS has gained great interest from the research community due to its potential technological applications.1–5 SnS has been used in photovoltaic cells, sensors, holographic recording media, solid-state batteries, photodetectors, near infrared detectors, capacitors and photocatalytic materials due to its unique chemical and physical properties.6–8 Due to its non-toxicity SnS is preferable over other metal chalcogenides such as PbS, CdS, PbSe and CdSe.4 Also, SnS is a potential candidate material for different applications.9 Other metal chalcogenides such as MoS2,10 CdS,11 PbS12 and copper sulphide13 have also been used to fabricate gas sensors. Similarly, tin sulphide–tin dioxide composites were used to study oxygen sensing.14 Also, SnS2 was used for acetone gas sensing.15,16 However, detailed sensing of alcohols or acetone using SnS has not been reported yet. Therefore, in this paper we report the synthesis, characterization and temperature dependent acetone and alcohol sensing properties of SnS nanoflakes. As the presence of acetone in human breath is an indication of diabetes, SnS nanoflakes could be used for diagnosis of diabetes. The reason to choose SnS nanoflake morphology for alcohol and acetone sensing is that it has been demonstrated previously that sensor based on 2D nanomaterials such as nanoflakes display excellent sensing of volatile compounds.10 In this study the SnS nanoflakes were synthesized by solid state reaction method. It is an easy and simple technique without the requirement of solvent or surfactant. This method is top-down approach to build the micro/nanostructures at higher temperatures because it facilitates the diffusion of ions or atoms through chemical reaction.17–19 Due to these reasons it was preferred over other techniques such as hydrothermal, solvothermal, polyol and laser ablation techniques for preparation of SnS nanostructures.20,21 In literature preparation of SnS nanoflakes by solid state reaction has not been reported.Experimental details
Solid state reaction technique was used to prepare SnS nanoflakes using thiourea [SC(NH2)2] and tin(IV) acetate [C8H12O8Sn]. These chemicals were of analytical grade. Stoichiometric amounts of thiourea and tin(IV) acetate in the ratio of 1![[thin space (1/6-em)]](https://www.rsc.org/images/entities/char_2009.gif) :
:![[thin space (1/6-em)]](https://www.rsc.org/images/entities/char_2009.gif) 1 were grinded in an agate mortar separately and then mixed in a crucible. The mixed powder was then heated in a tube furnace at 600 °C for 5 h in presence of argon flow. During heat treatment the heating and cooling rate was 3 °C per minute. Heat treatment yielded pure crystalline SnS powder with silver color because at above 500 °C SnS is more likely to be formed.22,23 The prepared SnS powder was then grinded for 10 minutes to obtain fine powder. Here we used thiourea as source of sulfur as it has slow decomposition rate as compared to highly reactive sulphides (such as sodium sulphide). This helps formation of nanostructures.17
1 were grinded in an agate mortar separately and then mixed in a crucible. The mixed powder was then heated in a tube furnace at 600 °C for 5 h in presence of argon flow. During heat treatment the heating and cooling rate was 3 °C per minute. Heat treatment yielded pure crystalline SnS powder with silver color because at above 500 °C SnS is more likely to be formed.22,23 The prepared SnS powder was then grinded for 10 minutes to obtain fine powder. Here we used thiourea as source of sulfur as it has slow decomposition rate as compared to highly reactive sulphides (such as sodium sulphide). This helps formation of nanostructures.17
The resulting powder was characterized using XRD “Bruker D8 Advance Powder” with Cu Kα radiation (λ = 1.5418 Å). Energy-dispersive X-ray spectroscopy (EDS) analysis was performed using “JEOL JSM-6340F” field emission scanning electron microscope with an accelerating voltage of 20 kV, to determine the chemical composition of SnS nanoflakes. Transmission electron microscope (TEM) images and diffraction patterns were obtained using TEM JEOL 2100F operating at 200 kV.
The prepared SnS powder was pressed into pellet in a uniaxial hydraulic press using a dye of 10 mm diameter and applying a pressure of five ton per mm2. The thickness of the prepared pellet was 1 mm. For proper physical strength and removal of pores pellet was sintered at 200 °C for 2 h. Pellet was removed from furnace and allowed to cool down naturally before using it as sensor. Electrical contacts were made with the help of conducting silver paste on same side of pellet. The distance between the contacts was 2 mm. After forming the contacts, the pellet was cured at 100 °C for 2 h for better adhesion of silver paste with SnS nanoflakes.
The gas sensing characteristics of the SnS nanoflakes sensor were measured using a probe station with closed chamber. The temperature of base of probe station (Materials Development Corporation USA, Cryogenic Probe Station Model 441), on which sample was placed, could be varied as desired with error ±1 °C. The current–voltage (I–V) characteristics, response and recovery time curves were measured using Agilent 4156C parameter analyzer.
Results and discussion
XRD spectrum of SnS nanoflakes (Fig. 1(a)) shows formation of pure orthorhombic SnS nanoflakes with space group Pbnm (62). All diffraction peaks in Fig. 1(a) match with those in the PDF card number 00-033-1375. The lattice constant parameters calculated from the XRD spectrum are a = 4.298 Å, b = 11.201 Å and c = 3.977 Å. The volume of cell is 193.489 Å3. The calculated lattice constant parameters and cell volume agree well with the values given in the PDF card number 00-033-1375 (a = 4.334 Å, b = 11.200 Å, c = 3.987 Å and cell volume = 193.529 Å3). The degree of preferred orientation of different crystalline planes can be obtained from the XRD pattern by calculating texture coefficient (TChkl) given by:24
 | (1) |
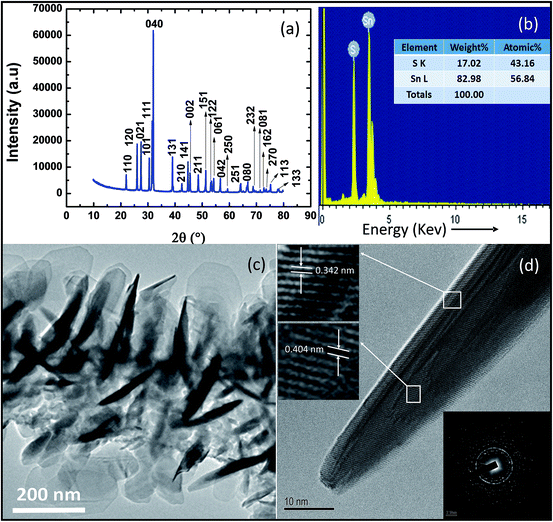 | ||
| Fig. 1 Synthesized SnS nanoflakes (a) XRD spectrum (b) EDS analysis (c) TEM low resolution image (d) HRTEM image with SEAD diffraction image. | ||
| SnS | |||||
|---|---|---|---|---|---|
| h | k | l | Ixrd | Icard | Texture coefficient |
| 1 | 1 | 0 | 5513 | 32 | 0.522764185 |
| 1 | 2 | 0 | 17![[thin space (1/6-em)]](https://www.rsc.org/images/entities/char_2009.gif) 366 366 |
67 | 0.786489277 |
| 0 | 2 | 1 | 18![[thin space (1/6-em)]](https://www.rsc.org/images/entities/char_2009.gif) 681 681 |
70 | 0.809785307 |
| 1 | 0 | 1 | 12![[thin space (1/6-em)]](https://www.rsc.org/images/entities/char_2009.gif) 107.7 107.7 |
53 | 0.693192083 |
| 1 | 1 | 1 | 26![[thin space (1/6-em)]](https://www.rsc.org/images/entities/char_2009.gif) 314 314 |
100 | 0.798462791 |
| 0 | 4 | 0 | 60![[thin space (1/6-em)]](https://www.rsc.org/images/entities/b_char_2009.gif) 538 538 |
69 | 2.662237461 |
| 1 | 3 | 1 | 12![[thin space (1/6-em)]](https://www.rsc.org/images/entities/char_2009.gif) 383 383 |
40 | 0.939363527 |
| 2 | 1 | 0 | 3159 | 19 | 0.504503097 |
| 1 | 4 | 1 | 11![[thin space (1/6-em)]](https://www.rsc.org/images/entities/char_2009.gif) 323 323 |
30 | 1.145270474 |
| 0 | 0 | 2 | 7379 | 26 | 0.861176112 |
| 2 | 1 | 1 | 6573 | 27 | 0.738699287 |
| 1 | 5 | 1 | 8163 | 18 | 1.376084501 |
| 1 | 2 | 2 | 3689 | 14 | 0.799555162 |
| 0 | 6 | 1 | 5004 | 13 | 1.16799709 |
| 0 | 4 | 2 | 463 | 18 | 0.078050609 |
| 2 | 5 | 0 | 1569 | 4 | 1.190229648 |
| 2 | 5 | 1 | 3159 | 15 | 0.639037257 |
| 0 | 8 | 0 | 3689 | 7 | 1.599110324 |
| 2 | 3 | 2 | 2374 | 8 | 0.900447796 |
| 0 | 8 | 1 | 1039 | 2 | 1.576352587 |
| 1 | 6 | 2 | 1590 | 5 | 0.964928051 |
| 2 | 7 | 0 | 805 | 3 | 0.814221259 |
| 1 | 1 | 3 | 2629 | 6 | 1.329557572 |
| 1 | 3 | 3 | 1090 | 3 | 1.102485929 |
Fig. 1(b) shows the result of the chemical analysis performed by EDS. Presence of Sn and S peaks only in this spectrum also confirm purity of prepared SnS nanoflakes. Fig. 1(c) shows the low resolution TEM image of SnS nanoflakes. It can be seen that many nanoflakes are present on the copper grid and are randomly placed. Fig. 1(d) shows the HRTEM image of single SnS nanoflake clearly showing that it is polycrystalline. Top and middle inset to Fig. 1(d) shows well resolved lattice planes with (interplanar spacings) d-spacing 0.342 nm and 0.404 nm. These d-spacings correspond to lattice planes (110) and (120) of SnS nanoflakes respectively. The bottom inset to the Fig. 1(d) (diffraction pattern of SnS nanoflakes obtained in TEM) is another evidence for the polycrystalline nature of the SnS nanoflakes.
Resistive type SnS nanoflakes sensors were tested for Acetone and alcohols sensing. The SnS nanoflakes response was measured from 25 °C to 200 °C. The concentration of gas was fixed to 10 ppm in all of these experiments.
Fig. 2(a–e) show I–V characteristics of SnS nanoflakes sensor in air, acetone and alcohols at different temperatures in order to calculate the response for these gases. The I–V characteristics are nonlinear. It is noted that at all temperatures when an acetone or an alcohol is injected into test chamber the value of the current decreases indicating an increase in resistance of the SnS nanoflakes sensor. However, the minimum decrease in current is for ethanol and maximum decrease in current is for 1-butanol at temperatures 25 °C and 50 °C (Fig. 2(a and b)). From 100 °C to 200 °C (Fig. 2(c–e)) the minimum decrease in current is for ethanol and maximum decrease in current is for acetone.
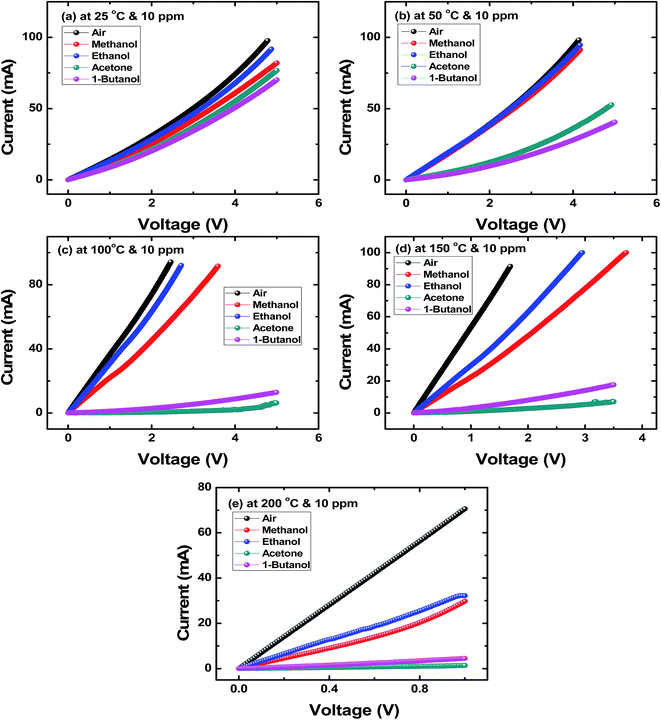 | ||
| Fig. 2 I–V characteristics SnS nanoflakes in air, methanol, ethanol, acetone and 1-butanol at (a) 25 °C (b) 50 °C (c) 100 °C (d) 150 °C (e) 200 °C. | ||
In order to study reversibility characteristics of SnS nanoflakes sensors, sensors were exposed to 10 ppm of acetone or alcohol and air alternately for two or more cycles.12 From these measurements, the response and recovery times of SnS nanoflakes were calculated. Fig. 3(a–e) show the response time (t(air-to-acetone)) and recovery time (t(acetone-to-air)) of SnS nanoflakes sensor for 10 ppm concentration of acetone at different temperatures. Fig. 3(c–e) clearly show the good reversibility of SnS nanoflakes sensor for two complete cycles.
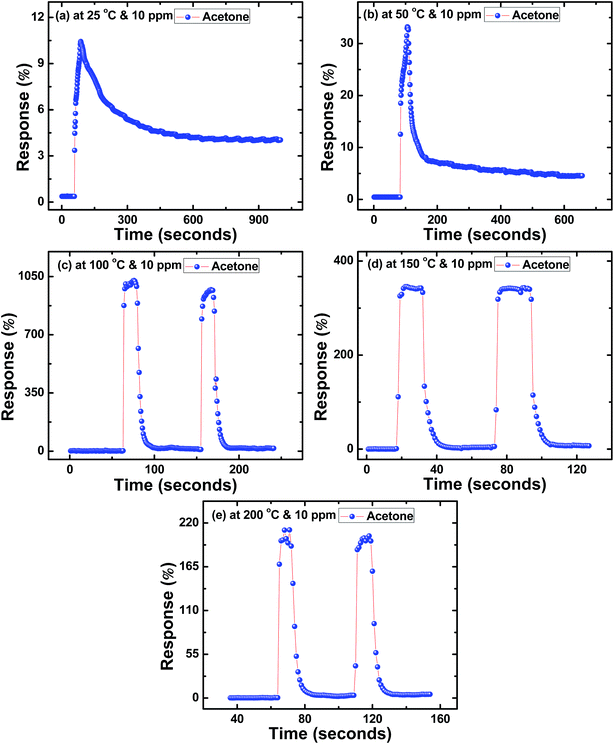 | ||
| Fig. 3 Response curves of SnS nanoflakes in acetone at (a) 25 °C (b) 50 °C (c) 100 °C (d) 150 °C (e) 200 °C. | ||
Similarly, Fig. 4(a–e) to 6(a–e) show the response time (t(air-to-acetone)) and recovery time (t(acetone-to-air)) of SnS nanoflakes sensors for 10 ppm concentration of each alcohol from 25 °C to 200 °C. Fig. 4(c and d) and 5(c and d) show the good reversibility of SnS nanoflakes sensor for two complete cycles while Fig. 4(e) and 5(e) show reversibility for four complete cycles. Also Fig. 6(d and e) show good reversibility for two complete cycles.
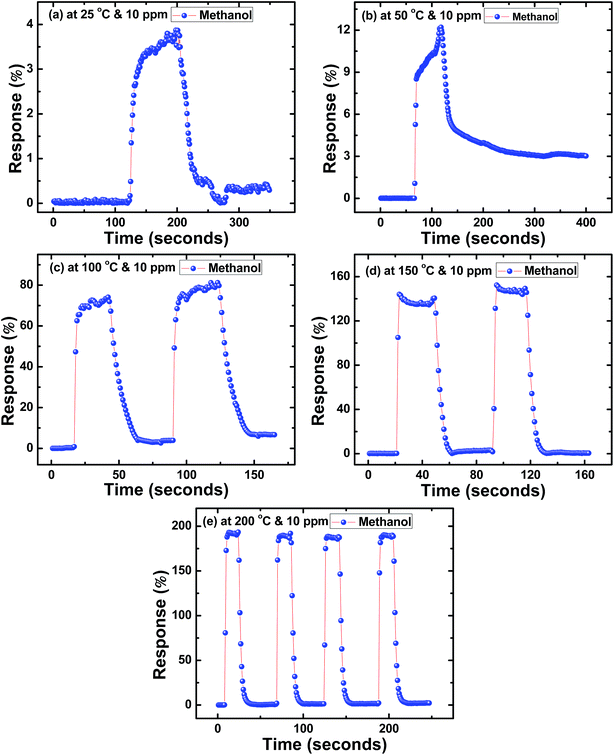 | ||
| Fig. 4 Response curves of SnS nanoflakes in methanol at (a) 25 °C (b) 50 °C (c) 100 °C (d) 150 °C (e) 200 °C. | ||
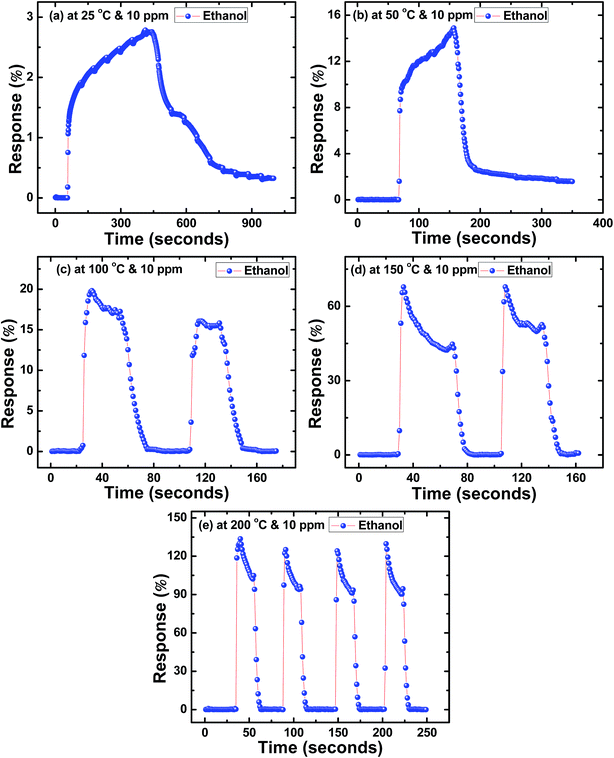 | ||
| Fig. 5 Response curves of SnS nanoflakes in ethanol at (a) 25 °C (b) 50 °C (c) 100 °C (d) 150 °C (e) 200 °C. | ||
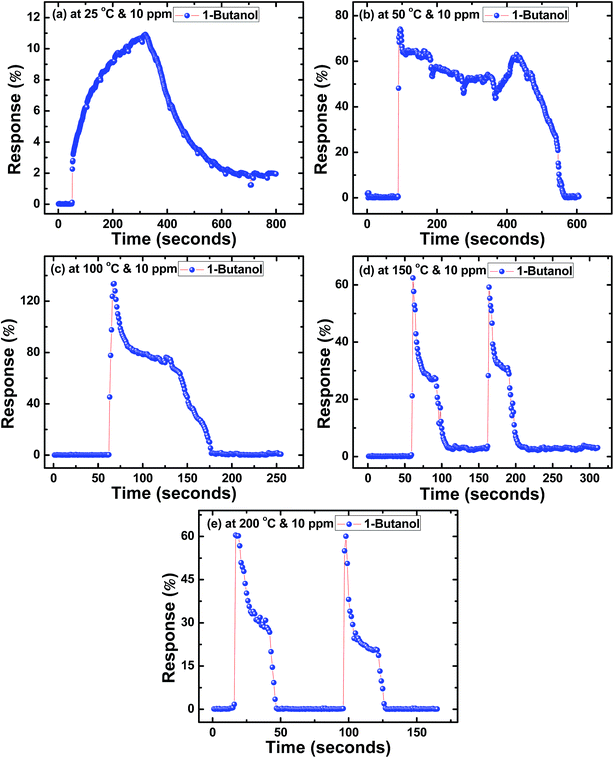 | ||
| Fig. 6 Response curves of SnS nanoflakes in 1-butanol at (a) 25 °C (b) 50 °C (c) 100 °C (d) 150 °C (e) 200 °C. | ||
Generally, in all cases, there is improvement in response and recovery time of the sensor as temperature is increased from 25 °C to 200 °C. This improvement is larger at 100 °C and above. It can be noted that improvement in recovery times is more as compared to improvement in response time. The response and recovery times calculated from these graphs are shown in the Fig. 7(a and b).
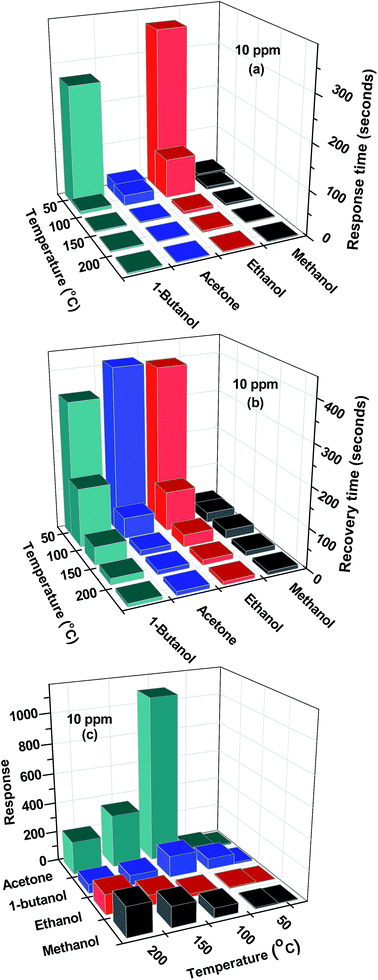 | ||
| Fig. 7 Variation of SnS nanoflakes in (a) response time (b) recovery time (c) response with acetone, methanol, ethanol and 1-butanol as a function of temperature. | ||
The gas sensor response (S) is defined as:
 | (2) |
 | (3) |
The temperature dependence of the sensor response is generally controlled by two parameters: the reaction rate between the adsorbed oxygen ions with acetone and alcohol molecules and the electron density of the sensor. The reaction rate coefficient and hole density increases exponentially with increasing temperature. On the other hand, the sensor response is proportional to the reaction rate coefficient and inversely proportional to the electron density. These two parameters compete each other and result in a maximum sensor response at the optimal operating temperature.26 From Fig. 7(c) it is suggested that optimal operating temperature (for the temperature range 25 °C to 200 °C) for acetone and 1-butanol is 100 °C.
To explain gas sensing results a proposed gas-sensing mechanism is shown in the schematic diagram (Fig. 8). SnS is a p-type semiconductor.27 When SnS nanoflakes are exposed to air, they adsorb oxygen from air. Wolkenstein's model28 states that adsorbed neutral oxygen molecules (O)ads on surface of the semiconductor are partially ionized into O−, O2− or O2− ions by attracting electron from valence band of the semiconductor at various temperatures as shown below:29
| (O2)gas ↔ (O2)ads | (4) |
| (O2)ads + e− ↔ (O2−)ads, (25–150 °C) | (5) |
| (O2−)ads + e− ↔ 2(O−)ads, (150–200 °C) | (6) |
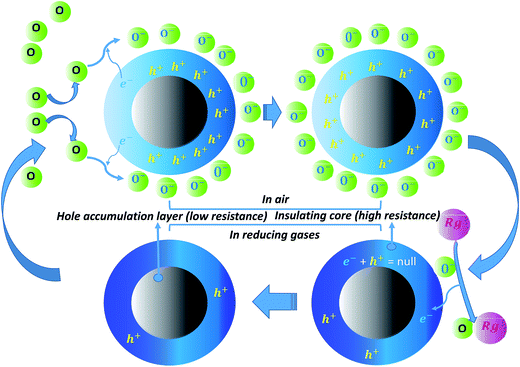 | ||
| Fig. 8 Schematic diagram of gas sensing mechanism for p-type SnS nanoflakes sensor (Rg shows reducing gas). | ||
Reduction of these electrons from valence band will change charge status of surface of the sensor producing a positive accumulation zone by holes and a surface negative charge layer which covers the whole surface of the sensor [Fig. 8]. Therefore over all resistance of the sensor decreases and constant value of the resistance is achieved after saturation.30 Now, when the sensor is exposed to reducing gases such as alcohols and acetone their possible reactions with the adsorbed oxygen can be explained as follows:
For alcohols, dehydrogenation of alcohols by the adsorbed oxygen ions may be responsible for the increase in resistance of the sensor. In case of methanol, as its molecule approaches the sensor with adsorbed oxygen, it can lose one H from CH3 group and that of OH group, due to the attraction with adsorbed oxygen, resulting in the formation of water molecule. Water molecule desorbs releasing one electron into the material. Thus the dehydrogenated methanol turns into formic acid (25–150 °C) and formaldehyde (150–200 °C), the reaction schematics being the following:
| CH3OH + O2− → HCOOH + H2O + e−, (25–150 °C) | (7) |
CH3OH + O− → CH2O + H2O + e−, (150–200 ![[thin space (1/6-em)]](https://www.rsc.org/images/entities/char_2009.gif) C) C)
| (8) |
A similar process can occur in case of ethanol, which would turn into ethanoic acid (25–150 °C) and acetaldehyde (150–200 °C), and in case of 1-butanol, which would turn into butyric acid (25–150 °C) and butyraldehyde (150–200 °C), as in the following reaction schematics:
| CH3CH2OH + O2− → CH3COOH + H2O + e−, (25–150 °C) | (9) |
| CH3CH2OH + O− → CH3COH + H2O + e−, (150–200 °C) | (10) |
| CH3CH2CH2CH2OH + O2− → CH3CH2CH2COOH + H2O + e−, (25–150 °C) | (11) |
| CH3CH2CH2CH2OH + O− → CH3CH2CH2COH + H2O + e−, (150–200 °C) | (12) |
Hence, the adsorption of alcohols on the surface of SnS nanoflakes will cause electron–hole pair annihilation, i.e., it will decrease the hole concentration that decreases the net surface negative charge and increases the overall resistance of SnS nanoflakes sensor.13,30,31
For acetone, possible reactions of acetone with adsorbed oxygen is shown as below:
From 25 °C to 150 °C
| 2CH3COCH3 (gas) + O2− → 2CH3CO+ + 2CH3O− + e− | (13) |
| CH3CO+ → CH3+ + CO | (14) |
| 2CO + O2− → 2CO2 + e− | (15) |
From (150–200 °C)
| CH3COCH3 (gas) + O− → CH3CO+ + CH3O− + e− | (16) |
| CH3CO+ → CH3+ + CO | (17) |
| CO + O− → CO2 + e− | (18) |
Similarly, the adsorption of acetone on the surface of SnS nanoflakes will cause electron–hole pair annihilation, i.e., it will decrease the hole concentration which decreases the net surface negative charge and increases the overall resistance of SnS nanoflakes sensor. As per suggested reaction of acetone with adsorbed oxygen more electrons are being produced as compared to alcohols. That may be one of the reason that the response of acetone is relatively high as compared to alcohols at all temperatures at fixed concentration.
The selectivity might be related to the different optimal operating temperatures of the sensor for different gases. The response of a sensor would depend strongly on the type of gas at different temperatures because different gases have different activation energies for adsorption, desorption and reaction on the semiconductor.32
For acetone, we compare our results with those given in Table 1 of ref. 33, Table II of ref. 34, Table 1 of ref. 35 and Table 1 of ref. 36. SnS nanoflakes sensor has high response (∼1000%) and fast response time (3 s) and recovery time (14 s) at relatively lower optimum temperature 100 °C.
For methanol, we compare our results with those given in Table 1 of ref. 37, Table IV of ref. 29, Table 1 of ref. 38 and Table 1 of ref. 39. SnS nanoflakes sensor has high response (∼190%) and fast response time (2 s) and recovery time (9 s) at temperature 200 °C.
For ethanol, we compare our results with those given in Tables 1 & 2 of ref. 40, Table 2 of ref. 41, and Table 2 of ref. 42. SnS nanoflakes sensor has high response (∼130%) and fast response time (2 s) and recovery time (9 s) at temperature 200 °C.
For 1-butanol, we compare our results with those given in Table 1 of ref. 43, and Table 2 of ref. 44. SnS nanoflakes sensor has high response (∼140%) and fast response time (3 s) and recovery time (45 s) at low optimum temperature 100 °C.
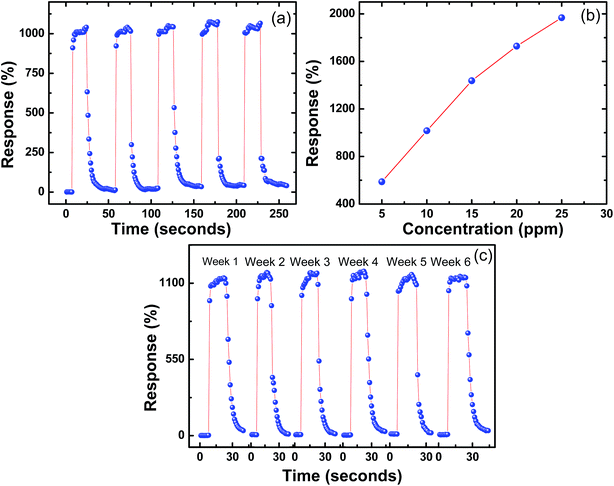
As SnS nanoflakes exhibited high values of response (∼1000%) for acetone as compared to methanol, ethanol, and 1-butanol. Therefore other characteristics of the sensor such as reproducibility, effect of concentration of acetone and long-term stability were studied for acetone only at the optimum operating temperature 100 °C. Fig. 9(a) shows five complete response and recovery cycles of SnS nanoflakes sensor at 100 °C for 10 ppm acetone. Figure clearly indicates good reproducibility of the sensor with slight variation in response (<3%). Fig. 9(b) shows the response of SnS nanoflakes sensor at 100 °C for different acetone concentrations. A linear increase in response is observed as acetone concentration changes from 5 ppm to 25 ppm. To test the long-term stability of the SnS nanoflakes sensor, it was kept in air for 6 weeks at room temperature and the response of the sensor was tested every week at 100 °C with 10 ppm acetone concentration. Fig. 9(c) shows the results obtained during these measurements. Almost negligible change (<4%) in the response of SnS nanoflakes sensor was observed over 6 weeks, conforming good stability of the sensor.
Conclusions
In this work, the SnS nanoflakes were prepared using a simple conventional solid state reaction method. These nanoflakes were characterized by XRD, TEM, and EDS. The gas sensing properties of SnS nanoflakes were investigated at different temperatures. The SnS nanoflakes exhibited excellent gas sensing properties especially for acetone with maximum response ∼1000% at 100 °C with fast response and recovery time. At optimum operating temperature (100 °C), the SnS nanoflakes sensor showed good stability and reproducibility for acetone. The response and recovery characteristics of the SnS nanoflakes were quick and reproducible. Therefore, this study demonstrates the possibility of utilization of SnS nanoflakes for the detection of alcohols and acetone and possibly for detection of diabetes.Acknowledgements
M. F. Afsar would like to acknowledge the Higher Education Commission of Pakistan for the financial support through International Research Initiative Program (IRSIP). Authors are thankful to Dr Tay Yee Yan of Nanyang Technological University Singapore for his help in TEM analysis. M. A. Rafiq would like to acknowledge Higher Education Commission for financial support under National Research Program for Universities (NRPU Project No. 3662).References
- A. Ghazali, Z. Zainal, M. Z. Hussein and A. Kassim, Cathodic electrodeposition of SnS in the presence of EDTA in aqueous media, Sol. Energy Mater. Sol. Cells, 1998, 55, 237–249 CrossRef CAS.
- A. Muthuvinayagama and B. Viswanathanb, Hydrothermal synthesis and LPG sensing ability of SnS nanomaterial, Indian J. Chem., 2015, 54, 155–160 Search PubMed.
- J. Vidal, S. Lany, M. d'Avezac, A. Zunger, A. Zakutayev, J. Francis and J. Tate, Band-structure, optical properties, and defect physics of the photovoltaic semiconductor SnS, Appl. Phys. Lett., 2012, 100, 032104 CrossRef.
- I. Kherchachi, A. Attaf, H. Saidi, A. Bouhdjer, H. Bendjedidi, Y. Benkhetta and R. Azizi, Structural, optical and electrical properties of SnxSy thin films grown by spray ultrasonic, J. Semicond., 2016, 37, 032001 CrossRef.
- S. H. Chaki, M. D. Chaudhary and M. Deshpande, SnS thin films deposited by chemical bath deposition, dip coating and SILAR techniques, J. Semicond., 2016, 37, 053001 CrossRef.
- N. Koteeswara Reddy, M. Devika, Q. Ahsanulhaq and K. Gunasekhar, Growth of orthorhombic SnS nanobox structures on seeded substrates, Cryst. Growth Des., 2010, 10, 4769–4772 CAS.
- P. Tang, H. Chen, F. Cao, G. Pan, K. Wang, M. Xu and Y. Tong, Nanoparticulate SnS as an efficient photocatalyst under visible-light irradiation, Mater. Lett., 2011, 65, 450–452 CrossRef CAS.
- G. S. Paul, P. Gogoi and P. Agarwal, Structural and stability studies of CdS and SnS nanostructures synthesized by various routes, J. Non-Cryst. Solids, 2008, 354, 2195–2199 CrossRef CAS.
- H. Tsukigase, Y. Suzuki, M.-H. Berger, T. Sagawa and S. Yoshikawa, Synthesis of SnS nanoparticles by SILAR method for quantum dot-sensitized solar cells, J. Nanosci. Nanotechnol., 2011, 11, 1914–1922 CrossRef CAS PubMed.
- S.-P. Wang, C.-H. Wu and C.-C. Hong, MoS2 nanosensors fabricated by dielectrophoretic assembly for ultrasensitive and rapid sensing of volatile organic compounds, SENSORS, 2015 IEEE, 2015, pp. 1–4 Search PubMed.
- A. Giberti, D. Casotti, G. Cruciani, B. Fabbri, A. Gaiardo, V. Guidi, C. Malagù, G. Zonta and S. Gherardi, Electrical conductivity of CdS films for gas sensing: Selectivity properties to alcoholic chains, Sens. Actuators, B, 2015, 207, 504–510 CrossRef CAS.
- S. Bandyopadhyay, B. Chatterjee, P. Nag and A. Bandyopadhyay, Nanocrystalline PbS as Ammonia Gas Sensor: Synthesis and Characterization, CLEAN – Soil, Air, Water, 2015, 43, 1121–1127 CAS.
- A. A. Sagade and R. Sharma, Copper sulphide (CuxS) as an ammonia gas sensor working at room temperature, Sens. Actuators, B, 2008, 133, 135–143 CrossRef CAS.
- H. Karami and S. Babaei, Application of tin sulfide–tin dioxide nanocomposite as oxygen gas sensing agent, Int. J. Electrochem. Sci., 2013, 8, 12078 CAS.
- A. Gaiardo, B. Fabbri, V. Guidi, P. Bellutti, A. Giberti, S. Gherardi, L. Vanzetti, C. Malagù and G. Zonta, Metal Sulfides as Sensing Materials for Chemoresistive Gas Sensors, Sensors, 2016, 16, 296 CrossRef PubMed.
- A. Giberti, A. Gaiardo, B. Fabbri, S. Gherardi, V. Guidi, C. Malagù, P. Bellutti, G. Zonta, D. Casotti and G. Cruciani, Tin(IV) sulfide nanorods as a new gas sensing material, Sens. Actuators, B, 2016, 223, 827–833 CrossRef CAS.
- M. Ahmad, M. Rafiq, Z. Imran, K. Rasool, R. Shahid, Y. Javed and M. Hasan, Charge conduction and relaxation in MoS2 nanoflakes synthesized by simple solid state reaction, J. Appl. Phys., 2013, 114, 043710 CrossRef.
- M. Ahmad, M. Rafiq, K. Rasool, Z. Imran and M. Hasan, Dielectric and transport properties of bismuth sulfide prepared by solid state reaction method, J. Appl. Phys., 2013, 113, 043704 CrossRef.
- M. Ahmad, M. Rafiq and M. Hasan, Transport characteristics and colossal dielectric response of cadmium sulfide nanoparticles, J. Appl. Phys., 2013, 114, 133702 CrossRef.
- J.-G. Kang, Y.-D. Ko, K. J. Choi, J.-G. Park and D.-W. Kim, Fabrication of tin monosulfide nanosheet arrays using laser ablation, Appl. Phys. A: Mater. Sci. Process., 2011, 103, 505–510 CrossRef CAS.
- M. Salavati-Niasari and F. Davar, Shape selective hydrothermal synthesis of tin sulfide nanoflowers based on nanosheets in the presence of thioglycolic acid, J. Alloys Compd., 2010, 492, 570–575 CrossRef CAS.
- G. Barone, T. G. Hibbert, M. F. Mahon, K. C. Molloy, L. S. Price, I. P. Parkin, A. M. Hardy and M. N. Field, Deposition of tin sulfide thin films from tin(IV) thiolate precursors, J. Mater. Chem., 2001, 11, 464–468 RSC.
- M. Sousa, A. Da Cunha and P. Fernandes, Annealing of RF-magnetron sputtered SnS2 precursors as a new route for single phase SnS thin films, J. Alloys Compd., 2014, 592, 80–85 CrossRef CAS.
- S. Mohamed, SnO2 dendrites–nanowires for optoelectronic and gas sensing applications, J. Alloys Compd., 2012, 510, 119–124 CrossRef CAS.
- J. Lv, C. Liu, W. Gong, Z. Zi, X. Chen, X. Chen, K. Huang, G. He, S. Shi and X. Song, Study of near white light emission for ZnO thin films grown on silicon substrates, Semicond. Sci. Technol., 2012, 27, 115021 CrossRef.
- N. Hongsith, E. Wongrat, T. Kerdcharoen and S. Choopun, Sensor response formula for sensor based on ZnO nanostructures, Sens. Actuators, B, 2010, 144, 67–72 CrossRef CAS.
- F.-Y. Ran, Z. Xiao, Y. Toda, H. Hiramatsu, H. Hosono and T. Kamiya, n-Type conversion of SnS by isovalent ion substitution: Geometrical doping as a new doping route, Sci. Rep., 2015, 5, 10428 CrossRef PubMed.
- T. Wolkenstein, Electronic processes on semiconductor surfaces during chemisorption, Springer Science & Business Media, 2012 Search PubMed.
- N. Banerjee, S. Roy, C. K. Sarkar and P. Bhattacharyya, High dynamic range methanol sensor based on aligned ZnO nanorods, IEEE Sens. J., 2013, 13, 1669–1676 CrossRef CAS.
- S. Pokrel, C. Simon, V. Quemener, N. Bârsan and U. Weimer, Investigation of conduction mechanism in Cr2O3 gas sensing thick films by ac impedance spectroscopy and work function changes measurements, Sens. Actuators, B, 2008, 133, 78–83 CrossRef.
- J.-W. Yoon, J.-K. Choi and J.-H. Lee, Design of a highly sensitive and selective C2H5OH sensor using p-type Co3O4 nanofibers, Sens. Actuators, B, 2012, 161, 570–577 CrossRef CAS.
- N. Kılınç, E. Şennik and Z. Öztürk, Fabrication of TiO2 nanotubes by anodization of Ti thin films for VOC sensing, Thin Solid Films, 2011, 520, 953–958 CrossRef.
- K.-W. Kao, M.-C. Hsu, Y.-H. Chang, S. Gwo and J. A. Yeh, A sub-ppm acetone gas sensor for diabetes detection using 10 nm thick ultrathin InN FETs, Sensors, 2012, 12, 7157–7168 CrossRef CAS PubMed.
- N. Banerjee, B. Bhowmik, S. Roy, C. Sarkar and P. Bhattacharyya, Anomalous recovery characteristics of Pd modified ZnO nanorod based acetone sensor, J. Nanosci. Nanotechnol., 2013, 13, 6826–6834 CrossRef CAS PubMed.
- J. Li, P. Tang, J. Zhang, Y. Feng, R. Luo, A. Chen and D. Li, Facile Synthesis and Acetone Sensing Performance of Hierarchical SnO2 Hollow Microspheres with Controllable Size and Shell Thickness, Ind. Eng. Chem. Res., 2016, 55, 3588–3595 CrossRef CAS.
- R. Zhang, T. Zhang, T. Zhou, Z. Lou, J. Deng and L. Wang, Fast and real-time acetone gas sensor using hybrid ZnFe2O4/ZnO hollow spheres, RSC Adv., 2016, 6, 66738–66744 RSC.
- R. Paulraj, G. K. Mani, L. Nallathambi and J. B. B. Rayappan, A Room Temperature Methanol Vapour Sensor Based on Polyaniline Nanoparticles, J. Nanosci. Nanotechnol., 2016, 16, 8315–8321 CrossRef CAS.
- S. Wang, P. Wang, Z. Li, C. Xiao, B. Xiao, R. Zhao, T. Yang and M. Zhang, Highly enhanced methanol gas sensing properties by Pd0.5Pd3O4 nanoparticle loaded ZnO hierarchical structures, RSC Adv., 2014, 4, 35375–35382 RSC.
- W. Tang and J. Wang, Methanol sensing micro-gas sensors of SnO2–ZnO nanofibers on Si/SiO2/Ti/Pt substrate via stepwise-heating electrospinning, J. Mater. Sci., 2015, 50, 4209–4220 CrossRef CAS.
- L. Zhu, Y. Wang, D. Zhang, C. Li, D. Sun, S. Wen, Y. Chen and S. Ruan, Gas Sensors Based on Metal Sulfide Zn1−xCdxS Nanowires with Excellent Performance, ACS Appl. Mater. Interfaces, 2015, 7, 20793–20800 CAS.
- M. Liu, S. Ren, R. Zhang, Z. Xue, C. Ma, M. Yin, X. Xu, S. Bao and C. Chen, Gas Sensing Properties of Epitaxial LaBaCo2O5. 5 + δ Thin Films, Sci. Rep., 2015, 5, 10784 CrossRef CAS PubMed.
- X. Deng, S. Sang, P. Li, G. Li, F. Gao, Y. Sun, W. Zhang and J. Hu, Preparation, characterization, and mechanistic understanding of Pd-decorated ZnO nanowires for ethanol sensing, J. Nanomater., 2013, 2013, 150 Search PubMed.
- X. Liu, N. Chen, X. Xing, Y. Li, X. Xiao, Y. Wang and I. Djerdj, A high-performance n-butanol gas sensor based on ZnO nanoparticles synthesized by a low-temperature solvothermal route, RSC Adv., 2015, 5, 54372–54378 RSC.
- B. Han, X. Liu, X. Xing, N. Chen, X. Xiao, S. Liu and Y. Wang, A high response butanol gas sensor based on ZnO hollow spheres, Sens. Actuators, B, 2016, 237, 423–430 CrossRef CAS.
| This journal is © The Royal Society of Chemistry 2017 |

