 Open Access Article
The effect of acid treatment on the active sites and reaction intermediates of the low-cost TS-1 in propylene epoxidation†
Guang Xiong *,
Qianying Jia,
Yuanyuan Cao,
Liping Liu and
Zhendong Guo
State Key Laboratory of Fine Chemicals, School of Chemical Engineering, Dalian University of Technology, Dalian 116024, China. E-mail: gxiong@dlut.edu.cn; Fax: +86-411-84986340
First published on 3rd May 2017
Abstract
This study investigated the roles of the different titanium species of low-cost TS-1 in propylene epoxidation and the influence of acid treatments. The low-cost TS-1 zeolites with different titanium species were synthesized using the hydrothermal method and characterized by ultraviolet (UV)-Raman, X-Ray Diffraction (XRD), ultraviolet visible diffuse reflectance spectroscopy (UV-Vis), N2 physical absorption and NH3 temperature programmed desorption (NH3-TPD) techniques. The roles of the different titanium species in the low-cost TS-1 samples were investigated by gas chromatography-Raman spectrometry (GC-Raman) during the propylene epoxidation process. The framework titanium species was found to be active for propylene epoxidation, while the extra-framework Ti species were found to be harmful for propylene epoxidation due to their acidity. The extra-framework Ti species can be removed by acid treatments. It was found that the acid treatment of the as-synthesized TS-1 is more effective since the amorphous TiO2 was not transformed into anatase TiO2 upon calcination. Strong acids, such as HCl, HNO3 and H2SO4, are more efficient for the elimination of the extra-framework TiO2, but do not significantly affect the framework titanium species. After treatment with an acid of a suitable concentration, the amount of the active intermediate species Ti–OOH(η2) can be increased, and a higher conversion of propylene and yield of PO can be achieved.
1. Introduction
The system of titanium silicalite (TS-1) and H2O2 has been an important topic in green catalytic chemistry for decades because of its unique catalytic properties in oxidation reactions under mild conditions.1–5 The classical method was used to produce TS-1 with the crystal size of 100–200 nm, which exhibited good catalytic properties. However, the template tetrapropyl ammonium hydroxide (TPAOH) used in the classical method is expensive, which restrains its applications in industry. Some attempts have been made to reduce the amount of the template TPAOH required. Deng6 carried out hydrothermal synthesis of TS-1 with a lower ratio of TPAOH/SiO2 in two-step and multistep hydrolysis processes by fine tuning the nucleation and growth step during crystallization, which showed good activity in the oxidation of alkene and ammoximation of ketone. To further reduce the cost of the catalyst, tetrapropyl ammonium bromide (TPABr) was used as a template for the synthesis of TS-1.7 However, the catalytic performance of the low-cost TS-1 is not as good as that of the classical TS-1. Therefore, post-treatments have been used to further improve the catalytic properties of the low-cost TS-1. Li8 reported the acid treatment of the low-cost TS-1, and the catalytic activity in the propylene oxidation reaction showed a large improvement because of the elimination of the non-framework titanium species. In addition, the alkali treatment is a common method in improving the catalytic performance of the TS-1 zeolite. Tsai9 reported the alkali treatment of TS-1 using NaOH, leading to the generation of the mesopore and subsequently an increase in the catalytic activity. Tuel10,11 put forward the dissolution–recrystallization method using the TPAOH to improve the diffusion of TS-1.In addition, the roles of different titanium species in the classical TS-1 during the propylene epoxidation process have been studied.12,13 It was accepted that the isolated titanium species in the framework of the TS-1 zeolite is the active site for the selective oxidation. The non-framework Ti species is harmful for the epoxidation reactions. It was found that the acidity of the amorphous Ti species is stronger than that of the anatase TiO2, which leads to undesired side reaction.13 For the low-cost TS-1 zeolite, the distribution of the titanium species is more complicated. Therefore, to improve its catalytic properties, a systematic study on the distribution and the roles of the different titanium species, before and after the post-treatment, are highly required to be known.
Raman spectroscopy has been proven to be a powerful tool to identify the different Ti species by changing the wavelength of the excitation source, particularly under reaction conditions.13–16 Three resonance enhanced Raman bands at 490, 530, and 1125 cm−1 obtained with the use of a 244 nm laser line are the typical peaks of the isolated tetrahedral titanium species in the framework of TS-1. In the spectra excited by the 325 and 532 nm lines, the bands at 144, 390, 515, and 637 cm−1 are ascribed to anatase TiO2. The band at 700 cm−1 was assigned to the amorphous Ti species. Raman spectroscopy has also been used to investigate the reaction intermediates on the TS-1 for propylene epoxidation. The reaction intermediate Ti–OOH(η2) is found to be crucial for propylene epoxidation, whose typical peak is located at 837 cm−1.16
Our previous studies mainly focused on the classical TS-1 when the expensive TPAOH was used as a template. In this study, the low-cost TS-1 zeolite containing different titanium species was synthesized by changing the Ti/Si ratio and synthesis conditions. Then, the technique of gas chromatography-Raman spectroscopy (GC-Raman)13 was used to study the relationship between the amount of active intermediate, the product propylene epoxide (PO) and the conversion of propylene. The roles of different titanium species in low-cost TS-1 for propylene epoxidation are discussed herein. Furthermore, the post treatment with different acids was used to eliminate the extra-framework Ti-species of the TS-1. The effects of the acid treatment on the Ti distribution, the reaction intermediates and the catalytic properties were investigated using the GC-Raman technique.
2. Experimental
2.1 Synthesis
![[thin space (1/6-em)]](https://www.rsc.org/images/entities/char_2009.gif) :
:![[thin space (1/6-em)]](https://www.rsc.org/images/entities/char_2009.gif) (0–0.3)TiO2
(0–0.3)TiO2![[thin space (1/6-em)]](https://www.rsc.org/images/entities/char_2009.gif) :
:![[thin space (1/6-em)]](https://www.rsc.org/images/entities/char_2009.gif) (0.1–0.3)TPABr
(0.1–0.3)TPABr![[thin space (1/6-em)]](https://www.rsc.org/images/entities/char_2009.gif) :
:![[thin space (1/6-em)]](https://www.rsc.org/images/entities/char_2009.gif) 30 H2O
30 H2O![[thin space (1/6-em)]](https://www.rsc.org/images/entities/char_2009.gif) :
:![[thin space (1/6-em)]](https://www.rsc.org/images/entities/char_2009.gif) 1.0 IPA
1.0 IPA![[thin space (1/6-em)]](https://www.rsc.org/images/entities/char_2009.gif) :
:![[thin space (1/6-em)]](https://www.rsc.org/images/entities/char_2009.gif) 0.15 ethylamine. The solid product was filtered, washed with distilled water, dried at 100 °C overnight and calcined at 550 °C for 10 h to remove the template. TS-1 samples with different titanium distributions were synthesized by adjusting the SiO2/TiO2 ratios.
0.15 ethylamine. The solid product was filtered, washed with distilled water, dried at 100 °C overnight and calcined at 550 °C for 10 h to remove the template. TS-1 samples with different titanium distributions were synthesized by adjusting the SiO2/TiO2 ratios.2.2 Acid treatment
The TS-1 sample with a SiO2/TiO2 molar ratio of 30 was treated for 24 h with an acid modifier at a liquid to solid ratio of 50 mL g−1. Following this, the solution was centrifuged, washed with distilled water, dried at 100 °C overnight and calcined at 550 °C for 10 h.2.3 Characterization
X-ray powder diffraction (XRD) patterns were recorded on a Rigaku D/MAX-2400 using Cu Kα radiation with a scanning rate of 4° min−1.Ultraviolet-visible diffuse reflectance spectra (UV-Vis) were obtained on a SHIMADZU UV-240 spectrometer using BaSO4 as a reference.
Nitrogen physisorption measurements were performed on a Quantachrome Autosorb-1-MP adsorption porosimeter at 77 K. All samples were degassed at 623 K for 3 h under vacuum. The specific surface area and the micropore volume were calculated by the BET method and the t-plot method, respectively. The total pore volume was determined at a relative partial pressure P/P0 of 0.99.
Scanning electron microscopy (SEM) was carried out on a Hitachi S-4800 instrument operating at 3 kV.
The NH3-TPD was performed on a ChemBET 3000 chemisorb apparatus from Quantachrome. The rate of ammonia desorption was monitored continuously with a thermal conductivity detector (TCD).
Raman spectra were recorded on a DL-2 Raman spectrometer with a collection time of 300 s. A 244 nm line of LEXEL LASER and 325 nm line of a He–Cd laser were used as excitation sources. The laser power at the samples was less than 5 mW. An Acton triple monochromator was used as a spectrometer for Raman scattering. The spectra were collected using a Priston CCD detector. During the in situ experiments, the TS-1 sample (0.05 g) was moved into a stainless steel cell equipped with a quartz window after the addition of H2O2/H2O/CH3OH solution. Propylene (3% propylene and 97% helium gas in volume fraction) was introduced into the cell at a flow rate of 25 mL min−1. The spectra during the reaction process were recorded by the UV-Raman spectrometer. Moreover, the component analysis of the output gas was detected on a GC 9790 gas chromatograph, using a flame ionization detector and a capillary column (PEG-20M, 30 m). The concentration of propylene oxide (PO) was presented directly by its peak area in the GC spectra. The peak area was integrated by the OriginPro (8.0) program.
3. Results and discussion
3.1 Catalyst characterization
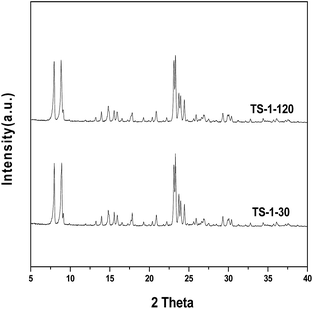
The XRD patterns of the TS-1 samples with different SiO2/TiO2 ratios are shown in Fig. 1. Both samples exhibit the characteristic peaks at 2θ = 7.8°, 8.8°, 23.2°, 23.8° and 24.3°, which are typical for MFI topology.
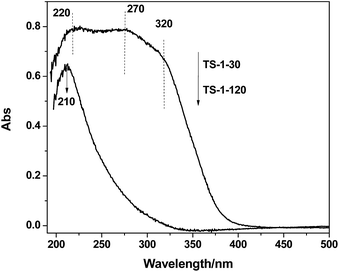
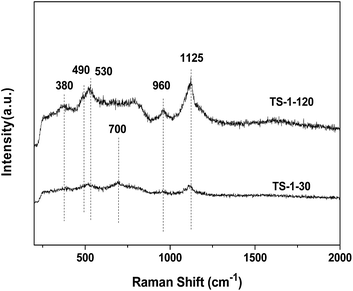
![[double bond, length as m-dash]](https://www.rsc.org/images/entities/char_e001.gif) O, silanol group Si–OH, titanium related defect sites or the Ti–O–Si bridge. The peaks at 490, 530 and 1125 cm−1 are characteristic of the framework Ti species. The TS-1-30 also shows a band at 700 cm−1, which is assigned to the amorphous Ti species.19 Compared with the spectra of TS-1-120, the intensities of all peaks for the sample TS-1-30 are distinctly weak, which is due to the strong absorption of UV light by the non-framework Ti species.
O, silanol group Si–OH, titanium related defect sites or the Ti–O–Si bridge. The peaks at 490, 530 and 1125 cm−1 are characteristic of the framework Ti species. The TS-1-30 also shows a band at 700 cm−1, which is assigned to the amorphous Ti species.19 Compared with the spectra of TS-1-120, the intensities of all peaks for the sample TS-1-30 are distinctly weak, which is due to the strong absorption of UV light by the non-framework Ti species.
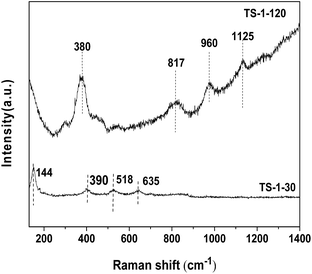
Fig. 4 shows the Raman spectra of the TS-1 samples with different SiO2/TiO2 ratios collected with a 325 nm laser line. The TS-1-30 sample shows the Raman bands at 144, 390, 518 and 635 cm−1, which are typical for the anatase TiO2. In comparison, the bands of anatase TiO2 are absent in the spectrum of the TS-1-120 sample. The TS-1-120 sample shows the peaks at 380, 817, 960 and 1125 cm−1, which are assigned to the MFI structure. The Raman results further confirm that TS-1-120 contains only framework Ti species, while TS-1-30 contains the framework Ti species, amorphous TiO2 and anatase TiO2. This is consistent with the UV-Vis result (see Fig. 2).
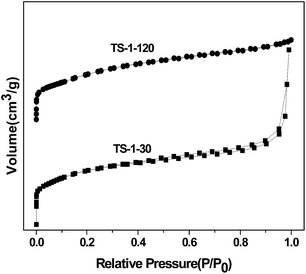
Table 1 shows the textural properties of the TS-1 samples with different SiO2/TiO2 ratios. It can be seen that the BET surface area, the microporous surface area and the microporous volume of the TS-1-30 sample are all lower than that of the sample with high SiO2/TiO2 ratio (120). From the previous result, we know that the sample of SiO2/TiO2 ratio = 30 contains the non-framework Ti species, which may block the channels to some extent.
| Samples | SBET (m2 g−1) | Smicro (m2 g−1) | Sext (m2 g−1) | Vtotal (cm3 g−1) | Vmicro (cm3 g−1) | Vmeso (cm3 g−1) |
|---|---|---|---|---|---|---|
| TS-1-30 | 389.9 | 355.1 | 34.8 | 0.2382 | 0.1501 | 0.0881 |
| TS-1-120 | 440.8 | 392.5 | 48.3 | 0.2379 | 0.1821 | 0.0558 |
3.2 In situ GC-Raman results
![[thin space (1/6-em)]](https://www.rsc.org/images/entities/char_2009.gif) :
:![[thin space (1/6-em)]](https://www.rsc.org/images/entities/char_2009.gif) 1) on the TS-1 sample (0.05 g), the Raman spectra of the TS-1/H2O2/H2O/CH3OH system, under a continuous flow of propylene, were collected. Methanol was added because it is the best solvent for liquid phase epoxidation of alkenes. The Raman spectra of the TS-1/H2O2–H2O/CH3OH system are shown in Fig. 8. It can be seen that the evolution of the Raman spectra of the abovementioned system with different Ti species distributions are similar. In the beginning of the reaction, the bands at 490, 530, and 1125 cm−1 are extremely quenched immediately. The band at 1125 cm−1 shifts to 1134 cm−1, which has been attributed to the expansion of the Ti coordination sphere. Once the Ti coordination sphere expands, the Td-like symmetry of the Ti(IV) species is destroyed, and the symmetry of the vibrational modes is no longer the same as that of the LMCT. A new shoulder at 618 cm−1 is attributed to the symmetric breathing mode of the Ti(O2)− cycle.20
1) on the TS-1 sample (0.05 g), the Raman spectra of the TS-1/H2O2/H2O/CH3OH system, under a continuous flow of propylene, were collected. Methanol was added because it is the best solvent for liquid phase epoxidation of alkenes. The Raman spectra of the TS-1/H2O2–H2O/CH3OH system are shown in Fig. 8. It can be seen that the evolution of the Raman spectra of the abovementioned system with different Ti species distributions are similar. In the beginning of the reaction, the bands at 490, 530, and 1125 cm−1 are extremely quenched immediately. The band at 1125 cm−1 shifts to 1134 cm−1, which has been attributed to the expansion of the Ti coordination sphere. Once the Ti coordination sphere expands, the Td-like symmetry of the Ti(IV) species is destroyed, and the symmetry of the vibrational modes is no longer the same as that of the LMCT. A new shoulder at 618 cm−1 is attributed to the symmetric breathing mode of the Ti(O2)− cycle.20
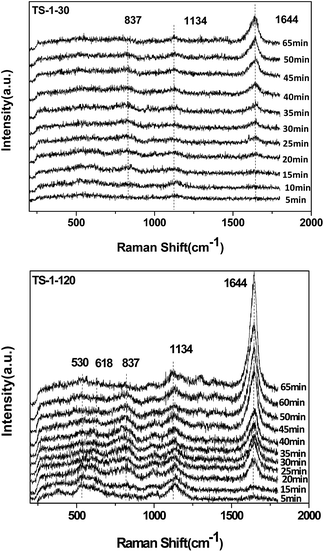 | ||
| Fig. 8 In situ Raman spectra of the TS-1/H2O2–H2O/CH3OH system obtained at different times during the methanol-included epoxidation reaction, collected with a 244 nm laser line. | ||
Moreover, the feature at 837 cm−1, which has been assigned to a Ti–OOH(η2) species, appears quickly. The intensity of the band at 837 cm−1 first increases and then drops gradually as time passes. At the same time, the peak area of PO in the GC spectra shows the same trend, which indicates good correlation. A band at 1644 cm−1, which is related to propylene physisorbed into the zeolite channels, appears and its intensity increases with increasing the reaction time.
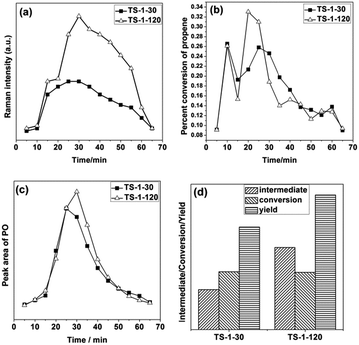
Fig. 9 shows the variation trend of the characteristic peak as the reaction time increases. As shown in Fig. 9, the amount of the active intermediate Ti–OOH(η2) on the TS-1-30 is lower than that on TS-1-120, although the concentration of the framework Ti species of TS-1-30 is higher than that of TS-1-120 (see Fig. 2). The result indicates that the existence of the non-framework Ti species influences the formation of the active intermediate Ti–OOH(η2). The H2O2 decomposition is not taken into account in this study due to the low reaction temperature. One possibility is that the non-framework Ti species block the channel, preventing the effective contact between the H2O2 solution and active center. The conversion of TS-1-30 is slightly higher than that of the TS-1-120, while the PO yield of the former is much less than the latter. The inverse relationship should be due to the presence of the non-framework Ti species (see Fig. 2). The acidic non-framework Ti species can convert the PO to other by-products and reduce the yield of PO. This result is consistent with that obtained on the classical TS-1 synthesised with TPAOH.13 In a vapor-phase epoxidation of propene, the absorbed PO may open the ring to form branched alkanes, which are subsequently converted into polyalkenes, propanal and so on.20–23 The side reaction of PO lowers the selectivity of the TS-1 catalyst unquestionably. Therefore, the acidic non-framework Ti species in TS-1-30 sample should be eliminated.
3.3 Acid treatment of TS-1 with the SiO2/TiO2 = 30
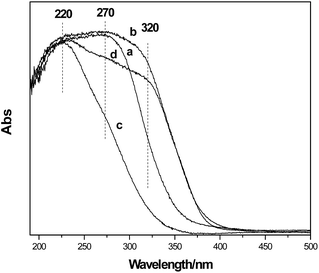 | ||
| Fig. 10 UV-Vis spectra of the TS-1 samples (SiO2/TiO2 = 30) modified by the different post-treatments. (a) Dry; (b) dry-calcine; (c) dry-acid treating-calcine; (d) dry-calcine-acid treating-calcine. | ||
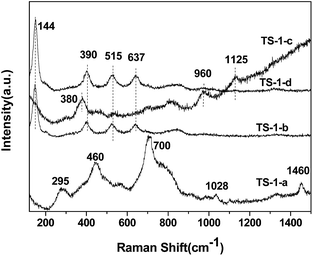
Fig. 11 shows the Raman spectra of the TS-1 samples modified by different post-treatments with the use of 325 nm line. The as-synthesized sample (TS-1-a) shows the intense Raman bands at 295, 460, 700, 1028 and 1460 cm−1. The bands appearing at 295 cm−1 and 460 cm−1 are the five-membered ring structure and the bending vibration of Si–O, respectively.25 The band at 700 cm−1 is typical for the amorphous Ti species. The latter two are associated with TPAOH. No Raman bands at 144, 390, 515 and 637 cm−1 are observed, indicating the absence of anatase TiO2. After the calcination (b) these peaks appear, indicating the formation of the anatase TiO2. It is clear that the following acid treatment and calcination (d) cannot eliminate the anatase TiO2. However, if the acid treatment is performed before the calcination step (c), no anatase TiO2 can be found in the spectrum. The bands at 380, 960 and 1125 cm−1, which are associated with the framework of TS-1, were clearly observed. The results reveal that the anatase TiO2 cannot be removed once the samples are calcined prior to acid treatment. The above result is in agreement with the UV-Vis spectroscopy result. Therefore, the TS-1 was treated with HCl prior to calcination in the following sections.
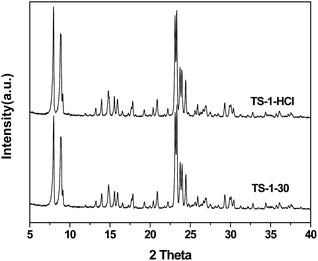
Fig. 12 shows the XRD patterns of the TS-1 samples before and after the HCl acid treatment. It is clear that the sample keeps the MFI topology structure perfectly after acid treatment.
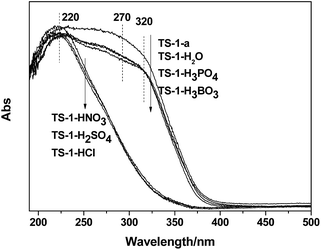
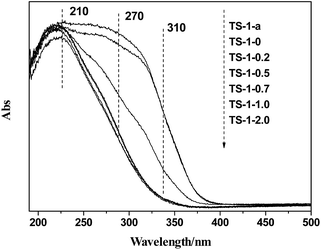
In conclusion, almost all the non-framework Ti species can be eliminated, while the framework Ti species is barely influenced by choosing the appropriate HCl concentration (0.5–1.0 mol L−1).
| Samples | SBET (m2 g−1) | Smicro (m2 g−1) | Sext (m2 g−1) | Vtotal (cm3 g−1) | Vmicro (cm3 g−1) | Vmeso (cm3 g−1) |
|---|---|---|---|---|---|---|
| TS-1-30 | 389.9 | 355.1 | 34.8 | 0.2382 | 0.1501 | 0.0881 |
| TS-1-0.7 | 401.9 | 372.5 | 29.4 | 0.2518 | 0.1575 | 0.0943 |
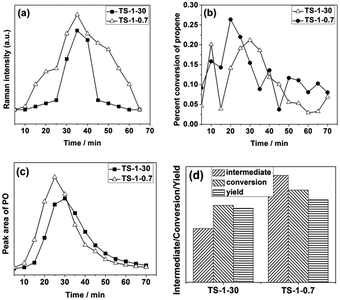
As shown in Fig. 16d, the amount of the active intermediate Ti–OOH(η2), conversion and PO yield are increased after the acid washing treatment step. This indicates that the elimination of the non-framework TiO2 species favors the formation of the active intermediate Ti–OOH(η2) and PO. This is most likely due to two possible reasons: (1) the acid treatment may improve the diffusion property of the zeolite by removing the non-framework TiO2, thus facilitating the contact between the framework Ti species and H2O2. (2) The opening reaction of the PO is inhibited by elimination of the acidic non-framework TiO2. Therefore, the in situ GC-Raman results indicate that the conversion and PO yield can be improved by the elimination of the non-framework TiO2 by a proper acid treatment procedure.
4. Conclusions
The acid treatment on the low-cost TS-1 was systematically investigated using various techniques. The results demonstrate that the framework Ti species is the active center for low-cost TS-1 zeolite. The existence of the non-framework Ti species influences the amount of Ti–OOH(η2) and reduces the yield of PO. The acid treatment step was used to eliminate the non-framework TiO2. It was found that the acid treatment of the as-synthesized TS-1 before the calcination is key to efficiently eliminate the non-framework TiO2. During the calcination process, the amorphous TiO2 can be transformed into anatase TiO2, which is difficult to be removed following acid treatment. The strong acids are more efficient for elimination of the non-framework TiO2 than the relatively weak acids. After treatment with 0.5–1.0 mol L−1 HCl solution, most of the non-framework Ti species were eliminated, while the framework Ti species was maintained. As a result, the amount of active intermediate Ti–OOH (η2), the conversion of propylene and the yield of PO can be improved through acid treatment with appropriate concentration.Acknowledgements
This study was financially supported by the National Science Foundation of China(NSFC, Grant 21473016).References
- M. Taramasso, G. Perego and B. Notari. Preparation of porous crystalline synthetic material comprised of silicon and titanium oxides, US Pat., 4410501, 1983.
- A. Thangaraj, M. J. Eapen and S. Sivasanker, et al., Studies on the synthesis of titanium silicalite, TS-1, Zeolites, 1992, 12(8), 943–950 CrossRef CAS.
- G. Li, X. Guo and X. Wang, et al., Synthesis of titanium silicalites in different template systems and their catalytic performance, Appl. Catal., A, 1999, 185(1), 11–18 CrossRef CAS.
- J. Fang, J. Li and B. Zhang, et al., Support Effect on the Size and Catalytic Activity of Thiolated Au25 Nanoclusters as Precatalyst, Nanoscale, 2015, 7(14), 6325–6233 RSC.
- B. Zhang, J. Fang and J. G. Li, et al., Soft, Oxidative Stripping of Alkyl Thiolate Ligands from Hydroxyapatite-Supported Gold Nanoclusters for Oxidation Reactions, Chem.–Asian J., 2016, 11(4), 532–539 CrossRef CAS PubMed.
- X. J. Deng, Y. N. Wang and L. Shen, et al., Low-Cost Synthesis of Titanium Silicalite-1 (TS-1) with Highly Catalytic Oxidation Performance through a Controlled Hydrolysis Process, Ind. Eng. Chem. Res., 2013, 52(3), 1190–1196 CrossRef CAS.
- U. Müller and W. Steck, Ammonium-Based Alkaline-Free Synthesis of MFI-Type Boron- and Titanium Zeolites, Stud. Surf. Sci. Catal., 1994, 84, 203–210 CrossRef.
- G. Li, X. Guo and X. Wang, et al., Synthesis of titanium silicalites in different template systems and their catalytic performance, Appl. Catal., A, 1999, 185(1), 11–18 CrossRef CAS.
- S. T. Tsai, P. Y. Chao and T. C. Tsai, et al., Effects of pore structure of post-treated TS-1 on phenol hydroxylation, Catal. Today, 2009, 148(1–2), 174–178 CrossRef CAS.
- Y. Wang, M. Lin and A. Tuel, Hollow TS-1 crystals formed via a dissolution–recrystallization process, Microporous Mesoporous Mater., 2007, 102(1–3), 80–85 CrossRef CAS.
- Y. Wang and A. Tuel, Nanoporous zeolite single crystals: ZSM-5 nanoboxes with uniform intracrystalline hollow structures, Microporous Mesoporous Mater., 2008, 113(1), 286–295 CrossRef CAS.
- V. Bolis, S. Bordiga and C. Lamberti, et al., A calorimetric, IR, XANES and EXAFS study of the adsorption of NH3 on Ti-silicalite as a function of the sample pre-treatment, Microporous Mesoporous Mater., 1999, 30(1), 67–76 CrossRef CAS.
- G. Xiong, Y. Cao and Z. Guo, et al., The roles of different titanium species in TS-1 zeolite in propylene epoxidation studied by in situ UV Raman spectroscopy, Phys. Chem. Chem. Phys., 2016, 18, 190–196 RSC.
- G. Qiang, S. Keju and F. Zhaochi, et al., A thorough investigation of the active titanium species in TS-1 zeolite by in situ UV resonance raman spectroscopy, Chemistry, 2012, 18(43), 13854–13860 CrossRef PubMed.
- C. Li, G. Xiong and Q. Xin, et al., UV-Resonanz-Raman-spektroskopischeIdentifizierung von TitanatomenimGerüst des Zeoliths TS-1, Angew. Chem., 1999, 111(15), 2358–2360 CrossRef.
- L. Wang, G. Xiong and J. Su, et al., In Situ UV Raman Spectroscopic Study on the Reaction Intermediates for Propylene Epoxidation on TS-1, J. Phys. Chem. C, 2012, 116(116), 9122–9131 CAS.
- G. Ricchiardi, A. Damin and S. Bordiga, et al., Vibrational Structure of Titanium Silicate Catalysts. A Spectroscopic and Theoretical Study, J. Am. Chem. Soc., 2001, 123(46), 11409–11419 CrossRef CAS PubMed.
- M. A. Camblor, A. Corma and J. Pérez-Pariente, Synthesis of titanoaluminosilicatesisomorphous to zeolite Beta, active as oxidation catalysts, Zeolites, 1993, 13(2), 82–87 CrossRef CAS.
- J. Su, G. Xiong and J. Zhou, et al., Amorphous Ti species in titanium silicalite-1: Structural features, chemical properties, and inactivation with sulfosalt, J. Catal., 2012, 288(4), 1–7 CrossRef CAS.
- S. Bordiga, A. Damin and F. Bonino, et al., Resonance Raman effects in TS-1: the structure of Ti(IV) species and reactivity towards H2O, NH3 and H2O2: an in situ study, Phys. Chem. Chem. Phys., 2003, 5(20), 4390–4393 RSC.
- B. S. Uphade, T. Akita and T. Nakamura, et al., Vapor-Phase Epoxidation of Propene Using H2 and O2 over Au/Ti-MCM-48, J. Catal., 2002, 209, 331–340 CrossRef CAS.
- X. Feng, N. Sheng and Y. B. Liu, et al., Simultaneously Enhanced Stability and Selectivity for Propene Epoxidation with H2 and O2 on Au Catalysts Supported on Nano-Crystalline Mesoporous TS-1, ACS Catal., 2017, 7, 2668–2675 CrossRef CAS.
- X. Feng, Y. B. Liu and Y. C. Li, et al., Au/TS-1 Catalyst for Propene Epoxidation with H2/O2: A Novel Strategy to Enhance Stability by Tuning Charging Sequence, AIChE J., 2016, 62(11), 3963–3972 CrossRef CAS.
- L. Kong, G. Li and X. Wang, Kinetics and Mechanism of Liquid-Phase Oxidation of Thiophene over TS-1 Using H2O2 Under Mild Conditions, Catal. Lett., 2004, 92(3), 163–167 CrossRef CAS.
- E. Astorino, J. B. Peri and R. J. Villey, et al., Spectroscopic characterization of silicalite-1 and titanium silicalite-1, J. Catal., 1995, 157(2), 482–500 CrossRef CAS.
Footnote |
| † Electronic supplementary information (ESI) available. See DOI: 10.1039/c7ra02983g |
| This journal is © The Royal Society of Chemistry 2017 |

