 Open Access Article
Creative Commons Attribution 3.0 Unported Licence
Synthesis of Pb(II)-imprinted poly(methacrylic acid) polymeric particles loaded with 1-(2-pyridylazo)-2-naphthol (PAN) for micro-solid phase preconcentration of Pb2+ on-line coupled to flame atomic absorption spectrometry
Andréia M. Basagliaa,
Marcela Z. Corazzab,
Mariana G. Segatellia and
César R. T. Tarley *ac
*ac
aUniversidade Estadual de Londrina (UEL), Departamento de Química, Centro de Ciências Exatas, Rodovia Celso Garcia Cid, PR 445, km 380, Londrina, PR 86050-482, Brazil. E-mail: ctarleyquim@yahoo.com.br
bFaculdade de Ciências Exatas e Tecnologia, FACET, Universidade Federal da Grande Dourados (UFGD), Dourados, MS CEP 79804-970, Brazil
cInstituto Nacional de Ciência e Tecnologia (INCT) de Bioanalítica, Universidade Estadual de Campinas (UNICAMP), Instituto de Química, Departamento de Química Analítica, Cidade Universitária Zeferino Vaz, s/n, Campinas, SP 13083-970, Brazil
First published on 29th June 2017
Abstract
In the present study, a new ion-selective imprinted polymer based on poly(methacrylic acid) loaded with 1-(2-pyridylazo)-2-naphthol (PAN) (IIP/PAN) has been synthesized, characterized and evaluated as a solid adsorbent for the preconcentration of Pb2+ with on-line determination by Flame Atomic Absorption Spectrometry (FAAS). For comparative study, a blank polymer (NIP) and IIP (imprinted polymer) without PAN were synthesized. The polymers were characterized by FT-IR and textural data through nitrogen adsorption/desorption measurements. Selectivity studies were performed by comparing the competitive adsorption of Pb2+ with Cu2+, Cd2+, Ni2+, Co2+ and Zn2+ on IIPs and NIP, yielding relative selectivity coefficients (k′) higher for IIP/PAN than for IIP and NIP, which confirms the effect of PAN on the improvement of selective performance of IIP. Adsorption kinetic studies showed that the equilibrium adsorption of Pb2+ was reached at 100 min for the three polymers and its data were well described by pseudo-second-order and Elovich models. The maximum adsorption capacities (MAC) were found to be 41.4 mg g−1 for IIP/PAN, 34.2 mg g−1 for IIP and 30.1 mg g−1 for NIP. The proposed on-line preconcentration method was based on loading 20.0 mL of Pb(II) solution (pH 5.70 buffered with 0.048 mol L−1 acetate buffer) through 30 mg of IIP/PAN packed into a minicolumn at 4.0 mL min−1 flow rate with further elution using 1.0 mol L−1 HCl solution. The limits of detection (LOD) and quantification (LOQ) were found to be 0.52 and 1.79 μg L−1, respectively, and linearity was from 1.75 to 200.0 μg L−1 (r = 0.989). The precision of the method assessed in terms of repeatability was found to be 4.1 and 1.9% for 10.0 and 150.0 μg L−1 Pb(II) solutions, respectively. The developed method was successfully applied to different kinds of samples (water, synthetic seawater, serum physiological solution, chocolate powder and Gingko biloba) and its accuracy was assessed by means of recovery tests and analysis of a certified reference material (MESS-3, marine sediment).
Introduction
The contamination by potentially toxic metals is still one of the environmental concerns in recent decades due to the several health problems that metals can cause and their tendency to accumulate in food chains.1–3 Lead is considered one of the metals with unquestionable toxicity and high concentrations in the ecosystem have a substantial impact on the environment and human health. The presence of Pb2+ causes various severe problems in the metabolic processes of humans, such as damaging the kidney, liver, blood composition and nervous system and also retarding the reproductive system in terms of mental function.4–6 Due to the fact that Pb2+ is non-biodegradable and tends to bioaccumulate in the cells of living organisms, stricter environmental requirements and urgent treatment solutions to eliminate lead are crucially necessary. Therefore, many countries and international organizations have set a permissible level for lead in different samples. The World Health Organization and the National Health Surveillance Agency fixed the maximum level in drinking water as 10 μg L−1, whereas for U.S. Environmental Protection and the maximum amount established is 15 μg L−1.7–9 The European Union has set the maximum allowable concentration in food to be from 0.02 to 1 mg L−1 whereas for the organization Food and Agriculture Organization of the United Nations this level is fixed at 25 μg L−1.10 Consequently, the development of reliable methods for the removal and determination of lead in environmental and food samples is of great importance. However, direct determination of metal ions at very low concentration (<μg L−1) by flame atomic absorption spectrometry (FAAS) is limited due to its low sensitivity and for some complex samples it may be prone to matrix interference.11,12 Under these circumstances, in order to determine very low concentrations of Pb2+, separation and preconcentration procedures are highly recommendable for a reliable analysis. In this sense, several adsorbents have been applied to metal ion preconcentration exploiting solid phase extraction (SPE) technique, including silica gel, resins, activated carbon, graphene, titanium oxides, among others. The majority of these adsorbents demonstrate good adsorption capacity, high surface area and good chemical and physical stability. However, interfering compounds might be co-extracted with the target analytes and a matrix effect can be observed using these conventional adsorbents.2,4,13 Over the past several decades, much progress have been made in the development of ion-imprinted polymers (IIPs) with the aid of novel types of tailored selectivity polymeric materials. Due to the popularity of SPE, IIPs have recently been developed and widely employed as advanced analytical tools. These rigid and stable materials are prepared by formation of specific recognition sites in a polymeric matrix. Due to the interaction between monomers and templates, the imprinted materials possess a predetermined arrangement of ligands and selective cavity, which present affinity for the template ion over other structurally related compounds.14 The high selectivity of IIPs can be explained in terms of the polymer memory effect for a metal ion interaction with a specific ligand, coordination geometry, metal ion coordination number and size/charge of the metal ion, which makes them very applicable for elimination of interferences in complex matrices samples.14,15 The synthesis of these polymers may be initiated by the proper choice of monomers, crosslinking agents and ligands to promote exchange interactions with the metal ion, improving the properties of synthesized IIP. Moreover, literature data have reported that nonvinylated chelating trapped in the polymeric chain has been exploited as a promising approach for improving the selectivity performance of IIPs.16 The azo type chelating have been widely employed due to their capacity to form mostly neutral and hydrophobic complexes with the majority of transition metals through oxygen atom of the ortho-hydroxyl group, nitrogen atom from pyridine and one of nitrogen atoms of azo group. It should be noted that theses complexes are stable with rather limited solubility in aqueous solution but much greater solubility in organic system.16 Although promising it is interesting to note that most of these studies are devoted to solid phase extraction procedures by using batch experiments or off-line SPE, which in turn are time-consuming and few studies have demonstrates the real advantages of nonvinylated chelating on the selective performance of IIPs by comparing the IIP-loaded with chelating and the one without chelating.17–21Therefore, the main objective of the present study deals with synthesis of an ion imprinted poly(methacrylic acid) loaded with chelating 1-(2-pyridylazo)-2-naphthol (PAN) and its use in the development of a sensitive and selective preconcentration analytical methodology for Pb(II) using a flow injection system on-line coupled to FAAS. Additionally, the highlight of study relies on a set of experiments for comparing the selective and adsorptive performance of IIP loaded with PAN, IIP without PAN and NIP by means of kinetic and isothermal studies. Moreover, the proposed method was applied to water samples (tap, lake, mineral, synthetic seawater, serum physiologic solution) as well as in acid digested samples with different matrix content, such as chocolate powder, Ginkgo biloba and certified marine sediment, which exalts the great feasibility of method for real sample analysis.
The polymers were characterized by FT-IR and textural data through nitrogen adsorption/desorption measurements and the optimization of analytical method was carried out by using chemometric tools (fractional factorial design and Doehlert matrix),22 which enables the simultaneous study of several control variables, are also faster to implement and more cost-effective than traditional univariate approaches.
To the best of our knowledge, such approach involving the complete investigation of adsorptive, selective and analytical performance of IIP loaded with azo compound in flow injection system has not been reported in the literature.
Materials and methods
Apparatus
An AA-6601 Shimadzu (Kyoto, Japan) flame atomic absorption spectrometer equipped with a hollow cathode lamp as the radiation source (Hananatsu Photonics, K.K.) and a deuterium lamp as background correction was used in the measurements of Pb2+. The hollow cathode lamp was operated at 8.0 mA and the wavelength was set at 217.0 nm, while the flame composition was maintained at acetylene at a flow rate of 2.0 mL min−1 and air at a flow rate of 15 L min−1. The flow injection system was constructed from a peristaltic pump (Ismatec IPC-08, Glattzbrugg, Switzerland) equipped with Tygon® tubes for propelling samples and reagents and a homemade injector commutator Teflon® containing a minicolumn made of polyethylene coupled to the atomic absorption spectrometer. A digital pH meter (Metrohm 826, Herisau, Switzerland) was used for the pH adjustments at 25 ± 1 °C temperature and for the kinetic and isothermal studies a horizontal shaker table (Novatecnica, NT 146 model, São Paulo, Brazil) was used. For the polymers characterization, infrared spectra were recorded on a Shimadzu FT-IR-8300 Fourier transform spectrometer in transmission mode (4000–400 cm−1). Specific surface areas as well as average pore sizes and volumes were estimated through mathematical models of Brunauer–Emmett–Teller (BET) and Barrett–Joyner–Halenda (BJH) methods, respectively, using a Quantachrome Nova 1200e, (Boynton Beach, Florida, USA). A microscopy JEOL JSM-6360 LV equipped with dispersive energy microscopy was used to evaluate the morphological features of polymers. A microwave oven Milestone ETHOS One (Sorisole, Italia) was utilized for sample preparation. For obtain data related to the multivariate analysis and to obtain the nonlinear adsorption isotherms, STATISTICA (version 7.0) and MATLAB 13.0 software were used.Reagents and solutions
All the reagents employed were of analytical grade and all the solutions were prepared in Milli-Q ultrapure water (Millipore, Bedford, MA, USA). Methacrylic acid (MAA, purity 99.5%), 2,2′-azoisobutyronitrile (AIBN, purity 98%), ethylene glycol dimethacrylate (EGDMA), HNO3 (purity 65%, v/v), H2O2 (purity 30%), HCl (37%, v/v) and HF (purity 40%, v/v) were all acquired from Sigma-Aldrich® and used without further purification. 1-(2-Pyridylazo naphthol – PAN) (purity 99.0%) used as chelating agent and Pb(NO3)2 (purity 98.0%) used as ion template were obtained from Vetec, Brazil, respectively. Dimethylsulfoxide (DMSO) was obtained from FMaia (Rio de Janeiro). Buffer solution of Tris–HCl (purity 99–100.1%) and sodium acetate/acetic acid (purity 99.8%) were prepared from its respective salt, both purchased from Merck (Darmstadt, Germany). Pb2+ working solutions were prepared from appropriate dilutions of a 1000 mg L−1 Pb2+ standard solution (NIST) (Spec. Sol, Brazil) using ultrapure water. Cationic solutions used in the foreign studies were prepared from their respective salts without purification, all acquired from Vetec (Brazil).Synthesis of polymers IIP/PAN, IIP and NIP
The synthesis of ion imprinted poly(methacrylic acid) loaded and unloaded with PAN as well as the blank polymer (NIP) was performed by precipitation polymerization technique. Initially in a sealed flask 0.40 mmol of 1-(2-pyridylazo)-2-naphthol (100 mg) was dissolved in 10.0 mL of DMSO to form the Pb–PAN complex. Subsequently, 52 mg of lead nitrate salt (0.157 mmol), dissolved in 1.0 mL ultrapure water, was added to the solution containing the Pb–PAN complex, until completely homogenized. To the mixture, 5.87 mmol of methacrylic acid, 5.30 mmol of ethylene glycol dimethacrylate and 0.304 mmol (50 mg) of 2,2′-azoisobutyronitrile were added to the mixture and N2 gas was bubbled through the solution for 10 minutes before the flask is sealed and kept in an oil bath for 24 hours at 60 °C. After polymerization, the polymer was dried at 60 °C, ground and sieved to obtain particles with diameters between 106 ≤ μm ≤ 150. To remove the excess of reagents trapped into the polymeric matrix and Pb2+ from cavity, successive washings were carried out using 2.0 mol L−1 HCl and water. In addition, to evaluate the selective features and adsorption capacity of the proposed polymer (IIP/PAN), the synthesis of IIP and NIP was performed in the same way as IIP/PAN, except by the absence of PAN and Pb2+, respectively.Batch adsorption studies
 | (1) |
 | (2) |
 | (3) |
 | (4) |
Optimization of on-line micro-solid phase preconcentration for Pb2+ determination by FAAS
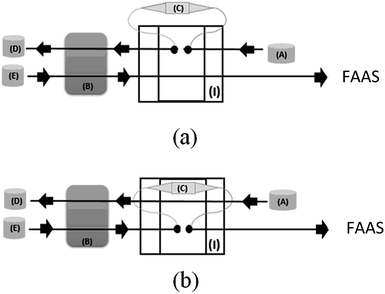
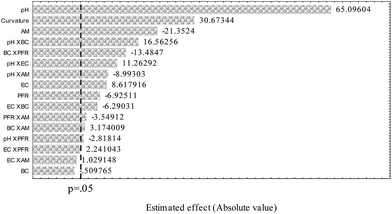
The diagram of micro-solid phase preconcentration system on-line coupled to FAAS is shown in Fig. 1.In order to examine the importance of some factors that usually play an important role on the micro-solid phase preconcentration, such as pH, buffer concentration, adsorbent mass, flow rate preconcentration and eluent concentration, a 25−1 fractional factorial design containing central point was employed. For this study, 20.0 mL of Pb2+ solution at 200 μg L−1 concentration were percolated through minicolumn. The factors and their levels investigated are shown in Table 1 and the experiments were conducted randomly in duplicate to avoid possible systematic errors. The data obtained were analyzed in the STATISTICA 7.0 software package and the significance of each factor was checked by means of the Pareto chart. The final optimization of those factors statistically significant in the preconcentration system was than optimized by means of Doehlert matrix.
On-line micro-solid phase preconcentration for Pb2+ determination by FAAS
Under optimized condition, the on-line preconcentration system was performed percolating 20.0 mL of sample previously buffered with 0.048 mol L−1 sodium acetate (pH 5.70), through a minicolumn packed with 30 mg of IIP/PAN at a flow rate of 4.0 mL min−1. Afterwards, Pb2+ ions adsorbed on the polymer was eluted with 1.0 mol L−1 HCl solution and transported toward the FAAS detector.Sample pretreatment
Water samples including tap, mineral, lake, synthetic seawater23 and serum physiologic (NaCl, 0.9% m/v) were analyzed in order to assess the applicability of the proposed method in real samples using external calibration. Tap water was collected at the Campus of the State University of Londrina (Londrina, Brazil), whereas the mineral water and serum physiologic were acquired from supermarket and drugstore local, respectively. The lake water sample was collected from Igapó Lake, located in the city of Londrina, Brazil, which was acidified in situ with some drops of concentrated HNO3, filtrated under vacuum using 0.45 μm cellulose acetate membranes before use and stored in polyethylene bottles. All the water samples were spiked with 8 μg L−1 of Pb2+ ions. P powder chocolate (3 brands) and medicinal herb (Ginkgo biloba) samples were acid digested using a microwave oven. For this task, 700 mg of each powdered samples and 500 mg of Ginkgo biloba were kept overnight with 10.0 mL of concentrated HNO3 and 4.0 mL of H2O2 (30%, v/v) and subsequently subjected to the acid digestion procedure under a temperature program as previously reported by a research group.24 After decomposition step, the solutions were heated on a hot plate almost to dryness and the residues previously cooled at room temperature were dissolved in ultrapure water and transferred to volumetric flask of 100 mL, adjusting the pH to 5.70 with a solution of ammonium hydroxide. In addition, analytical blanks were used to confirm the absence of interference in the analytical procedure.Results and discussion
Characterization of polymers by FT-IR and nitrogen adsorption/desorption measurements
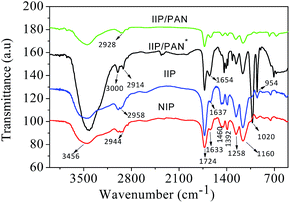
The FT-IR spectra of IIP/PAN, IIP/PAN unleached, IIP and NIP are shown in Fig. 2. It can be observed in all polymers an intense band in the range of 3456 cm−1, which is attributed to O–H stretch from segments of the monomer of methacrylic acid (MAA) and adsorbed water molecule whereas signals at 2914–3000 cm−1 are attributed to the C–H asymmetric stretching from CH2 and CH3 bonds of the polymer chain and EGDMA.25,26 The intense band present in all polymers at 1724 cm−1 is assigned to stretching C![[double bond, length as m-dash]](https://www.rsc.org/images/entities/char_e001.gif) O of the functional monomer (MAA), while the band of low intensity in the range of 1633–1654 cm−1 can be attributed to vinyl groups (–C
O of the functional monomer (MAA), while the band of low intensity in the range of 1633–1654 cm−1 can be attributed to vinyl groups (–C![[double bond, length as m-dash]](https://www.rsc.org/images/entities/char_e001.gif) C–) from MAA unreacted, deformation OH groups of adsorbed water molecules and possible overlap with stretching N
C–) from MAA unreacted, deformation OH groups of adsorbed water molecules and possible overlap with stretching N![[double bond, length as m-dash]](https://www.rsc.org/images/entities/char_e001.gif) N of the azo group of the PAN ligand.27 The bands of average intensity at 1392 and 1460 cm−1 is assigned to angular out of plane deformation of the methyl groups in the polymeric chain, whereas the stretching vibration of O–C(O)–C from EGDMA can be observed at 1258 and 1160 cm−1.28 In addition, an intense peak at 1020 and 954 cm−1 in the IIP/PAN unleached can be attributed to bending of hydroxyl groups from the PAN ligand and the residue MAA and the presence of C–O bonds, respectively.29,30 The absence of these bands in the spectra of IIP/PAN indicates that lead ions have been coordinated with non-bonding electron pairs of the functional groups containing nitrogen and oxygen from ligand. Besides, these observations can be a strong evidence for the presence and appropriate interaction of the selective recognition sites in the IIP particles created during imprinting process.
N of the azo group of the PAN ligand.27 The bands of average intensity at 1392 and 1460 cm−1 is assigned to angular out of plane deformation of the methyl groups in the polymeric chain, whereas the stretching vibration of O–C(O)–C from EGDMA can be observed at 1258 and 1160 cm−1.28 In addition, an intense peak at 1020 and 954 cm−1 in the IIP/PAN unleached can be attributed to bending of hydroxyl groups from the PAN ligand and the residue MAA and the presence of C–O bonds, respectively.29,30 The absence of these bands in the spectra of IIP/PAN indicates that lead ions have been coordinated with non-bonding electron pairs of the functional groups containing nitrogen and oxygen from ligand. Besides, these observations can be a strong evidence for the presence and appropriate interaction of the selective recognition sites in the IIP particles created during imprinting process.
Fig. 3 depicts the scanning electron micrographs of IIP/PAN, IIP and NIP. It can be observed that, in general, the particles of IIP are more spherical with lower degree of aggregation when compared to IIP/PAN and NIP. The absence of PAN in the IIP synthesis may explain this outcome. Therefore, it seems that the solubility of complex Pb–MAA becomes lower in the porogenic solvent (DMSO) in the absence of PAN, and as consequence, making the removal of solvent from the interstices of polymer easier during polymeric synthesis.31 Such assumption is further corroborated by textural data shown in Table 2.
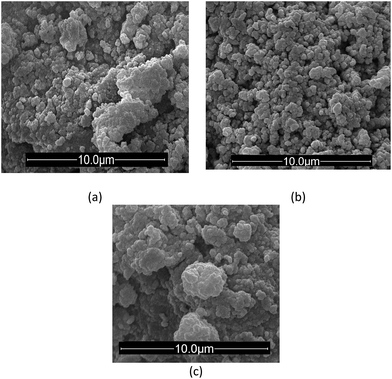 | ||
Fig. 3 Scanning electron micrographs of IIP/PAN (a), IIP (b) and NIP (c). Magnification of 30![[thin space (1/6-em)]](https://www.rsc.org/images/entities/char_2009.gif) 000 times. 000 times. | ||
| Polymers | Surface area (m2 g−1) | Pore volume (cm3 g−1) | Average pore diameter (nm) |
|---|---|---|---|
| IIP/PAN | 1.77 | 0.009 | 18.82 |
| IIP | 22.48 | 0.126 | 22.44 |
| NIP | 1.15 | 0.005 | 17.16 |
The results of surface area, pores volume and pores diameter of polymers are shown in Table 2. According to IUPAC definition, all the materials are considered mesoporous (2–50 nm).32 As observed from Table 2, the polymers synthetized in the presence of PAN, i.e., IIP/PAN and NIP showed the lowest porosity, thus suggesting the PAN molecule can be loaded inside pores of material and, as consequence, decreasing the pore volume and surface area. It worth emphasize that although the IIP/PAN has presented lower surface area (1.77 m2 g−1) and pore volume (0.009 cm3 g−1), it presented higher adsorptive capacity and selectivity towards Pb2+ when compared to IIP and NIP as will be further demonstrated. These results makes possible to infer that imprinting sites created during polymer synthesis together the presence of PAN shows synergic effect on the performance of polymer, while no dependence on the textural data was observed.
Adsorption kinetics
The equilibrium time for Pb2+ obtained in the IIP/PAN, IIP and NIP was found to be 100 s. This outcome indicates that the polymers can be successfully used as adsorbent materials in flow analysis due to high mass transfer kinetic. Additionally, the kinetic study allows obtaining insight into adsorption process with more details. Thus, the behavior of adsorption kinetic of Pb2+ on the polymers was evaluated by the linear kinetic models, pseudo-first-order, pseudo-second-order, Elovich and intraparticle diffusion33 and the obtained results are described in Table 3. As one can see, the pseudo-second-order model provided the best fit to the experimental data for all polymers. The adsorbed amount of Pb2+ on the IIP/PAN, IIP and NIP were found to be 3.84, 3.70 and 2.92 mg g−1, respectively, which are very similar to the ones values forecasted by the pseudo-second-order model, 3.72, 3.60 and 2.95 mg g−1, respectively. This model presumes that the adsorption of Pb2+ ions on the surface of the polymers occurs at energetically heterogeneous binding sites, in this case, assigned possibly to the carboxylic group of methacrylic acid monomer and atoms of nitrogen or oxygen present in the 1-(2-pyridylazo)-2-naphthol and assumes that the adsorption site occupancy rate is proportional to the square of the number of unoccupied sites. In addition, the rate-limiting step is chemisorption involving sharing or exchange of electrons between polymers and metal.33,34 It should be noted that Elovich model also presented a good fit to the experimental data, which corroborates the pseudo-second-order model and confirms the existence of a surface energetically heterogeneous.| Pseudo first-order | Pseudo second-order | |||||
|---|---|---|---|---|---|---|
| Materials | k1 | Qe (mg g−1) | R2 | k2 | Qe (mg g−1) | R2 |
| a k1 = pseudo first-order adsorption rate constant (min−1); k2 = pseudo-second-order adsorption rate constant (g mg−1 min−1); β is the extent of surface coverage and activation energy for chemisorption (g mg−1), α is the initial adsorption rate constant (min−1 mg g−1), kid is the internal diffusion coefficient (mg g−1 min−1/2) and C is the boundary layer thickness (mg g−1). | ||||||
| IIP/PAN | −1.19 | 0.76 | 0.64 | 12.80 | 3.72 | 0.99 |
| IIP | −0.87 | 0.72 | 0.60 | 9.40 | 3.60 | 0.99 |
| NIP | −0.20 | 0.21 | 0.00 | 26.60 | 2.95 | 0.99 |
The intraparticle diffusion model also can to be used to explain the transport of Pb2+ ions towards active sites of the polymers. As can be observed in Table 3, only the first linear segment presented a reasonable fit to experimental data, with a determination coefficient varying from 0.92 to 0.97 for the three polymers. Additionally, as the linear coefficient from the intraparticle diffusion model (Ci), i.e., the boundary layer thickness (mg g−1) is different from zero, it can be infer that the adsorption process occurred rather in the external surface of adsorbent governed by mass transfer in the external liquid film, which indicates that binding sites are located outside pores of polymer.
Adsorption isotherms
Fig. 4 depicts adsorption isotherm built under equilibrium condition of Pb2+ on the polymers. In order to evaluate the maximum adsorption capacity of IIP/PAN, IIP and NIP the experimental data were compared to theoretical non-linear adsorption isotherm models of Langmuir, Freundlich, Langmuir–Freundlich for one site (L–F 1) and Langmuir–Freundlich for two sites (L–F 2).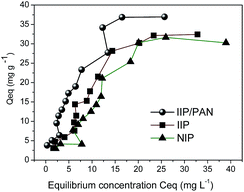 | ||
| Fig. 4 Adsorption isotherms of Pb(II) on the polymers IIP/PAN, IIP and NIP; pH 5.70 (acetic acid/sodium acetate 0.048 mol L−1). | ||
As can be seen in Table 4, the Langmuir and Freundlich models presented R2 values ranging from 0.83 to 0.95, suggesting that the adsorption of Pb2+ ions may follows the assumption of both models. This outcome can be confirmed bearing in mind the best fit of experimental data to the hybrid Langmuir–Freundlich models for one and two sites, with R2 values varying from 0.941 to 0.989, in which suggest that adsorption of Pb2+ may takes place in high and low-affinity sites.35
| Polymers | |||
|---|---|---|---|
| IIP/PAN | IIP | NIP | |
| a In the Langmuir, Freundlich and Langmuir–Freundlich equations: k (Langmuir), k1,2 (Langmuir–Freundlich) (L g−1), k (Freundlich) (mg g−1) (L g−1)—adsorbate–adsorbent affinities, b, b1,2—maximum adsorption capacities (mg g−1), and n, n1,2—intensities or degrees of favorability for adsorption. | |||
Non-linear Langmuir:  |
|||
| k1 | 0.080 | 0.036 | 0.025 |
| b1 | 59.120 | 66.690 | 71.760 |
| R2 | 0.953 | 0.929 | 0.873 |
![[thin space (1/6-em)]](https://www.rsc.org/images/entities/char_2009.gif) |
|||
| Non-linear Freundlich: Qeq = kFCeq1/n | |||
| k1 | 6.474 | 3.579 | 2.660 |
| n1 | 0.578 | 0.679 | 0.720 |
| R2 | 0.922 | 0.895 | 0.834 |
![[thin space (1/6-em)]](https://www.rsc.org/images/entities/char_2009.gif) |
|||
Langmuir–Freundlich for one site (L–F 1):  |
|||
| k1 | 0.137 | 0.104 | 0.087 |
| b1 | 46.740 | 36.620 | 33.940 |
| n1 | 1.289 | 2.055 | 2.604 |
| R2 | 0.958 | 0.962 | 0.941 |
![[thin space (1/6-em)]](https://www.rsc.org/images/entities/char_2009.gif) |
|||
Langmuir–Freundlich for two sites (L–F 2):  |
|||
| k1 | 26.320 | 0.189 | 0.081 |
| k2 | 0.136 | 0.093 | 0.416 |
| b1 | 5.012 | 16.840 | 24.320 |
| b2 | 36.40 | 17.40 | 6.604 |
| n1 | 0.450 | 1.219 | 5.061 |
| n2 | 1.825 | 5.374 | 2.822 |
| R2 | 0.967 | 0.989 | 0.966 |
The L–F 1 model describes both the Langmuir and Freundlich model and it allows one evaluate the presence of heterogeneous and homogeneous binding sites according to the degree of heterogeneity of the site (n). However, although L–F 1 has shown good fit to the experimental data, it fails in describing the availability of more than one type of adsorption site with different affinities towards adsorbate and their contribution to the process.26 On the other hand, the L–F 2 model admits the presence of heterogeneous solid surface and describes adsorption binding interactions among adsorbing compounds considering adsorption sites with different affinities. According to these statements, for the IIP/PAN material, it can be observed, according to L–F 2 model that the highest adsorption of Pb2+ (b2 = 36.4 mg g−1) occurred in lower-affinity sites (k2 = 0.136 L g−1), most likely attributed to carboxyl groups from methacrylic acid, whereas a lower adsorptive capacity (b1 = 5.01 mg g−1) took place in higher-affinity binding sites (k1 = 26.3 L g−1), which can be attributed to chelating PAN in the polymer. These findings corroborate the pseudo-second order model, from kinetic data, confirming the existence of higher-affinity and lower-affinity adsorption sites for the IIP/PAN. The L–F 1 model in turn, as already mentioned, does not distinguish the affinities of the sites and assumes that the maximum adsorptive capacity (b1 = 46.74 mg g−1) occurred only in lower-affinity sites (k1 = 0.137 L g−1).
For the IIP material, it can be seen from the L–F 2 model that similar adsorbed amounts (b1 = 16.84 mg g−1 and b2 = 17.40 mg g−1) occurred at sites with slightly different affinities (k1 = 0.189 L g−1 and k2 = 0.093 L g−1). Compared to the L–F 1 model, the adsorbed amount (b1 = 36.62 mg g−1) also occurs at lower-affinity sites (k1 = 0.104 L g−1), suggesting that the two sites of interaction can be attributed to the chemical imprinting sites formed by methacrylic acid and those non imprinted sites.
The adsorptive behavior of NIP was somewhat similar to IIP-PAN and IIP. In this case, the L–F 2 model was also able to predict the existence of two sites with different affinities. As the NIP has no selective binding sites assigned to chemical imprinting, but contains the chelating PAN, it can be inferred that the higher and lower-affinity sites are assigned to the PAN and carboxyl from methacrylic acid or to carbonyl group of EGDMA, respectively. Additionally, one should note that k2 value (0.416 L g−1) attributed to PAN in the NIP was found to be substantially lower than the one k1 (26.32 L g−1) achieved to PAN in the IIP, suggesting once again a synergic effect between chelating PAN and the chemical imprinting process for improving the adsorbate–adsorbent affinity at the polymer binding sites.
The maximum adsorption capacities (sum b1 + b2) of Pb2+ ions were found to be 41.4 mg g−1 for IIP/PAN, 34.2 mg g−1 for IIP and 30.09 mg g−1 for NIP. In spite of shows low porosity, the IIP/PAN demonstrated the higher adsorption capacity regarding the other ones polymers, which in turn allowed us satisfactory infer that PAN and carboxyl from methacrylic acid from the imprinting process were responsible for the greatest adsorption of Pb2+.
Selective rebinding study
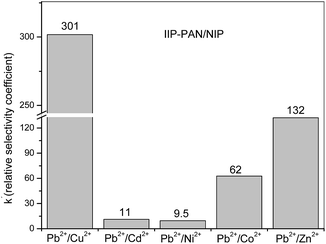
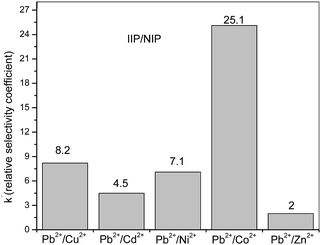
Batch rebinding studies by means of Pb2+ ions adsorption in the presence of Cu2+, Cd2+, Ni2+, Co2+ or Zn2+ were performed to assess the adsorption of template ion to the different polymers IIP/PAN, IIP and NIP. The foreign metal ions show similar ionic radius to Pb2+, likewise are divalent, are capable to form metallic complexes with PAN and carboxylic acid from monomer (MAA).36,37 It is well known that the relative selectivity coefficient (k′) is to most important parameter to prove the specific affinity of the polymer towards template ion.38 The higher the k′ value, the greater the selectivity of imprinted polymer. From the Kd (distribution coefficient) and the selectivity coefficients (k) (data not shown), the k′ values were determine as the ratio kIIP–PAN/NIP and kIIP/NIP, whose values are depicted in the Fig. 5 and 6. Comparing the k′ values for the IIP-PAN/NIP with IIP/NIP, it can be observed large k′ values for the imprinted adsorbent containing the chelating PAN. This outcome reveals high adsorption and high selectivity for Pb2+ over the foreign metal ions in the IIP-PAN compared with IIP and IIP. Once again, this may be result from the imprinting effect and synergic effect with chelating PAN.Multivariate optimization of micro-solid phase preconcentration of Pb2+ on-line coupled to FAAS
Taking into account its better adsorptive and selective performance regarding the IIP and NIP, the multivariate optimization of preconcentration method was carried out by using the IIP–PAN as adsorbent. Table 5 shows the results of 25−1 fractional factorial design and the Pareto chart is shown in Fig. 7.| Runs | pH | EC | BC | PFR | AM | Absorbance | |
|---|---|---|---|---|---|---|---|
| a BC = buffer concentration; EC = eluent concentration; PFR = preconcentration flow rate; AM = adsorbent mass. Experimental condition: preconcentration of 20.0 mL of Pb2+ solution at 200 μg L−1 concentration. | |||||||
| 1 | −1 | −1 | −1 | −1 | 1 | 0.0324 | 0.0354 |
| 2 | 1 | −1 | −1 | −1 | 1 | 0.1121 | 0.1171 |
| 3 | −1 | 1 | −1 | −1 | −1 | 0.0514 | 0.0512 |
| 4 | 1 | 1 | −1 | −1 | 1 | 0.1011 | 0.1124 |
| 5 | −1 | −1 | 1 | −1 | −1 | 0.0492 | 0.0512 |
| 6 | 1 | −1 | 1 | −1 | 1 | 0.1206 | 0.1294 |
| 7 | −1 | 1 | 1 | −1 | 1 | 0.0256 | 0.0311 |
| 8 | 1 | 1 | 1 | −1 | −1 | 0.1699 | 0.1710 |
| 9 | −1 | −1 | −1 | 1 | −1 | 0.0637 | 0.0657 |
| 10 | 1 | −1 | −1 | 1 | 1 | 0.0705 | 0.0728 |
| 11 | −1 | 1 | −1 | 1 | 1 | 0.0450 | 0.0501 |
| 12 | 1 | 1 | −1 | 1 | −1 | 0.1533 | 0.1602 |
| 13 | −1 | −1 | 1 | 1 | 1 | 0.0106 | 0.0117 |
| 14 | 1 | −1 | 1 | 1 | −1 | 0.1263 | 0.1308 |
| 15 | −1 | 1 | 1 | 1 | −1 | 0.0182 | 0.0198 |
| 16 | 1 | 1 | 1 | 1 | 1 | 0.1056 | 0.1128 |
| 17 | 0 | 0 | 0 | 0 | 0 | 0.1602 | 0.1653 |
As can be observed from the Pareto chart, all the studied factors exert influence on the preconcentration method, except the buffer concentration; however most of two-order interactions were statistically significant. The sample pH has shown the greater influence on the system, with positive standardized effect estimated (65.09), thus indicating that higher Pb2+ adsorption is obtained at higher pH value. At lower pH values, the adsorption decrease probably due to protonation of the selective sites of the IIP/PAN, which weaken the interaction of Pb2+ ions with nitrogen moieties and carbonyl and hydroxyl groups as well as the carboxyl group from MAA. The adsorbent mass was the second most important factor on the preconcentration system with negative standardized effect estimate (−21.35), suggesting the lower mass must be utilized in the system. This result can be rationalized bearing in mind the greater dispersion of sample zone inside the minicolumn during elution when higher mass are utilized. Thus, the lower mass (30 mg) was fixed for further studies. Regarding the eluent concentration the positive effect (standardized effect estimate of 8.61) shows that 1.5 mol L−1 gives rise to higher analytical signal. Additionally, the pH × EC interaction was found to be significant with positive effect (11.26). Therefore, it would be expect better analytical response when higher EC is used, but taking a compromise between reagent consumption and high reusability of minicolumn, 1.0 mol L−1 HCl was chosen for further experiments. It worth to mention that using 1.0 mol L−1 HCl no memory effect was observed under cycles of preconcentration and elution. A negative effect was observed for the preconcentration flow rate (PFR) (−6.93), thus suggesting a kinetic limitation of mass transport towards binding sites of IIP/PAN when higher PFR was used. The two-order interactions BCxPFR was also found to be statistically significant with negative effect. Thus, a flow rate of 4.0 mL min−1 was set for further experiments. Although the buffer concentration analyzed alone was not significant, the two-order interaction pH × BC was statistically significant, which justifies their simultaneous optimization. Therefore, a Doehlert design for two variables was carried out, whose levels and analytical response (absorbance) are shown in (Table 6).
| Assays | pH | BC (buffer concentration) (mol L−1) | Absorbance |
|---|---|---|---|
| a The first number represents the Doehlert matrix coded values, whereas the values between parentheses stand for the real values. Experimental condition: preconcentration of 20.0 mL of Pb2+ solution at 200 μg L−1 concentration at 4.0 mL min−1 flow rate and using 1.0 mol L−1 HCl as eluent. | |||
| 1 | 0 (5.25) | 0 (0.049) | 0.1998 |
| 2 | 0 (5.25) | 0 (0.049) | 0.2003 |
| 3 | 0 (5.25) | 0 (0.049) | 0.2064 |
| 4 | 1 (7.25) | 0 (0.049) | 0.1232 |
| 5 | 0.5 (6.25) | 0.866 (0.1) | 0.1556 |
| 6 | −1 (3.25) | 0 (0.049) | 0.0125 |
| 7 | −0.5 (4.25) | −0.866 (0.001) | 0.1104 |
| 8 | 0.5 (6.25) | −0.866 (0.001) | 0.1435 |
| 9 | −0.5 (4.25) | 0.866 (0.1) | 0.0369 |
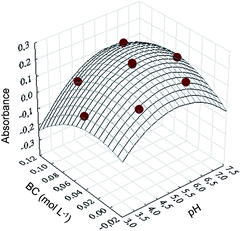
From Doehlert design the quadratic model shown in the eqn (5) was obtained and validated by means of ANOVA. The absence of lack of fit was assured by taking into account the lower MSlack of fit/MSpure error ratio (9.148) when compared to tabulated F1,2,95% (18.513) at a confidence interval of 95%.
| Abs = −0.8169 + 0.3621pH − 0.0336pH2 − 0.2684BC − 23.0892BC2 + 0.4362pH × BC | (5) |
The response surface was built (Fig. 8) using the validated quadratic model, from which the maximum points for pH and buffer concentration were found to be 5.70 and 0.048 mol L−1, respectively. These values were further used as the best condition for Pb2+ ion extraction from real samples.
Analytical features of proposed method
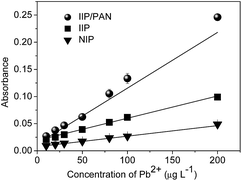
Under optimum conditions of proposed method, the IIP/PAN showed a linear calibration curve in the range 1.75 (LOQ)–200.0 μg L−1, providing the following equation: Abs = 0.0056 + 0.00116 [Pb2+, μg L−1], r = 0.990. The linear calibration built without preconcentration step was from 2500 to 10![[thin space (1/6-em)]](https://www.rsc.org/images/entities/char_2009.gif) 000 μg L−1 giving rise to linear equation: Abs = 0.0088 + 0.000036 [Pb2+, μg L−1], r = 0.994. The limits of detection and quantification, defined according to IUPAC definition and taking into account the use of 20.0 mL of sample, were found to be 0.52 μg L−1 and 1.79 μg L−1, respectively. The repeatability of the preconcentration method was assessed based on relative standard deviation (RSD) (n = 10) for solutions with concentrations of 10.0 and 150.0 μg L−1, yielding RSD values of 4.13 and 1.87%, respectively. Other efficiency parameters, such as consumption index (CI) and concentration efficiency (CE) were determined in according to Wutke and co-workers,24 were found to be 6.66 min−1 and 0.60 mL, respectively. In order to evaluate the increase in the sensitivity of the preconcentration method as a result of synergic effect between chelating PAN and the chemical imprinting process, three curves using IIP/PAN, IIP and NIP as adsorbents were built in the in the range 10.0–200.0 μg L−1 (Fig. 9).
000 μg L−1 giving rise to linear equation: Abs = 0.0088 + 0.000036 [Pb2+, μg L−1], r = 0.994. The limits of detection and quantification, defined according to IUPAC definition and taking into account the use of 20.0 mL of sample, were found to be 0.52 μg L−1 and 1.79 μg L−1, respectively. The repeatability of the preconcentration method was assessed based on relative standard deviation (RSD) (n = 10) for solutions with concentrations of 10.0 and 150.0 μg L−1, yielding RSD values of 4.13 and 1.87%, respectively. Other efficiency parameters, such as consumption index (CI) and concentration efficiency (CE) were determined in according to Wutke and co-workers,24 were found to be 6.66 min−1 and 0.60 mL, respectively. In order to evaluate the increase in the sensitivity of the preconcentration method as a result of synergic effect between chelating PAN and the chemical imprinting process, three curves using IIP/PAN, IIP and NIP as adsorbents were built in the in the range 10.0–200.0 μg L−1 (Fig. 9).
As can be seen, higher sensibility was achieved when IIP/PAN was used as adsorbent when compared to the others polymers. These results confirm that synergism effect between the chemical imprinting process and the presence of the auxiliary chelating in the IIP/PAN, also provides improvements in the sensitivity of method. The increase in the sensitivity can be expressed by the preconcentration factor (PF), which was calculated by the ratio between the angular coefficient of the curves with and without preconcentration step. Thus, PF for IIP/PAN, IIP and NIP were found to be 32.5, 12.2 and 5.8 times, respectively.
The analytical features of the proposed method were compared with other preconcentration procedures for Pb2+ ions determination by FAAS (Table 7). As can be seen, the highlight of method is the low limit of detection associated with low sample consumption.
| Solid phases | PF | PV (mL) | LD (μg L−1) | Application | Linear range (μg L−1) | Ref. |
|---|---|---|---|---|---|---|
| a PV = volume preconcentration; FP = factor preconcentration; LD = limit of detection; ND = not available; BTAC = p-cresol, 2-(2-benzothiazolylazo), APDC = pyrrolidine dithiocarbamate, HSPIMP = 3-(hydroxy-4-(3-silylpropylimino)methyl)phenol, MWCNT = carbon nanotube multiwalled. | ||||||
| XAD-16 modified with 1,10-phenanthroline | 48 | 1200 | 7.9 | Industrial water | ND | 39 |
| Functionalized silica with 3,6-dithia-1,8-octanediol | 28 | 52.8 | 1.0 | Milk | 5–20![[thin space (1/6-em)]](https://www.rsc.org/images/entities/char_2009.gif) 000 000 |
40 |
| XAD-4 | 24 | 10 | 2.92 | Waters | 20–80 | 41 |
| Graphene | 125 | 100 | 0.61 | Vegetables and waters | 10–600 | 42 |
| Bentonite | ND | 1000 | 1.6 | Wastewater and groundwater | ND | 43 |
| DMAA–AGE/IDA–silica (resin) | 10 | 100 | 3.5 | Human plasma/waters | ND | 44 |
| APDC with 1-hexyl-3-methylimidazolium as ionic liquid | 40 | 20 | 1.5 | Natural waters | ND | 45 |
| MWCNT/HSPIMP | 18 | 250 | 2.89 | Samples of leek, radish, caki and banana | 0.02–0.35 | 46 |
| Polyurethane foam modified with BTAC | 26 | 7 | 1.0 | Wine samples | 1.0–500 | 47 |
| IIP/PAN | 33 | 20 | 0.52 | Water samples, saline, Ginkgo biloba and chocolate powder | 1.79–200 | This work |
Application in real samples
In order to demonstrate the potential application of preconcentration method using IIP/PAN as adsorbent, different water and food samples were analyzed. As can be seen in Table 8, for the water and saline samples Pb2+ was not found. Therefore, known amount of Pb2+ (8.0 μg L−1) bearing in mind the maximum allowed levels established by international organizations was added to samples and the recovery values in the range 91–105%, attest the feasibility of method for Pb2+ determination in water samples interferences-free.| Samples | Pb2+ (μg L−1) | ||
|---|---|---|---|
| Amount added | Amount foundb | Recovery (%) | |
| a ND = not detected (below the limit of detection).b Results are expressed as mean value ± standard deviation based on three replicates (n = 3).c Values expressed in μg g−1. | |||
| Tap water | 0 | <LOD | — |
| 8.00 | 7.9 ± 0.3 | 99 | |
| Lake water | 0 | <LOD | — |
| 8.00 | 8.4 ± 0.2 | 105 | |
| Mineral water | 0 | <LOD | — |
| 8.00 | 8.2 ± 0.1 | 103 | |
| Synthetic seawater | 0 | <LOD | — |
| 8.00 | 7.3 ± 0.4 | 91 | |
| Serum physiologic | 0 | <LOD | — |
| 8.00 | 8.3 ± 0.8 | 104 | |
| Chocolate powderc | 0 | 1.1 ± 0.2 | — |
| 1.42 | 2.4 ± 0.1 | 90 | |
| 2.40 | 3.5 ± 0.1 | 95 | |
| Ginkgo bilobac | 0 | 1.9 ± 0.2 | — |
| 2.00 | 4.1 ± 0.2 | 105 | |
| 4.00 | 5.3 ± 0.2 | 90 | |
It should be emphasized that Pb2+ were quantified in chocolate powder and Ginkgo biloba samples, confirming the applicability of the method in complex sample submitted to acid digestion. Furthermore, the accuracy of the method was checked from the analysis of the Certified Reference Material for Trace Metals (MESS-3, marine sediment). The result obtained by the method (19.51 ± 0.42) was statistically equal to the Pb2+ concentration in the certified material (21.10 ± 0.70) at a 95% confidence interval (Student t-test) (n = 3).
Conclusions
In the present study the synthesis and application of a new ion-selective imprinted polymer based on poly(methacrylic acid) loaded with 1-(2-pyridylazo)-2-naphthol (PAN) (IIP/PAN) for Pb2+ preconcentration from different kind of water samples, chocolate powder, medicinal herb and sediment was demonstrated. From the selectivity studies, IIP/PAN showed higher selectivity towards Pb2+ regarding the other metal ions, while from adsorption isotherms data higher adsorption capacity was observed for the IIP/PAN in comparison to IIP and NIP. Moreover, adsorption isotherms fitted to the L–F 2 model allowed us to obtain insight into adsorption process with more details, i.e., the adsorption occurs in two sites with different binding energy attributed to carboxyl groups from methacrylic acid and the chelating PAN. The good analytical features of preconcentration method including low limit of detection, satisfactory preconcentration factor even using low sample volume (20.0 mL) and wide range of applicability, makes the material an exceptional adsorbent for Pb2+. IIP/PAN also has demonstrated exceptional reusability since only a minicolumn was used in overall method development and analytical application without loss of adsorption capacity. For final remarks, this study has evidenced that great advantage in using auxiliary chelating agent during polymerization of poly(methacrylic acid) for improving the analytical performance of preconcentration method.Acknowledgements
The authors would like to thank the Conselho Nacional de Desenvolvimento Científico e Tecnológico (CNPq) (Grant No. 481669/2013-2, 305552/2013-9, 472670/2012-3), Coordenação de Aperfeiçoamento de Pessoal de Nível Superior (CAPES) (25/2014), Fundação Araucária do Paraná, Secretaria da Ciência, Tecnologia e Ensino Superior do Paraná (SETI), SANEPAR, Laboratório de Espectroscopia da Central de Multiusuário da PROPPG and Instituto Nacional de Ciência e Tecnologia de Bioanalítica (INCT) (Grant No. 573672/2008-3) for their financial support and fellowships.References
- M. Soylak and Y. E. Unsal, J. AOAC Int., 2012, 95, 1183 CrossRef CAS PubMed.
- M. K. Bojdi, M. H. Mashhadizadeh, M. Behbahani, A. Farahani, S. S. H. Davarani and A. Bagheri, Electrochim. Acta, 2014, 136, 59 CrossRef CAS.
- C. R. T. Tarley, M. Z. Corazza, B. F. Somera and M. G. Segatelli, J. Colloid Interface Sci., 2015, 450, 254 CrossRef CAS PubMed.
- M. Behbahani, A. Bagheri, M. Taghizadeh, M. Salarian, O. Sadeghi, L. Adlnasab and K. Jalali, Food Chem., 2013, 138, 2050 CrossRef CAS PubMed.
- H. Ebrahimzadeh and M. Behbahani, Arabian J. Chem., 2017, 10, S2499 CrossRef CAS.
- T. Alizadeh and S. Amjadi, J. Hazard. Mater., 2011, 190, 451 CrossRef CAS PubMed.
- World Health Organization, http://www.who.int/water_sanitation_health/dwq/2edaddvol2a.pdf, accessed December 2016.
- National Health Surveillance Agency, http://portal.anvisa.gov.br/documents/33916/393845/RDC%2Bn%<?pdb_no 25C2?><?pdb_no 25C2?>25C2<?pdb END?><?pdb END?>%<?pdb_no 25BA?><?pdb_no 25BA?>25BA<?pdb END?><?pdb END?>%<?pdb_no 2B42?><?pdb_no 2B42?>2B42<?pdb END?><?pdb<?db_id PDB?> END?>_2013_final.pdf/eec629cf-8d17-422b-a362-366b275c1a00, accessed December 2016.
- United States Environmental Protection Agency, http://water.epa.gov/drink/contaminants/index.cfm#List, accessed November 2016.
- Food and Agriculture Organization of the United Nations, http://apps.who.int/iris/bitstream/10665/39108/1/WHO_TRS_759.pdf, accessed December 2016.
- U. Divrikli, A. A. Kartal, M. Soylak and L. Elci, J. Hazard. Mater., 2007, 145, 459 CrossRef CAS PubMed.
- M. Soylak, I. Narin, M. A. Bezerra and S. L. C. Ferreira, Talanta, 2005, 65, 895 CrossRef CAS PubMed.
- J. Otero-Romaní, A. Moreda-Pineiro, P. Bermejo-Barrera and A. Martin-Esteban, Talanta, 2009, 79, 723 CrossRef PubMed.
- F. Shakerian, K.-H. Kim, E. Kwon, J. E. Szulejko, P. Kumar, S. Dadfarnia and A. M. H. Shabani, Trends Anal. Chem., 2016, 83, 55 CrossRef CAS.
- Y.-K. Tsoi, Y.-M. Ho and K. S.-Y. Leung, Talanta, 2012, 89, 162 CrossRef CAS PubMed.
- M. Behbahani, P. G. Hassanlou, M. M. Amini, H. R. Moazami, H. S. Adandansari, A. Bagheri and S. H. Zadeh, Food Anal. Methods, 2015, 8, 558 CrossRef.
- L. Wu and Y. Li, Anal. Chim. Acta, 2003, 482, 175 CrossRef CAS.
- T. P. Rao, S. Daniel and J. M. Gladis, Anal. Chim. Acta, 2003, 488, 173 CrossRef.
- Y. Liu, X. Chang, D. Yang, Y. Guo and S. Meng, Anal. Chim. Acta, 2005, 538, 85 CrossRef CAS.
- M. Saraji and Y. Yousef, J. Hazard. Mater., 2009, 167, 1152 CrossRef CAS PubMed.
- M. Khajeh, Z. S. Heidari and E. Sanchooli, Chem. Eng. J., 2011, 166, 1158 CrossRef CAS.
- C. R. T. Tarley, G. Silveira, W. N. L. dos Santos, G. D. Matos, E. G. P. da Silva, M. A. Bezerra, M. Miro and S. L. C. Ferreira, Microchem. J., 2009, 1, 58 CrossRef.
- M. Z. Corazza, B. F. Somera, M. G. Segatelli and C. R. T. Tarley, J. Hazard. Mater., 2012, 243, 326 CrossRef CAS PubMed.
- N. B. Wutke, K. M. Diniz, M. Z. Corazza, F. M. de Oliveira, E. S. Ribeiro, B. T. da Fonseca, M. G. Segatelli and C. R. T. Tarley, Anal. Lett., 2016, 49, 723 CrossRef CAS.
- Y. K. Lv, L. M. Wang, L. Yang, C. X. Zhao and H. W. Sun, J. Chromatogr. A, 2012, 1227, 48 CrossRef CAS PubMed.
- A. Wong, F. M. de Oliveira, C. R. T. Tarley and M. D. P. T. Sotomayor, React. Funct. Polym., 2016, 100, 26 CrossRef CAS.
- S. Tokalioglum, H. Buyukbas and S. Kartal, J. Braz. Chem. Soc., 2006, 17, 98 CrossRef.
- B. A. Shah, A. V. Shah and R. V. Tailor, J. Serb. Chem. Soc., 2011, 76, 903 CrossRef CAS.
- M. A. Moharram, S. M. Rabie and H. M. El-Gendy, J. Appl. Polym. Sci., 2002, 85, 1619 CrossRef CAS.
- L. Cui, J. Jia, Y. Cuo, Y. Liu and P. Zhu, Carbohydr. Polym., 2014, 99, 31 CrossRef CAS PubMed.
- F. M. Oliveira, M. G. Segatelli and C. R. T. Tarley, Anal. Methods, 2016, 8, 656 RSC.
- P. A. G. Comarck and A. Z. Elorza, J. Chromatogr. B: Anal. Technol. Biomed. Life Sci., 2004, 804, 173 CrossRef PubMed.
- K. M. Diniz, M. G. Segatelli and C. R. T. Tarley, React. Funct. Polym., 2013, 73, 838 CrossRef CAS.
- R. Rakhshaee, M. Khosravi and M. T. Ganji, J. Hazard. Mater., 2006, 134, 120 CrossRef CAS PubMed.
- T. O. Germiniano, M. Z. Corazza, M. G. Segatelli, E. S. Ribeiro, M. J. S. Yabe, E. Galunin and C. R. T. Tarley, React. Funct. Polym., 2014, 82, 72 CrossRef CAS.
- O. P. Kalyakina, O. N. Kononova, S. V. Kachin and A. G. Kholmogorov, Bull. Korean Chem. Soc., 2003, 24, 73 Search PubMed.
- G. S. Azhgozhinova, O. Guven, N. Pekel, A. V. Dubolazov, G. A. Mun and Z. S. Nurkeeva, J. Colloid Interface Sci., 2004, 278, 155 CrossRef CAS PubMed.
- L. D. Marestoni, M. D. T. Sotomayor, M. G. Segatelli, L. R. Sartori and C. R. T. Tarley, Quim. Nova, 2013, 36, 1194 CrossRef CAS.
- N. Sharma, P. Garg and R. Saxena, Int. J. Eng. Sci. Res. Technol., 2016, 3, 72 Search PubMed.
- P. A. B. Silva, G. C. S. Souza, D. M. S. Leotério, M. F. Belian, W. E. Silva, A. P. S. Paim and A. F. Lavorante, J. Food Compos. Anal., 2015, 40, 177 CrossRef.
- C. Karadas and D. Kara, J. Food Compos. Anal., 2013, 32, 90 CrossRef CAS.
- Y. Wang, S. Gao, X. Zang, J. Li and J. Ma, Anal. Chim. Acta, 2012, 716, 112 CrossRef CAS PubMed.
- S. Gulay, Int. J. Res. Chem. Environ., 2014, 4, 109 Search PubMed.
- H. A. Panahi, J. Morshedian, N. Mehmandost, E. Moniri and Y. I. Galaev, J. Chromatogr. A, 2010, 1217, 5165 CrossRef PubMed.
- M. Soylak and E. Yilmaz, Desalination, 2011, 275, 297–301 CrossRef CAS.
- M. Ghaedi, P. Mokhtari, M. Montazerozohori, A. Asghari and M. Soylak, J. Ind. Eng. Chem., 2014, 20, 638–643 CrossRef CAS.
- A. V. Lemos, M. Guardia and L. C. S. Ferreira, Talanta, 2002, 58, 475–480 CrossRef PubMed.
| This journal is © The Royal Society of Chemistry 2017 |

