 Open Access Article
Creative Commons Attribution 3.0 Unported Licence
Interaction rule and mechanism of perfluoroalkyl sulfonates containing different carbon chains with human serum albumin†
Yang Liua,
Zhaozhen Caob,
Wansong Zong*c and
Rutao Liu *a
*a
aSchool of Environmental Science and Engineering, Shandong University, China–America CRC for Environment & Health, 27# Shanda South Road, Shandong Province, Jinan 250100, P. R. China. E-mail: rutaoliu@sdu.edu.cn; Fax: +86-531-88364868; Tel: +86-531-88364868
bSchool of Chemistry and Chemical Engineering, Shandong University, Jinan, 250100, Shandong Province, P. R. China
cCollege of Population, Resources and Environment, Shandong Normal University, 88# East Wenhua Road, Jinan 250014, P. R. China
First published on 9th May 2017
Abstract
In this study, the toxic mechanism and effects of perfluorooctane sulfonate (PFOS), perfluorohexane sulfonate (PFHS), and perfluorobutane sulfonate (PFBS) were investigated via spectroscopy, molecular modeling, and calorimetry techniques. Results showed that all three perfluoroalkyl sulfonates (PFASs) bound to human serum albumin (HSA) mainly through electrostatic forces and hydrogen bonds. The backbone and secondary structure of HSA did not significantly change after exposure to PFASs. It may be proposed that the binding changed the local structure around the active site and affected the esterase activity of HSA. Compared with the control group, the inhibited esterase activity of HSA decreased to 28.6%, 43.2%, and 54.4% under the exposure of PFOS, PFHS, and PFBS at 1.3 × 10⁻⁴ mol L−1, respectively. The ITC result reflected that the binding ability increased after lengthening of the carbon chain, which also explained the decreased esterase activity with the increased lengthening of carbon chain. The fluorescence spectra also indicated that the influence on the microenvironment of HSA decreased with the shortening of the carbon chain. This study provided evidence regarding the interaction mechanism and toxicity of PFASs towards HSA in vitro.
1. Introduction
For several decades, persistent organic pollutants (POPs) have attracted great public concern due to their adverse effects on human health and environment. Perfluorinated compounds (PFCs), which are both hydrophobic and lipophobic, are stabilized by the strong covalent bond between carbon and fluorine.1 PFCs demonstrate some useful properties such as high surface activity and heat and acid resistance. Therefore, PFCs have been widely used in industry and consumer products. However, these properties also enable some PFCs to resist environmental and biological breakdown.2,3 Hence, PFCs have become a new type of POPs.4 As one of the most widely used PFCs, perfluorooctane sulfonate (PFOS) (Fig. S1†) has been used as a surfactant in detergents, surface treatment coating in textiles and leatherwares, food contact papers, and so on because of its anti-wetting, low volatility, and surfactant properties.5,6 The total commercial production of PFOS chemicals was estimated to be about 100![[thin space (1/6-em)]](https://www.rsc.org/images/entities/char_2009.gif) 000 t from 1970 to 2002.7 Since 2003, the main producer 3M no longer manufactures PFOS chemicals. Due to its biopersistence and bioaccumulation, PFOS has been ubiquitously found even in the Arctic and detected in humans and wildlife.8,9 In recent years, due to the environmental persistence and potential toxicity, PFOS has attracted extensive attention in living organisms including human beings.10,11 Unlike other POPs, PFOS mainly distributes in the blood and liver and binds to proteins.9,12 According to previous reports, the concentration of PFOS in serum ranges from 4.1 μg L−1 to 1656.0 μg L−1 with a geometric average of 34.9 μg L−1 in Americans.13 In nine cities of China, in 85 samples of whole blood, PFOS was the predominant compound amongst the 10 measured PFCs. The maximum concentration of PFOS was measured to be 79.2 μg L−1 in the samples obtained from Shenyang and the minimum concentration was found to be 3.72 μg L−1 in the samples obtained from Jintan.14 In Uyghurs in the Sinkiang-Uighur Autonomous Region of China, amongst 110 blood specimens, PFOS was detected in 102 samples and its concentration ranged from 0.01 to 22.63 μg L−1 with a median of 1.93 μg L−1.15 Since the use of PFOS has been banned, some short-chain PFCs such as perfluorohexane sulfonate (PFHS) and perfluorobutane sulfonate (PFBS) (Fig. S1†) have been widely used instead of PFOS.16
000 t from 1970 to 2002.7 Since 2003, the main producer 3M no longer manufactures PFOS chemicals. Due to its biopersistence and bioaccumulation, PFOS has been ubiquitously found even in the Arctic and detected in humans and wildlife.8,9 In recent years, due to the environmental persistence and potential toxicity, PFOS has attracted extensive attention in living organisms including human beings.10,11 Unlike other POPs, PFOS mainly distributes in the blood and liver and binds to proteins.9,12 According to previous reports, the concentration of PFOS in serum ranges from 4.1 μg L−1 to 1656.0 μg L−1 with a geometric average of 34.9 μg L−1 in Americans.13 In nine cities of China, in 85 samples of whole blood, PFOS was the predominant compound amongst the 10 measured PFCs. The maximum concentration of PFOS was measured to be 79.2 μg L−1 in the samples obtained from Shenyang and the minimum concentration was found to be 3.72 μg L−1 in the samples obtained from Jintan.14 In Uyghurs in the Sinkiang-Uighur Autonomous Region of China, amongst 110 blood specimens, PFOS was detected in 102 samples and its concentration ranged from 0.01 to 22.63 μg L−1 with a median of 1.93 μg L−1.15 Since the use of PFOS has been banned, some short-chain PFCs such as perfluorohexane sulfonate (PFHS) and perfluorobutane sulfonate (PFBS) (Fig. S1†) have been widely used instead of PFOS.16
Human serum albumin (HSA) is one of the most important proteins abundant in blood plasma, which has a wide range of metabolites and high affinity for binding with drugs.17,18 HSA is composed of 585 amino acid residues via a polypeptide chain with three α-helical domains stabilized by disulfide bonds.19,20 On account of the binding capacity, HSA has been widely used in the transport of exogenous and endogenous ligands and the distribution of metabolism of the drugs.21,22 Therefore, HSA is usually used as a model protein for studies to investigate the interaction between the ligands and proteins.23–26
Former studies have simultaneously evaluated the toxicity of PFOS, PFHS, and PFBS at both animal and cell level. For Xenopus embryo, the acute embryo toxicity of PFHS and PFBS was lower than that of PFOS.27 PFOS increased the intracellular ROS production in human HepG2 cells, whereas PFHS and PFBS did not generate ROS.28 PFOS and PFHS were found to inhibit gap junctional intercellular communication (GJIC), which is the major pathway of intercellular signal transduction. However, PFBS showed no significant effect on GJIC.29 These studies reflected the increasing toxicity of perfluoroalkyl sulfonates (PFASs) with the lengthening of the carbon chain. To date, the toxicity of PFASs has only been reported in a few studies; in particular, the toxicity of PFASs with different lengths of carbon chain has rarely been reported at the molecular level.
Moreover, since PFOS mainly distributes in the blood, it may bind to HSA and influence the structure and function of HSA. As substitutes of PFOS, the toxicity of PFHS and PFBS to HSA has been rarely reported. In this study, the effects of PFASs with different chains on the structure and function of HSA were investigated by spectroscopic and calorimetric methods, as well as esterase activity assays and molecular docking calculations. This study reveals the effect of PFASs on HSA and the relationship between the conformation and function of HSA, which are helpful for understanding the bioactivities of PFASs in vitro.
2. Materials and methods
2.1. Reagents
HSA was purchased from Sigma Chemical Company, and its molecular mass is 66![[thin space (1/6-em)]](https://www.rsc.org/images/entities/char_2009.gif) 478 Da. The protein was dissolved in ultrapure water to obtain 1 × 10⁻⁵ mol L−1 and 3 × 10⁻⁵ mol L−1 stock solutions. Phosphate buffer (a mixture of NaH2PO4·2H2O and Na2HPO4·12H2O, 0.2 mol L−1) was used to maintain the pH value at 7.4. The potassium salts of PFOS, PFHS, and PFBS were purchased from Sigma Chemical Company. These were dissolved in ultrapure water to form solutions of concentration 1 × 10⁻³ mol L−1 and diluted as required. All the solutions were stored at 0–4 °C. 4-Nitrophenyl acetate was bought from Sigma Chemical Company and stored at −20 °C. The ultrapure water used in the experiments had a resistivity of 18.25 MΩ and it was used throughout the experiments. All the reagents were analytical-reagent grade.
478 Da. The protein was dissolved in ultrapure water to obtain 1 × 10⁻⁵ mol L−1 and 3 × 10⁻⁵ mol L−1 stock solutions. Phosphate buffer (a mixture of NaH2PO4·2H2O and Na2HPO4·12H2O, 0.2 mol L−1) was used to maintain the pH value at 7.4. The potassium salts of PFOS, PFHS, and PFBS were purchased from Sigma Chemical Company. These were dissolved in ultrapure water to form solutions of concentration 1 × 10⁻³ mol L−1 and diluted as required. All the solutions were stored at 0–4 °C. 4-Nitrophenyl acetate was bought from Sigma Chemical Company and stored at −20 °C. The ultrapure water used in the experiments had a resistivity of 18.25 MΩ and it was used throughout the experiments. All the reagents were analytical-reagent grade.
2.2. Apparatus and methods
The excitation wavelength of the fluorescence spectra was set at 280 nm and emission wavelength ranged from 290 to 450 nm. The voltage of the photo multiplier tube was set at 750 V. For synchronous fluorescence spectra, Δλ = 15 or 60 nm, the excitation wavelength was set at 265 or 310 nm, and the emission wavelength ranged from 250 to 350 nm. All the measurements were conducted with the increasing concentrations of PFASs at 298 K. In these experiments, the concentration of HSA was 1 × 10⁻⁶ mol L−1 and the concentration of PFASs ranged from 2 × 10⁻⁶ to 1 × 10⁻⁴ mol L−1.
The absorption spectra of the solutions were scanned from 190 to 350 nm at 298 K. For each measurement, the solution was prepared in the same way as for the fluorescence measurement, and the reference solution was prepared without HSA.
The CD spectra of HSA were obtained from 190 to 260 nm at 298 K at the scan speed at 200 nm min−1, using a 1.0 mm quartz cell. Nitrogen gas was used throughout the experiment. The phosphate buffer baseline was used to eliminate any possible interference in the CD spectra. Each CD spectrum is the average of three scans. The results were analyzed by CD Pro software (available at http://lamar.colostate.edu/%7Esreeram/CDPro/) and it was also employed to estimate the secondary structure contents of HSA from the CD spectra.30 The concentration of HSA was 1 × 10⁻⁶ mol L−1 and that of PFASs ranged from 5 × 10⁻⁶ to 1 × 10⁻⁴ mol L−1.
In this measurement, the concentration of HSA and 4-nitrophenyl acetate was controlled at 3 × 10⁻⁵ mol L−1 and 3.75 × 10⁻⁵ mol L−1, respectively. Then, 1.0 mL of HSA, 1.0 mL of phosphate buffer, and different volumes of PFASs solution were added into 10 mL colorimetrical cylinders and diluted to 10 mL. After incubating for 20 min at 298 K, the absorption spectra were obtained by mixing 1.0 mL of the prepared mixture and 2.0 mL of 4-nitrophenyl acetate in a 1 cm quartz cell.32
The esterase activity inhibition rate was calculated using the following equation:
| Inhibition (%) = Δb1/Δb0 |
The ITC experiment was conducted at 298 K. The changes in enthalpy, entropy, and Gibbs free energy were calculated to investigate the thermodynamic parameters of the interactions, binding constant, and binding stoichiometry between HSA and PFASs. HSA and different PFASs solutions were diluted with phosphate buffer. PFASs (1 × 10⁻³ mol L−1) were loaded in the syringe (40 μL), and HSA (1 × 10⁻⁵ mol L−1) was added into the sample cell with a volume of about 280 μL. The total injections of HSA was injected 14 times (the first injection was about 0.4 μL, followed by 13 injections with 3.0 μL for each) under a stirring speed of 1000 rpm. The blank experiment was carried out by titrating PFASs into the phosphate buffer solution.
3. Results and discussions
3.1. Fluorescence measurements
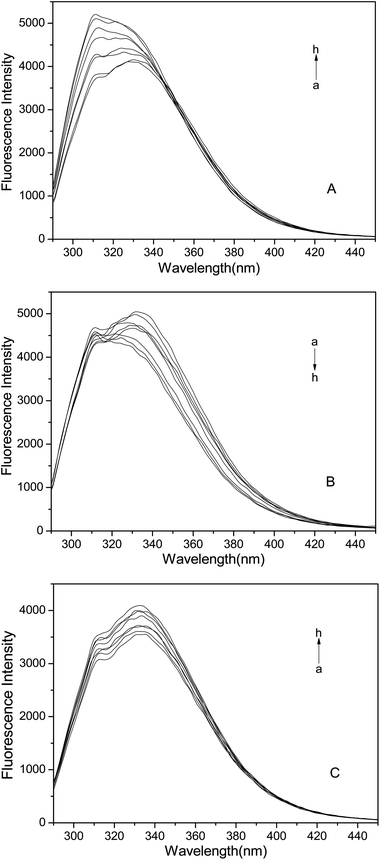
Fluorescence spectroscopy is an effective method to study the interactions between the ligands and biomacromolecules.33,34 The intrinsic fluorescence of protein is mainly from the tryptophan (Trp), tyrosine (Tyr), and phenylalanine (Phe) residues.35,36 In HSA, the emission is dominated by tryptophan.22 We investigated the changes of HSA structure by analyzing the microenvironment of the amino acids. As shown in Fig. 1, with the increase of PFAS concentrations, the fluorescence intensity of HSA regularly changed. With the addition of PFOS, the fluorescence intensity of HSA increased with an apparent blue shift. With the addition of PFHS, the intensity decreased with a visible blue shift. With the addition of PFBS, the intensity increased without a significant shift. The peak at 308 nm was due to tyrosine fluorescence.37 These indicated that the microenvironment around the fluorophores changed after PFOS or PFHS was added, whereas PFBS had only a slight impact on the microenvironment.24,38The synchronous fluorescence is an efficient way to provide information about the changes in the microenvironment of a specific residue because it can avoid some overlapping spectra and interferences.39,40 When the wavelength interval (Δλ) is set at 60 or 15 nm, synchronous fluorescence generates the characteristic information of Trp or Tyr residues.34,41 The results depicted in Fig. S2† show similar changes in the fluorescence intensity of HSA as those shown in Fig. 1, suggesting that PFOS and PFHS had effects on the microenvironment of the Trp residues. The polarity around the Trp residues was found to decrease, which left the Trp residues in a less hydrophilic environment. However, PFBS had a little effect on the microenvironment of the Trp residues. As shown in Fig. S3,† the fluorescence intensity increased in a dose-dependent manner, whereas the fluorescence peak position of HSA had no significant shift. When we considered the Tyr residues, the results indicated that all three PFASs had little effect on the microenvironment of the Tyr residues in HSA.42,43
In summary, all three PFASs impacted the microenvironment of HSA, particularly around the Trp residues. The interaction decreased the polarity around the Trp residues and left the Trp residues in a less hydrophilic environment. The influences of PFOS and PFHS on the structure of HSA were both stronger than that of PFBS.
3.2. UV-visible absorption spectra
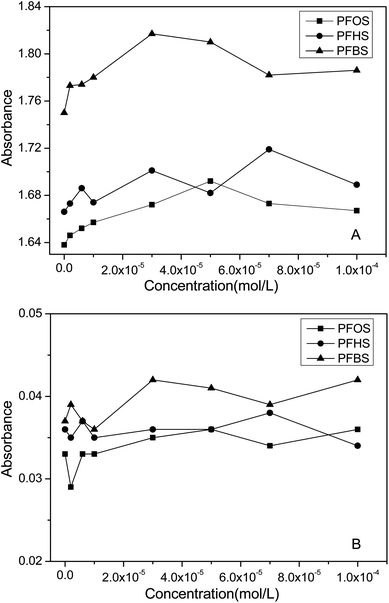
UV-visible absorption spectroscopy is widely used as a practical method to investigate the changes in protein conformation.44,45 The spectra of HSA in the presence of three PFASs are presented in Fig. S4.†The strong absorption peak at about 203 nm reflects the framework of HSA.24,46 According to Fig. S4† and the peak data plotted in Fig. 2A, the absorbance of HSA with different concentrations of PFASs slightly increased with a weak red shift. Therefore, none of the three PFASs caused apparent changes to the backbone of HSA.
The weak peak in the UV spectrum at about 279 nm reflects the aromatic amino acids.24,46 With the addition of different PFASs, the absorbance of HSA slightly changed (Fig. 2B), suggesting that all three PFASs could change the microenvironment of the aromatic amino acids of HSA, in accordance with the fluorescence results.
3.3. CD measurements
As a sensitive technique, CD spectroscopy can analyze the secondary structures of proteins. The binding of ligand to the protein can change the secondary structure of the protein. Therefore, CD spectroscopy is used to investigate the structural changes in proteins.25,47 CD spectra performed in the presence and absence of different PFASs are shown in Fig. S5.† There were two negative peaks at 208 and 218 nm, which represent the α-helix structures.48 The software CD Pro was used to estimate the secondary structure contents of HSA via analyzing the CD spectra (Tables 1 to 3).25 It proved that PFASs caused some alteration in the HSA secondary structure. With the addition of PFOS, the α-helix content of HSA slightly increased (∼1.4%), whereas the content of β-sheet showed an opposite trend (∼4.1%). However, opposite results were obtained when PFHS was added, including α-helix content decrement (∼2.5%) and β-sheet content increment (∼1.5%). The content of α-helix and β-sheet ambiguously changed after the addition of PFBS.| PFOS concentrations (mol L−1) | Secondary structure content in HSA (%) | |||
|---|---|---|---|---|
| α-Helix | β-Sheet | β-Turn | Unordered | |
| 0 | 52.7 | 9.9 | 17.0 | 21.3 |
| 5 × 10⁻⁶ | 53.9 | 6.3 | 15.2 | 24.8 |
| 1 × 10⁻⁵ | 55.4 | 6.3 | 18.1 | 22.1 |
| 5 × 10⁻⁵ | 54.5 | 6.2 | 15.7 | 25.6 |
| 1 × 10⁻⁴ | 54.1 | 5.8 | 17.4 | 25.1 |
| PFHS concentrations (mol L−1) | Secondary structure content in HSA (%) | |||
|---|---|---|---|---|
| α-Helix | β-Sheet | β-Turn | Unordered | |
| 0 | 54.7 | 5.6 | 17.3 | 25.0 |
| 5 × 10⁻⁶ | 53.0 | 6.4 | 15.5 | 25.0 |
| 1 × 10⁻⁵ | 52.5 | 6.4 | 15.6 | 25.0 |
| 5 × 10⁻⁵ | 51.7 | 8.0 | 15.7 | 25.9 |
| 1 × 10⁻⁴ | 52.2 | 7.1 | 15.9 | 26.3 |
| PFBS concentrations (mol L−1) | Secondary structure content in HSA (%) | |||
|---|---|---|---|---|
| α-Helix | β-Sheet | β-Turn | Unordered | |
| 0 | 52.9 | 6.0 | 16.2 | 26.4 |
| 5 × 10⁻⁶ | 53.8 | 6.4 | 15.6 | 25.1 |
| 1 × 10⁻⁵ | 53.7 | 3.8 | 15.4 | 27.6 |
| 5 × 10⁻⁵ | 54.1 | 6.1 | 16.5 | 25.0 |
| 1 × 10⁻⁴ | 53.4 | 6.6 | 16.3 | 25.2 |
In summary, all three PFASs had limited impact on the secondary structure of HSA, in accordance with the UV-visible absorption results.48
3.4. HSA esterase activity
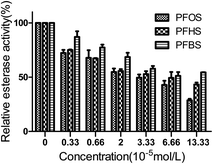
As shown in Fig. 3, with the increasing exposure to PFASs, the relative activity of HSA decreased. At low dosage, the decrease in esterase activity with the addition of PFOS was similar to that obtained with the addition of PFHS. Compared with the control group, the esterase activity of HSA was inhibited to 72.3% and 75.0% under an exposure to PFOS and PFHS at 3.3 × 10⁻⁶ mol L−1. At high concentrations, the effect of the PFASs decreased with the shortening of the carbon chain. Compared with the control group, the inhibited esterase activity of HSA decreased to 28.6%, 43.2%, and 54.4% under an exposure to PFOS, PFHS, and PFBS, respectively, at 1.3 × 10⁻⁴ mol L−1. This effect caused by PFASs could be attributed to the interaction of PFASs with the active center of HSA or to changes in the structure of HSA induced by PFASs. Based on the results of UV-visible and CD spectra, which showed no significant changes in the structure, we considered that the PFASs directly interacted with the active center of HSA.3.5. Isothermal titration calorimetry (ITC)
The ITC technique can be used to measure the thermodynamic parameters, including binding affinity (Ka), binding stoichiometry (n), enthalpy changes (ΔH), and entropy changes (ΔS), of the interaction between the ligands and macromolecules.49,50 The Gibbs free energy (ΔG) was calculated using the following equation:ΔG = ΔH − TΔS = −RT![[thin space (1/6-em)]](https://www.rsc.org/images/entities/char_2009.gif) ln ln![[thin space (1/6-em)]](https://www.rsc.org/images/entities/char_2009.gif) K K |
In the abovementioned equation, T, R, and K represent the thermodynamic temperature, the gas constant, and the binding constant, respectively.
In Fig. 4, the top panel shows a plot of heat flow against time, and the bottom panel shows the results of this system. The top result indicated that the interaction of HSA with PFASs was an exothermic reaction. The bottom result analyzed by the model of sequential binding sites (1 site) showed that enthalpy changes (ΔH) were negative and entropy changes (ΔS0) were positive, suggesting that the predominant force of this system was electrostatic interaction.51 The negative Gibbs free energy reflected that the interaction between HSA and PFASs was spontaneous.
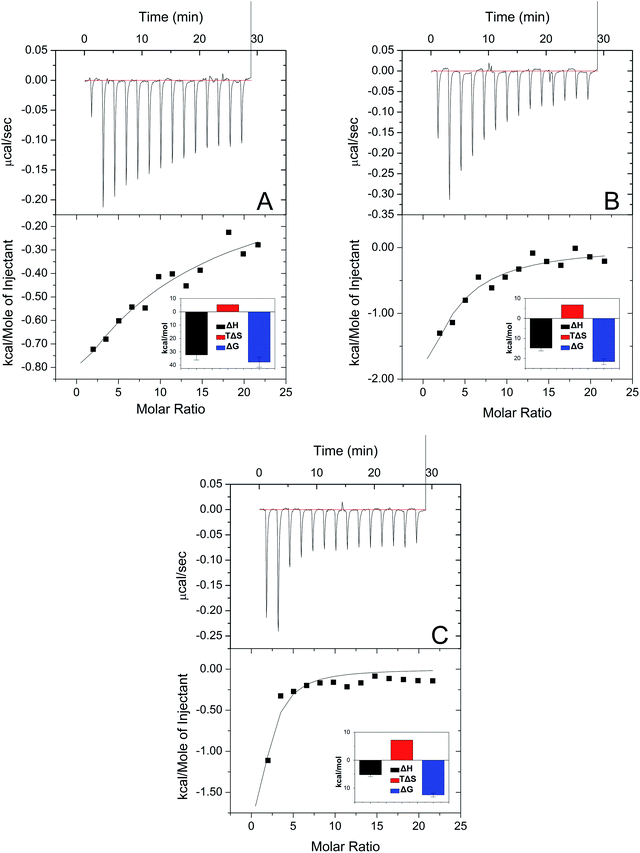 | ||
| Fig. 4 ITC results with the addition of different PFASs (A: PFOS, B: PFHS, and C: PFBS). Conditions: HSA: 1 × 10⁻⁵ mol L−1; PFASs: 1 × 10⁻³ mol L−1; pH = 7.4; and T = 298 K. | ||
As shown in Fig. 4, the Gibbs free energy increased with the shortening of the carbon chain, indicating that the binding constant (K) decreased with the shortening of the carbon chain. It suggests that the binding ability increased with the lengthening of the carbon chain.
3.6. Molecular docking simulation
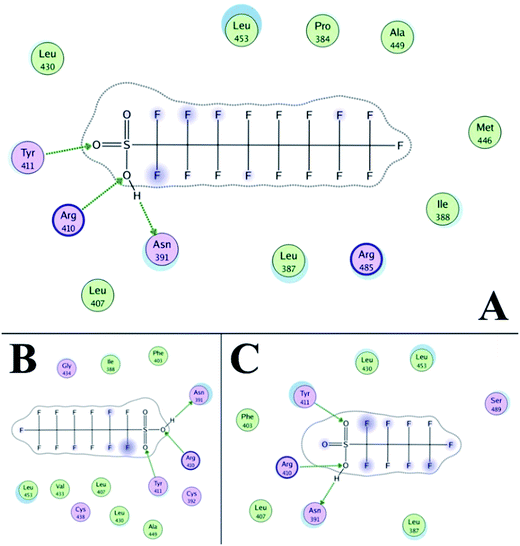
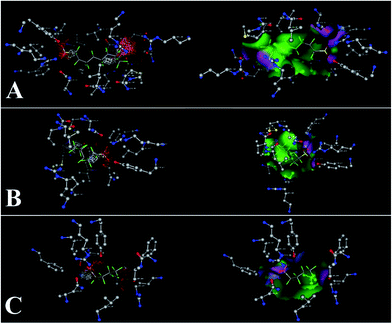
The three-dimensional structure of HSA determined by X-ray crystallography is composed of three domains I, II, and III, which endow the protein with a heart-shaped molecule form.52,53 The principal binding sites of albumin are located in the hydrophobic cavities in the subdomains IIA and IIIA.54,55 Previous studies showed that domains III carried net charges of +2e.56 Thus, negatively charged C8F17SO3− (PFOS), C6F13SO3− (PFHS), and C4F9SO3− (PFBS) may bind to HSA at the subdomain IIIA. Based on the ITC results, the predominant force of this system was electrostatic interaction. However, former research showed that other forces, such as hydrophobic interactions, existed in the binding of PFOS to HSA.57The software MOE was used to further define the binding site. The simulation box was set to domain IIIA for PFASs. Binding results after the energy optimization are shown in Fig. 5 and 6. The isoelectric point of arginine (Arg) and asparagine (Asn) is 10.76 and 5.41. As a result, at pH 7.4, Arg is positively charged and Asn is negatively charged. Thus, as shown in Fig. 5A, PFOS mainly reacted with amino acid residues via electrostatic forces and hydrogen bonds (Asn 391, Arg 410, and Tyr 411). Fig. 6A shows the electrostatic and Gaussian contact map superimposed with PFOS and HSA. The MOE results of this system basically confirmed the results obtained from the ITC experiment. Former research suggested that this region was one of binding regions to the PFOS–HSA complex.58 As lower chain homologs, we considered that the binding between HSA and PFHS or PFBS was similar to the binding of PFOS to HSA. The binding data between PFASs and main residues of HSA, through hydrogen bonds, are presented in Tables S1 to S3.† For example, in Table S1,† the H atom on the hydroxyl of PFOS binds to the carbon–oxygen double bond on Asn 391. The O atom on the hydroxyl of PFOS binds to amino on Arg 410. The O atom on the sulphonyl group of PFOS binds to hydroxyl on Tyr 411. The distance between atoms is 1.39 Å, 2.65 Å, and 2.48 Å.
Drug site II (in subdomain IIIA) of HSA is the active site for esterase activity. Both Arg 410 and Tyr 411 are in this site.31 The results of the molecular docking calculation confirmed the result of the esterase activity assay. According to the results of the UV-visible and CD spectra, the backbone and secondary structure of HSA did not significantly change. Based on the results of molecular docking, it can be suggested that binding changed the local structure around the active site, which affected the esterase activity. The ITC result reflected that the binding ability increased with the lengthening of the carbon chain. This probably led to the decrease of esterase activity with the lengthening of the carbon chain.
4. Conclusions
In this study, multiple spectroscopic methods, calorimetry technique, and esterase activity assay were used to investigate the interaction between PFASs and HSA. The ITC results indicated that all three PFASs could bind to HSA through a spontaneous exothermic process, with a predominant force of electrostatic interaction. All three PFASs changed the microenvironment of HSA; however, the influences of PFOS and PFHS were stronger. When different PFASs were added, the backbone and secondary structure of HSA did not significantly change. The molecular docking study indicated that all three PFASs bound to the Arg 410 residue in HSA, which belonged to an active center of HSA. We considered that the binding changed the local structure around the active site, which affected the esterase activity. The esterase activity of HSA decreased and the effect of PFASs decreased with the shortening of the carbon chain. The binding ability increased with the lengthening of the carbon chain, leading to the decrease of the esterase activity with the lengthening of the carbon chain. Overall, the toxicity of PFASs to HSA decreased with the shortening of the carbon chain. The effect of PFBS was found to be less than that of either PFOS or PFHS. PFBS did not bring about apparent conformational changes, but it induced functional changes in HSA. This research may provide fundamental data for the mechanism and toxicity of PFASs, which contained a different carbon chains, towards HSA.Acknowledgements
This work was co-supported by NSFC (21277081, 21477067, 21507071, and 201577083), the Cultivation Fund of the Key Scientific and Technical Innovation Project, the Research Fund for the Doctoral Program of Higher Education and Ministry of Education of China (708058, 20130131110016), the Science and Technology Development Plan of Shandong Province (2014GSF117027). All the authors thank Dr Pamela Holt and Dr Qigui Niu for editing this manuscript.References
- J. W. Sargent and R. J. Seffl, Fed. Proc., 1970, 29, 1699–1703 CAS.
- T. Wang, Y. Wang, C. Liao, Y. Cai and G. Jiang, Environ. Sci. Technol., 2009, 43, 5171–5175 CrossRef CAS PubMed.
- O. Home and D. D. L'Environnement.
- J. P. Giesy and K. Kannan, Environ. Sci. Technol., 2002, 36, 146A–152A CrossRef CAS PubMed.
- R. C. Buck, P. M. Murphy and M. Pabon, Chemistry, Properties, and Uses of Commercial Fluorinated Surfactants, Springer, Berlin Heidelberg, 2012 Search PubMed.
- T. Yan, H. Chen, X. Wang and F. Jiang, RSC Adv., 2013, 3, 22480–22489 RSC.
- A. G. Paul, K. C. Jones and A. J. Sweetman, Environ. Sci. Technol., 2009, 43, 386–392 CrossRef CAS PubMed.
- K. Kannan, J. Koistinen, K. Beckmen, T. Evans, J. F. Gorzelany, J. H. Kris, O. P. D. Jones, E. Helle, A. M. Nyman and J. P. Giesy, Environ. Sci. Technol., 2001, 35, 1593–1598 CrossRef CAS PubMed.
- C. Lau, K. Anitole, C. Hodes, D. Lai, A. Pfahles-Hutchens and J. Seed, Toxicol. Sci., 2007, 99, 366–394 CrossRef CAS PubMed.
- Y. Qian, A. Ducatman, R. Ward, S. Leonard, V. Bukowski, G. N. Lan, X. Shi, V. Vallyathan and V. Castranova, J. Toxicol. Environ. Health, Part A, 2010, 73, 819–836 CrossRef CAS PubMed.
- L. Liu, W. Liu, J. Song, H. Yu, Y. Jin, K. Oami, I. Sato, N. Saito and S. Tsuda, J. Toxicol. Sci., 2009, 34, 245 CrossRef CAS PubMed.
- G. R. C. Y. J. G. K. S. P. Lam, Progr. Chem., 2006, 18, 808–813 Search PubMed.
- G. W. Olsen, T. R. Church, J. P. Miller, J. M. Burris, K. J. Hansen, J. K. Lundberg, J. B. Armitage, R. M. Herron, Z. Medhdizadehkashi and J. B. Nobiletti, Environ. Health Perspect., 2003, 111, 1892–1901 CrossRef CAS PubMed.
- L. W. Y. Yeung, M. K. So, G. Jiang, S. Taniyasu, N. Yamashita, M. Song, Y. Wu, J. Li, J. P. Giesy and K. S. Guruge, Environ. Sci. Technol., 2006, 40, 715–720 CrossRef CAS PubMed.
- X. W. Zeng, Z. Qian, M. Vaughn, H. Xian, K. Elder, E. Rodemich, J. Bao, Y. H. Jin and G. H. Dong, Environ. Sci. Pollut. Res., 2015, 22, 4736–4746 CrossRef CAS PubMed.
- J. Zhang and X. Q. Zhang, Text. Aux., 2009, 26(2), 1–6 Search PubMed.
- W. Müller and U. Wollert, Pharmacology, 1979, 19, 59–67 CrossRef.
- Y.-J. Hu, Y. Liu and X.-H. Xiao, Biomacromolecules, 2009, 10, 517–521 CrossRef CAS PubMed.
- D. C. Carter, X.-M. He, S. H. Munson, P. D. Twigg, K. M. Gernert, M. B. Broom and T. Y. Miller, Science, 1989, 244, 1195–1198 CAS.
- X. M. He and D. C. Carter, Nature, 1992, 358, 209–215 CrossRef CAS PubMed.
- R. B. Singh, S. Mahanta, A. Bagchi and N. Guchhait, Photochem. Photobiol. Sci., 2009, 8, 101–110 CAS.
- Z. Feng, Z. Jing, C. Tong, Y. Chen, S. Zhuang and W. Liu, J. Hazard. Mater., 2013, 263(2), 618–626 Search PubMed.
- F. Moreno, M. Cortijo and G. Jiménez, Photochem. Photobiol., 1999, 70, 695–700 CrossRef CAS PubMed.
- F. Ge, C. Chen, D. Liu, B. Han, X. Xiong and S. Zhao, J. Lumin., 2010, 130, 168–173 CrossRef CAS.
- J. Wu, R. Wei, H. Wang, T. Li and W. Ren, J. Biochem. Mol. Toxicol., 2013, 27, 463–470 CAS.
- J. E. N. Dolatabadi, V. PanahiAzar, A. Barzegar, A. A. Jamali, F. Kheirdoosh, S. Kashanian and Y. Omidi, RSC Adv., 2014, 4, 64559–64564 RSC.
- R. Wei, H. Su and Z. Qin, Asian J. Ecotoxicol., 2012, 7, 542–548 CAS.
- K. T. Eriksen, O. Raaschou-Nielsen, M. Sørensen, M. Roursgaard, S. Loft and P. Møller, Mutat. Res., 2010, 700, 39–43 CAS.
- W. Hu, P. D. Jones, B. L. Upham, J. E. Trosko, C. Lau and J. P. Giesy, Toxicol. Sci., 2002, 68, 429–436 CrossRef CAS PubMed.
- N. Sreerama and R. W. Woody, Anal. Biochem., 2000, 287, 252–260 CrossRef CAS PubMed.
- A. Naila, D. Darin, D. Mark and P. J. Thornalley, J. Biol. Chem., 2005, 280, 5724–5732 CrossRef PubMed.
- L. Zhao, W. Song, J. Wang, Y. Yan, J. Chen and R. Liu, J. Biochem. Mol. Toxicol., 2015, 29, 579–586 CrossRef CAS PubMed.
- C. Tong and Z. Hu, J. Lumin., 2011, 131, 2133–2139 CrossRef CAS.
- M. Chen, H. Guo, Y. Liu and Q. Zhang, J. Biochem. Mol. Toxicol., 2014, 28, 281–287 CrossRef CAS PubMed.
- G. Xiang, C. Tong and H. Lin, J. Fluoresc., 2007, 17, 512–521 CrossRef CAS PubMed.
- J. R. Lakowicz, Principles of Fluorescence Spectroscopy, 2008, p. 63 Search PubMed.
- O. K. Abouzied and O. I. Alshihi, J. Am. Chem. Soc., 2008, 130, 10793–10801 CrossRef CAS PubMed.
- A. Sułkowska, J. Mol. Struct., 2002, 614, 227–232 CrossRef.
- Z. Hu and C. Tong, Anal. Chim. Acta, 2007, 587, 187–193 CrossRef CAS PubMed.
- C. Tong, X. Zhuo, Y. Guo and Y. Fang, J. Lumin., 2010, 130, 2100–2105 CrossRef CAS.
- Y. Zhang, Y. Yue, J. Li and X. Chen, J. Photochem. Photobiol., B, 2008, 90, 141–151 CrossRef CAS PubMed.
- Q. Wu, Z. Hao, S. Tao, B. Zhang and R. Liu, Spectrochim. Acta, Part A, 2015, 151, 124–130 CrossRef CAS PubMed.
- J. Jin and X. Zhang, J. Lumin., 2008, 128, 81–86 CrossRef CAS.
- H. Yin, S. Ai, W. Shi and L. Zhu, Sens. Actuators, B, 2009, 137, 747–753 CrossRef CAS.
- R. Liu, P. Qin, L. Wang, X. Zhao, Y. Liu and X. Hao, J. Biochem. Mol. Toxicol., 2010, 24, 66–71 CrossRef CAS PubMed.
- Q. Yang, J. Liang and H. Han, J. Phys. Chem. B, 2009, 113, 10454–10458 CrossRef CAS PubMed.
- U. Katrahalli, S. Jaldappagari and S. S. Kalanur, J. Lumin., 2010, 130, 211–216 CrossRef CAS.
- J.-Q. Lu, F. Jin, T.-Q. Sun and X.-W. Zhou, Int. J. Biol. Macromol., 2007, 40, 299–304 CrossRef CAS PubMed.
- W. B. Turnbull and A. H. Daranas, J. Am. Chem. Soc., 2003, 125, 14859–14866 CrossRef CAS PubMed.
- H. Sun, E. Cui, Z. Tan and R. Liu, J. Biochem. Mol. Toxicol., 2014, 28, 549–557 CrossRef CAS PubMed.
- P. D. Ross and S. Subramanian, Biochemistry, 1981, 20, 3096–3102 CrossRef CAS PubMed.
- X. M. He and D. C. Carter, Nature, 1992, 358, 209–215 CrossRef CAS PubMed.
- D. C. Carter and J. X. Ho, Adv. Protein Chem., 1994, 45, 153–203 CrossRef CAS PubMed.
- R. Beauchemin, C. N'Soukpoe-Kossi, T. Thomas, T. Thomas, R. Carpentier and H. Tajmir-Riahi, Biomacromolecules, 2007, 8, 3177–3183 CrossRef CAS PubMed.
- D. Wu, Y. Zhai, J. Yan, K. Xu, Q. Wang, Y. Li and H. Li, RSC Adv., 2015, 5, 11036–11042 RSC.
- T. Peters Jr, All about albumin: biochemistry, genetics, and medical applications, Academic press, 1995 Search PubMed.
- X. Zhang, L. Chen, X. C. Fei, Y. S. Ma and H. W. Gao, BMC Mol. Biol., 2009, 10, 1–12 CrossRef PubMed.
- Z. Luo, X. Shi, Q. Hu, B. Zhao and M. Huang, Chem. Res. Toxicol., 2012, 25, 990 CrossRef CAS PubMed.
Footnote |
| † Electronic supplementary information (ESI) available: Chemical structure of PFASs, synchronous fluorescence spectra, UV-visible absorption spectra, CD spectra of HSA in the absence and presence of different PFASs, and the interaction data between PFASs and HSA. See DOI: 10.1039/c7ra02963b |
| This journal is © The Royal Society of Chemistry 2017 |

