 Open Access Article
Fast detection of volatile organic compounds from Staphylococcal blood cultures by CDI-MS
Yaping Hang a,
Konstantin Chinginb,
Juchao Liangb,
Xiaozhong Wanga and
Longhua Hu*a
aDepartment of Clinical Laboratory, The Second Affiliated Hospital of Nanchang University, 1 Minde Road, Nanchang 330006, Jiangxi Province, P. R. China. E-mail: bingbinghang@hotmail.com; Tel: +86-791-86300410
bJiangxi Key Laboratory for Mass Spectrometry and Instrumentation, East China Institute of Technology, Nanchang 330013, P. R. China
First published on 9th May 2017
Abstract
Rapid recognition of Staphylococcal bacteremia in humans is a serious challenge in clinical research. Here we report on direct analysis of molecular volatile organic compounds (VOCs) of blood cultures emitted by 35 patients with a suspicion of Staphylococcal bacteremia and 31 patients positively diagnosed with Staphylococcal bacteremia were fingerprinted by atmospheric corona discharge ionization mass spectrometry (CDI-MS) for the presence of four common Staphylococci (Staphylococcus aureus, S. hominis, S. haemolyticus, and S. epidermidis) which statistically account for ca. 90% of cases of Staphylococcal bacteremia in humans. All the infected blood cultures revealed characteristic and clearly distinct MS patterns specific to the presence of one of the four Staphylococci after an incubation time of 3–16 h. Technical replicates were incubated over 2–3 days for reference diagnosis using current conventional bacteremia detection. The results of our 6 month hospital study confirm peaks at m/z 87 (isobutyric acid) and m/z 101 (isovaleric acid) signals were specifically present in Staphylococci, and indicate that high suitability of CDI-MS for rapid, reliable and cost-efficient diagnosis of Staphylococcal bacteremia in humans.
1. Introduction
Bacteremia is one of the main causes of high morbidity and mortality worldwide, especially for neonate and children. Bacteremia cases in United States and California occurred at an average of 1.7 million hospitalizations per year.1 Morbidity and mortality rates of bacteremia are higher in China because of relatively weak domestic basic sanitation, lack of standardized antibiotic use, and low specimen submission.2–4 Staphylococci are extremely important pathogens of bacteremia. Coagulase-negative Staphylococci (CNS) are normal inhabitants of the human skin and mucous membranes. Proper acquisition of blood specimens seriously affects the accuracy of laboratory tests. Recently, CNS was recognized as etiologic agents of a wide variety of infections and was found to be the most frequent organisms isolated from blood cultures.4,5 Staphylococcus aureus (S. aureus), a major human pathogen, and resistant strains, especially meticillin-resistant S. aureus (MRSA), play important roles in nosocomial infection. Rapid detection of S. aureus and CNS in humans is a serious challenge in clinical research.5The diagnostic “gold standard” of infectious disease is identification of bacterial pathogens. Note that traditional methods of bacterial identification are still mainly applied by majority of the clinical microbiology laboratories. The drawbacks of the current conventional identification methods highlight several unmet needs in Staphylococci diagnosis, such as necessity for accuracy and rapidity. As a result of these drawbacks, the processes of proliferation, smear microscopy, isolation, biochemical identification, and treatment are prolonged. Hence, rapid and accurate diagnosis could reduce the incidence of antibiotic abuses and unnecessary treatments.
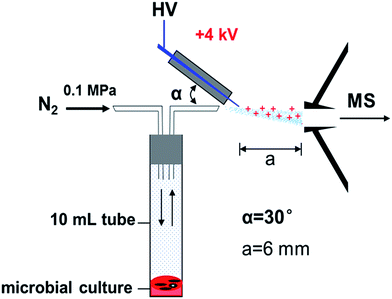
Volatile organic compounds (VOCs) can be regarded as the “chemical information molecule” of bacteria. VOCs have great potential for development and wide application of as biomarkers for bacterial diagnosis.6,7 In this study, homemade and new high-sensitivity mass spectrometry (CDI-MS), followed by headspace analysis, was applied in the identification of common Staphylococci for early clinical diagnosis and treatment.
Other headspace-based chemical analytical methods can be used for the identification of volatile metabolites. However, these methods have drawbacks; chromatography demands higher operation and relatively complicated pre-treatment with poor practicability;8 the electronic nose analysis is not highly sensitive and is not capable of analyzing chemical compositions;9 the rising matrix-assisted laser desorption ionization-time of flight-MS is inadequate for CNS identification, which is based on the difference of bacterial protein spectra, still requires bacteria detection after the isolation and culture;10 and secondary electrospray ionization-MS also needs simple pre-treatment with formic acid, with water used as an electrospray solution.11 Various methods have significant shortcomings.12 Previously Staphylococcal VOCs observed by mass spectrometry showed in Table 1,13–15 bacteremia screening by ambient CDI-MS, however, has obvious potential advantages:16–19 the speed of diagnosis (<1 day) is higher than that by culture methods (total 2–3 days), greatly reducing the turnaround time for clinical testing; Another advantage of VOC analysis is its high throughput (ca. 10–20 s per sample) because absolutely no sample pretreatment is necessary. CDI water vapor in the air with high ionization efficiency and without the use of high-pressure gas, methanol, and other toxic reagents. Spectrum is relatively simple and easy to miniaturize. This work is an attempt to address the problems of time-consuming bacterial identification methods.
| Biomarker | Method | Specificity | Time (h) |
|---|---|---|---|
| Isovaleric acid | GC-MS | Staphylococci | 25 |
| 1-Pyrroline-5-carboxylate | LC-ESI MS/MS | S. aureus/S. epidermidis | 40–64 |
| Enolase | LC-ESI MS/MS | S. aureus/epidermidis | 40–64 |
| Catalase | LC-ESI MS/MS | S. aureus | 40–64 |
| Aconitate hydratase | LC-ESI MS/MS | S. epidermidis | 40–64 |
| m/z 6230 | MALDI-TOF MS | S. saprophyticus class A | 25 |
| m/z 3875 | MALDI-TOF MS | S. aureus CC5 | 25 |
| m/z 6592 | MALDI-TOF MS | S. aureus CC8 | 25 |
2. Materials and methods
2.1 Sample ethical statement
All experiments were performed in compliance with the guideline “Biomedical research ethics review method involving people” (China), and approved by the medical research ethics committee at the Second Affiliated Hospital of Nanchang University. Informed consents were obtained from human participants of this study.2.2 Conventional identification and preservation of pathogens
Bacteria samples were isolated from patients in the Second Affiliated Hospital of NanChang University. Samples have previously been screened for the presence of bacteria. BacT/ALERT 3D automated blood culture instrument (BD, Shanghai, China) was used to enrich the bacteria through phenotype screening of gram stain, oxidase, and H2O2 enzymes. The identification of clinical samples was carried out with VITEK2-compact automated microbial analyzer (BioMerieux, Shanghai, China). When one of the four pathogens of interest (S. aureus and CNS) was detected, the remainder of the sample was stored in frozen milk at −80 °C (approximately 2 mL) for further use.2.3 Preparation of the bacterial suspension
Preserved strains or clinical isolates were recovered by culturing in blood agar plate at 35 °C overnight. The fresh single colony was inoculated in 0.45% sterile NaCl solution followed by dilution of bacterial suspension at different concentrations. Turbidity was determined with a turbidity meter (Vitek 2 DensiCHEK Plus, BioMerieux, Shanghai, China).2.4 Sample preparation
2.5 MS analysis of VOCs emitted by blood cultures
2.6 Data processing
PCA was used to recognize difference/similarity between the microbial VOCs fingerprints based on the MS raw data by virtue of Matlab software (version 7.0, Mathworks, Inc., Natick, MA), respectively. Single, full-scan MS data was exported to Microsoft Excel as a one-to-one function. The file used the m/z values as independent variables and the relative intensities of the full-scan MS as dependent variables. Hence, matrix was assembled of a total of MS and the total number of m/z values collected in the MS. This matrix was readily loaded from the Excel file into the Matlab software for PCA analysis, respectively. The principle components for output were automatically determined by the Matlab software with the “princomp” function. The scores and loadings of the first two principle components (PCs) were 2D plotted in Matlab, and integral time of PCA was approximately several minutes.3. Results and discussion
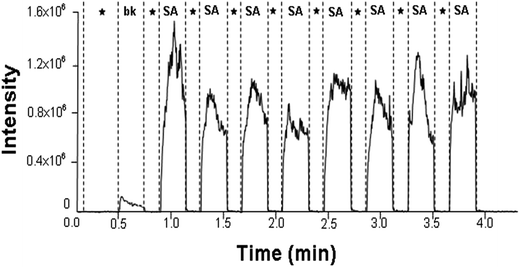
Previously, our team has analyzed the bacterial VOCs in vitro by ambient MS.18,19,22 In the present study, we extended the scope of the investigation and focused on clinical diagnosis of Staphylococcal bacteremia in humans. Over a period of six months, we detected blood cultures of 35 suspects and 31 positively diagnosed patients, including 9 S. aureus isolates, 9 S. hominis isolates, 6 S. haemolyticus isolates, 7 S. epidermidis isolates, and 19 simulated blood cultures. A total of 14 cases among 35 suspects were identified as S. aureus, and further research was needed for the other remaining pathogens. The full agreement between the results by the ambient MS analysis and the results by the conventional biochemical analysis demonstrated the potential of ambient MS for clinical applications.First of all, the main VOC peaks of S. aureus were screened by positively diagnosed specimens. The baseline level in ion chromatograms corresponds to the sampling of an empty centrifuge tube. Compared with the blank background reference, the signal intensity for m/z 101 observed was dramatically increased in the headspace of S. aureus blood cultures after culturing at 35 °C for 72 h. The intensity increased up to the 106 level (Fig. 2). The spike in the signal intensity at the beginning of each sampling in Fig. 2 can be attributed to the volatility of the ionized chemicals. Bacterial specific biomarker VOCs are critical for rapid pathogen identification based on MS7, but individual VOC is limited to the identification of a particular bacteria. Joint detection of multiple metabolites must be hastened to increase the sensitivity and specificity of VOC detection methods.23 Fig. 3 displays typical CDI-VOC fingerprints in the main m/z 60–200 range of simulated blood cultures inoculated with one of the four bacterial species (S. aureus, S. haemolyticus, S. hominis, and S. epidermidis) at a concentration of 104 CFU per mL and grown aerobically at 35 °C for 16 h. Peaks observed in the background-subtracted spectra do not necessarily belong to bacterial VOCs. Therefore, each mass spectrum was shown after the subtraction of signals from blank background reference from the same individual and incubated under the same conditions, all the signal to noise ratios of bacterial VOC fingerprints we detected were much higher than 3 after he subtraction of signals from blank background reference (e.g., signal to noise ratio of m/z 101 mainly were 195, 168, 206, 225, 251, 201), it indicated that the instrument was stable and sensitive to our requirements. A number of blood metabolic-related signals, e.g., m/z 59, m/z 90, and m/z 92, are shared between different bacteria. Thus, the fingerprints can be readily distinguished by visual inspection. Separation of the bacterial metabolism associated with signals from the metabolism of blood was necessary to obtain the specific bacterial VOC fingerprints.24 The signals of S. aureus were relatively higher intensity. The signal intensities for m/z 47, m/z 89, m/z 95, and m/z 108 were dramatically increased, with the intensity reaching up to the 105 level. Generally low signal peaks of S. haemolyticus and S. hominis were observed. By contrast, the signal peaks of S. epidermidis were higher than the other two CNS besides the common signal. Intensities of m/z 73, m/z 106, and m/z 108 were even higher than S. aureus, whereas the remaining signal peaks were low.
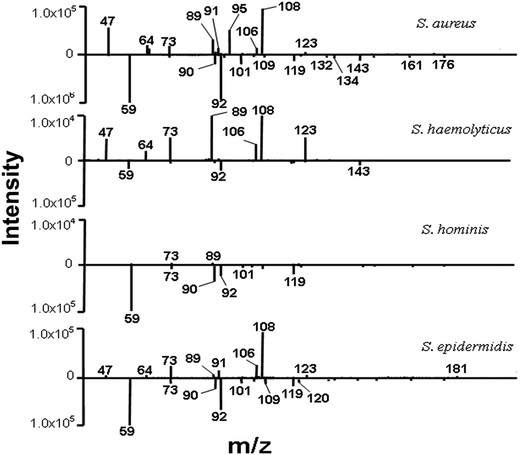 | ||
| Fig. 3 Positive (top) and negative (bottom) ion mode VOC fingerprints of simulated blood cultures inoculated with one of the four Staphylococcal species. | ||
Based on the earlier published reports, the relative molecular mass of compounds corresponding to m/z,25 and the high specific signals were confirmed by MS/MS experiments (Fig. 4). We temporarily assigned some interesting signals in bacterial fingerprints to ethanol (m/z 47, CDI+), nitric acid (m/z 64, CDI+), phenol (m/z 95, CDI+), benzaldehyde (m/z 108, CDI+), acetic acid (m/z 59, CDI−), ammonium propionate (m/z 90, CDI−), and aniline (m/z 92, CDI−). The biomarker signals were isovalerate (m/z 101, CDI−) and isobutyric acid (m/z 89, CDI+; m/z 87, CDI−). Notably, m/z 101 signal specifically existed in all four Staphylococci at different intensities, thus helping to differentiate Staphylococci from the other bacterial species. Moreover, the presence of m/z 132 and m/z 134 suggested that isovalerates are secondary metabolites of these two substances. All the features of Staphylococcal spectrum introduced above can be used for the identification of pathogens.
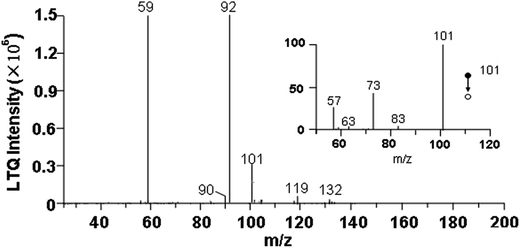 | ||
| Fig. 4 CDI-MS spectrum of volatiles emitted by S. aureus culture after 16 h incubation, and MS/MS experiments of m/z 101. | ||
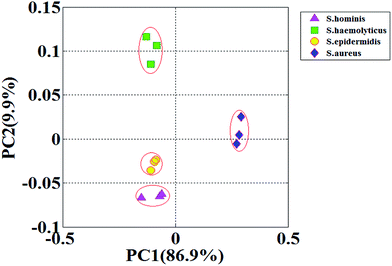
Handling multi-variable MS data by PCA has significant advantages.26,27 The replicates of S. aureus are clustered at the largest distance from the rest of the bacterial strains; S. haemolyticus are distant from S. aureus with highest distinction; S. hominis and S. epidermidis are close to each other but the boundaries are clear (detailed in Fig. 5). Overall, the discrimination of VOC fingerprints from the four Staphylococci is satisfactory using PCA, especially for S. aureus and S. haemolyticus, which are indistinguishable by traditional methods because of the presence of hemolysis. Early exclusion of contamination with CNS will greatly reduce the abuse of antibiotics and reduce health care costs for patients.
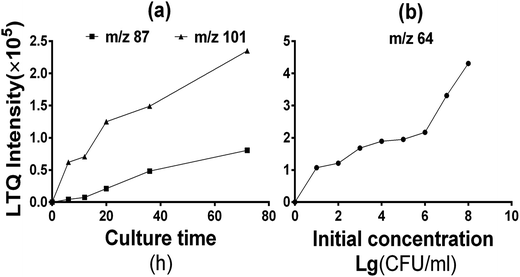
Moreover, the incubation time of 16 h used in the above simulated experiment is substantially shorter than in traditional clinical routines (48–72 h), thereby allowing space for further improvement. Therefore, we also investigated the release time of VOCs. Results revealed that the pathogen fingerprint identification saved time for at least 48 h. The relative signal intensities of the different bacterial VOCs grew at different rates, whereas the intensities of some signals remained nearly constant. The peaks at m/z 101 and m/z 87 were paid considerable attention because of their possibility as biomarker of Staphylococci; steady increase in the signal intensity in the beginning of incubation (<12 h) was followed by a rapid increase (Fig. 6a). However, no significant relationship with the initial concentration of bacteria was established. The characteristic releases of isobutyric acid (m/z 87 in negative ion mode) and isovaleric acid (m/z 101 in negative ion mode) by SA cultures are respectively linked to the metabolism of valine and leucine precursor.13,14 Therefore, the signal response of particular biomarkers can be selectively enhanced for targeted analysis by increasing the nutrient substance in culturing medium. Furthermore, signal intensity of nitrate (m/z 64 in positive ion mode) was proportional to the initial concentration of bacteria, whereas there was nothing to do with the culture time and remained constant. This appearance may be related to the ability of bacterial metabolism. There also remains space for further analytical improvement (e.g., adjustment of the medium, change of culture environment or optimization of mass spectrometry conditions). We can optimize the conditions (including m/z range, peak intensity and peak area%) for each m/z peak of all the VOCs in the standard strains blood culture, then establish the fingerprint database. We need to do internal quality control with the standard strains conventionally, the establishing of cutoff value for qualitative experiment and preparation of calibrators for quantitative testing are the goal of our next phase of experimentation. The integration of this approach in clinical practice will be further promoted by the growing availability of atmospheric corona discharge ionization mass spectrometers in bioanalytical laboratories and core facilities.
4. Conclusion
VOCs are good biomarkers of pathogens, Staphylococci were readily distinguished based on characteristic fingerprints. The obvious advantages of CDI-MS are particularly suitable for the detection of VOCs. However, the potential of using ambient ionization approaches in real clinical practice remains largely unexplored. The results of our 6 month hospital study strongly confirmed the potential of CDI-MS for clinical applications. Therefore, Staphylococcal blood culture processed by the rapid and noninvasive CDI-MS analysis can be further interrogated by more expensive and time-consuming biochemical assays for complementary analysis.Acknowledgements
This work is jointly supported by National Natural Science Foundation of China (NNSFC) (no. 81460327, 21105010) and major Project Science and Technology Agency of Jiangxi Province (no. 20152ACG70014).References
- S. K. Gohil, C. Cao, M. Phelan, T. Tjoa, C. Rhee, R. Platt and S. S. Huang, C. Centers for Disease and P. Prevention Epicenters, Clin. Infect. Dis., 2016, 62, 695–703 CrossRef PubMed.
- Q. Liu, W. Li, X. Du, W. Li, T. Zhong, Y. Tang, Y. Feng, C. Tao and Y. Xie, PLoS One, 2015, 10, e0130701 Search PubMed.
- J. N. Wu, T. E. Gan, Y. X. Zhu, J. M. Cao, C. H. Ji, Y. H. Wu and B. Lv, J. Zhejiang Univ., Sci., B, 2015, 16, 70–77 CrossRef PubMed.
- Y. Jiang, L. Kuang, H. Wang, L. Li, W. Zhou and M. Li, Intern. Med., 2016, 55, 597–603 CrossRef CAS PubMed.
- D. J. Anderson, R. W. Moehring, R. Sloane, K. E. Schmader, D. J. Weber, V. G. Fowler Jr, E. Smathers and D. J. Sexton, PLoS One, 2014, 9, e91713 Search PubMed.
- B. Audrain, M. A. Farag, C. M. Ryu and J. M. Ghigo, FEMS Microbiol. Rev., 2015, 39, 222–233 CrossRef PubMed.
- V. Shestivska, K. Dryahina, J. Nunvar, K. Sovova, D. Elhottova, A. Nemec, D. Smith and P. Spanel, J. Breath Res., 2015, 9, 027104 CrossRef PubMed.
- Y. Wang, M. Wang, J. Li, S. Yao, J. Xue, W. Zou and C. Hu, J. Antibiot., 2014, 67, 511–518 CrossRef CAS PubMed.
- R. M. Schnabel, M. L. Boumans, A. Smolinska, E. E. Stobberingh, R. Kaufmann, P. M. Roekaerts and D. C. Bergmans, Respir. Med., 2015, 109, 1454–1459 CrossRef CAS PubMed.
- C. D. Doern and S. M. Butler-Wu, J. Mol. Diagn., 2016, 18, 789–802 CrossRef CAS PubMed.
- S. P. Pasilis and G. J. Van Berkel, Encyclopedia of Spectroscopy and Spectrometry, 2017, 3rd edn, pp. 819–829 Search PubMed.
- S. Sethi, R. Nanda and T. Chakraborty, Clin. Microbiol. Rev., 2013, 26, 462–475 CrossRef CAS PubMed.
- A. G. James, D. Cox and K. W., Flavour Fragrance J., 2013, 28, 231–237 CrossRef CAS.
- A. G. James, C. J. Austin, D. S. Cox, D. Taylor and R. Calvert, FEMS Microbiol. Ecol., 2013, 83, 527–540 CrossRef CAS PubMed.
- K. Cheng, H. Chui, L. Domish, D. Hernandez and G. Wang, Proteomics: Clin. Appl., 2016, 10, 346–357 CrossRef CAS PubMed.
- K. Sekimoto, M. Sakakura, T. Kawamukai, H. Hike, T. Shiota, F. Usui, Y. Bando and M. Takayama, Analyst, 2016, 141, 4879–4892 RSC.
- Z. Aladaghlo, A. R. Fakhari and K. S. Hasheminasab, Microchem. J., 2016, 129, 41–48 CrossRef CAS.
- J. Liang, Y. Hang, K. Chingin, L. Hu and H. Chen, RSC Adv., 2014, 4, 25326 RSC.
- K. Chingin, J. Liang, Y. Hang, L. Hu and H. Chen, RSC Adv., 2015, 5, 13952–13957 RSC.
- X.-X. Li, L.-F. Chen, Y.-Z. Ouyang, F. Feng and H.-W. Chen, Chin. J. Anal. Chem., 2016, 44, 25–31 CAS.
- H.-W. Chen, J.-H. Lai, Y.-F. Zhou, Y.-F. Huan, J.-Q. Li, Z. Xie, Z.-C. Wang and M.-B. Luo, Chin. J. Anal. Chem., 2007, 35, 1233–1240 CAS.
- L. Hu, J. Liang, K. Chingin, Y. Hang, X. Wu and H. Chen, RSC Adv., 2016, 6, 8449–8455 RSC.
- S. Sethi, R. Nanda and T. Chakraborty, Clin. Microbiol. Rev., 2013, 26, 462–475 CrossRef CAS PubMed.
- K. Kim, C. Mall, S. L. Taylor, S. Hitchcock, C. Zhang, H. I. Wettersten, A. D. Jones, A. Chapman and R. H. Weiss, PLoS One, 2014, 9, e86223 Search PubMed.
- L. D. Bos, P. J. Sterk and M. J. Schultz, PLoS Pathog., 2013, 9, e1003311 CAS.
- C. Sales, M. I. Cervera, R. Gil, T. Portolés, E. Pitarch and J. Beltran, Food Chem., 2017, 216, 365–373 CrossRef CAS PubMed.
- J. Ding, S. Yang, D. Liang, H. Chen, Z. Wu, L. Zhang and Y. Ren, Analyst, 2009, 134, 2040–2050 RSC.
| This journal is © The Royal Society of Chemistry 2017 |

