DOI:
10.1039/C7RA02608K
(Paper)
RSC Adv., 2017,
7, 24064-24069
In situ strategy to prepare PDPB/SnO2 p–n heterojunction with a high photocatalytic activity
Received
3rd March 2017
, Accepted 11th April 2017
First published on 3rd May 2017
Abstract
As a novel material for water depollution, conjugated polydiphenylbutadiyne (PDPB) nanofibers have received attention due to their visible light responsive photocatalytic activity. In this study, we successfully prepared a PDPB/SnO2 p–n heterojunction by an in situ growth route. The XPS characterization indicates the generation of Sn–C bonds between SnO2 and PDPB, which would decrease the bandgap of SnO2 and promote the transference efficiency of electrons and holes between these two components. The PDPB could act as the sensitizer to enlarge the solar light absorption region of the heterojunction. The SnO2 provides a stable mesoporous structure and enhanced hydrophilic properties. The solar-driven photodegradation rate of Rhodamine B over the PDPB/SnO2 (ratio is 2![[thin space (1/6-em)]](https://www.rsc.org/images/entities/char_2009.gif) :1) is 4 times higher than that of the pure SnO2 and 2 times higher than that of the pure PDPB nanofibers. Our strategy gives a facile strategy for the preparation of an organic–inorganic hybrid heterojunction with high solar light activity.
:1) is 4 times higher than that of the pure SnO2 and 2 times higher than that of the pure PDPB nanofibers. Our strategy gives a facile strategy for the preparation of an organic–inorganic hybrid heterojunction with high solar light activity.
1. Introduction
In recent years, SnO2 mesoporous single crystals (MSCs) have gained much attention due to their excellent properties such as perfect single-crystallinity, large specific surface areas, high electron mobility and exposed active sites.1–4 These advantages have led to the successful research for their various applications in photocatalysis,5,6 sensors7–9 and solar cells.10,11 However, SnO2 MSCs have an inevitable drawback ascribed to their wide band gap, which limits solar light from being absorbed and then leads to the low photocatalytic activity. Thus, it is urgent to find a strategy to extend the light harvesting of SnO2 MSCs. Much effort has been focused on enhancing the photoabsorption and the charge separation rate of SnO2 by methods such as element doping,12,13 surface modification,14,15 and heterojunction design.16–18 Note that coupling of two materials as a semiconductor heterojunction could substantially improve the photocatalytic activity by broadening the absorption range of light and increasing the separation efficiency of the photogenerated electrons and holes.19–23 Zhang et al.24 used a one-step fabrication to synthesize an Ag3PO4/SnO2 composite, which showed improved photocatalytic activity and structural stability for photodecomposition of organic compounds. Zheng et al.25 synthesized a network structured SnO2/ZnO nanocatalyst by a two-step solvothermal method. The photocatalytic activity of SnO2/ZnO for the degradation of methyl orange was much higher than that of the pure SnO2 and ZnO. Zhang et al.26 used a combination method of sol–gel process and electrospinning technique to synthesize the one-dimensional ZnO–SnO2 nanofibers, which exhibited excellent photocatalytic activity, superior to the electrospun pure ZnO and SnO2 nanoparticles. According to these published studies, the heterojunction structure of two semiconductors will open an efficient pathway for the improvement of photocatalytic activity and stability.
Recently, conjugated polymer polydiphenylbutadiyne (PDPB) nanofibers27 attracted wide attention due to their high visible light response, stable cycling property and low cost. They have a narrow band gap of 1.81 eV, which is attributed to the octamer structure. The electrons could be generated by the conjugated polymer chains when illuminated by energetic photons, but PDPB nanofibers have a highly hydrophobic feature that limits their photocatalytic performance in water. In order to overcome these drawbacks, we synthesized a p–n heterojunction structure of SnO2 and PDPB. In this heterojunction structure system, PDPB nanofibers could enlarge the spectral absorption range, whereas SnO2 MSCs could provide a stable mesoporous structure and a hydrophilic environment.
Herein, we employed a facile and green in situ strategy to synthesize a PDPB/SnO2 heterojunction. This heterojunction has advantages of both single crystals and polymers, such as high photosensitivity, stable mesoporous structure and good hydrophilicity. The PDPB nanofibers were adsorbed and grown on the surface of the SnO2 MSCs, and the Sn–C bonds were generated between them to realize the carbon doping on SnO2. When the heterojunction surface was illuminated, PDPB nanofibers absorbed the light and generated electrons. Moreover, carbon-doped SnO2 (C–SnO2) MSCs offered charge transfer channels, which endowed the PDPB/SnO2 composites with a high photocatalytic activity. The photodegradation rate of Rhodamine B (RhB) over the PDPB/SnO2 composite (ratio is 2:1) is 4 times that of the single SnO2 MSCs and 2 times that of single PDPB nanofibers.
2. Experimental
2.1 Materials
Tetraethyl orthosilicate (TEOS), aqueous solution of ammonia (NH3·H2O, 25 wt%), ethanol, distilled water, stannic chloride (SnCl4·5H2O), polyethylene pyrrole (PVP), hydrochloric acid (HCl), sodium hydroxide (NaOH), sodium chloride, sodium dodecyl sulphate, 1,4-diphenylbutadiyne (DPB), benzoin methyl ether (BME), cyclohexane, and pentanol-1 were used. All chemicals were of analytical grade and used without further purification.
2.2 Preparation of photocatalysts
Preparation of SiO2 spheres. The silica spheres were synthesized by the Stöber method. First, 167.2 mL ethanol was mixed with 28.8 mL water in a beaker. The mixture was stirred for 1 min at room temperature. Simultaneously, 18.0 mL tetraethoxysilane (TEOS) was mixed with 182.0 mL absolute ethanol at room temperature. The TEOS solution was stirred for 1 min and poured into the abovementioned mixture. After that, 4.0 mL ammonium hydroxide solution was added into the mixture. The precursor liquid was stirred for 24 h to obtain a suspension (silica colloids). Then, it was centrifuged at 12000 rpm for 1 h and dried in a vacuum oven at 60 °C for 12 h.
Preparation of SnO2 MSCs. The SnO2 MSCs were prepared by a modifying the method developed by Zheng et al.28 Herein, 12 mL H2O, 12 mL ethanol and 0.1 g PVP were added in the autoclave (50 mL volume). After being completely dissolved, 1.346 g SnCl4·5H2O was added into the autoclave. Then, the mixture was stirred at room temperature for 10 min, and 1.8 mL hydrochloric acid (HCl, 37%) was added and stirred for another 10 min. Then, 0.8 g SiO2 was added, and the sealed vessel was heated at 200 °C for 12 h. Finally, the silica template was removed by etching in 2 M NaOH at 80 °C for 1 h. The remaining products were collected by centrifugation and washed several times with H2O and ethanol.
Preparation of PDPB/SnO2 MSC heterojunction. The in situ route to PDPB/SnO2 MSCs was prepared by modifying the method developed by Ghosh et al.27 Herein, 0.035 g NaCl was dissolved in 2 mL H2O, and 1 g of a surfactant (sodium dodecyl sulphate) was dissolved in the mixture solution. After vigorous agitation for 5 h, the surfactant had completely dissolved to form a transparent and viscous micellar solution. After that, we weighed 0.1 g DPB and 0.01 g BME into a beaker and added 5 mL cyclohexane, followed by ultrasound treatment of the solution for complete dissolution. This solution was added to the abovementioned micellar solution under stirring, which led to a white unstable emulsion. After reaction for 0.5 h, a co-surfactant, pentanol-1 (420 μL) was added to the mixture and stirred for 3 h. Then, different masses of SnO2 MSCs were added into the mixture. The glass tube was illuminated using a 300 W xenon lamp at a distance of 5 cm for 12 h. Then, the products were extracted into a 15 mL water and 15 mL ethanol solution and dried in a vacuum oven at 60 °C for 12 h.
2.3 Characterizations
The crystal structure of the sample was detected by X-ray diffraction (XRD) measurements (Rigaku Ultima IV (Cu Kα radiation, λ = 1.5406 Å) in the range of 10–80° (2θ)). The morphologies of the PDPB/SnO2 heterojunctions were characterized by transmission electron microscopy (TEM, JEM2100) and field emission scanning electron microscopy (FESEM, HITACHI, S4800). BET specific surface area measurements were studied by N2 adsorption at 77 K using an ASAP2020 instrument. The X-ray photoelectron spectroscopy (XPS) studies were carried out using a Perkin-Elmer PHI 5000C ESCA system with Al Kα radiation. The binding energy shift was referenced to the C1s level at 284.6 eV as an internal standard. Infrared spectra (IR) were recorded with KBr disks containing the powder sample with an FTIR spectrometer (Nicolet Magna 550). Thermogravimetric and differential thermal analyses were conducted on a Pyris Diamond TG/DTA (PerkinElmer) apparatus at a heating rate of 20 K min−1 from 40 °C to 800 °C in air flow. UV-vis diffuse reflectance spectra (DRS) were obtained with a SHIMADZU UV-2600 spectroscope equipped with an integrating sphere assembly and using BaSO4 as the reflectance sample. Photocurrent measurements were carried out on an electrochemical analyzer (CHI 660 D electrochemical station, CHI Instruments Inc.) at room temperature. Transient photocurrent responses of different samples were carried out in 0.5 M Na2SO4 aqueous solution under various irradiation conditions (300 W Xe lamp).
2.4 Measurements of photocatalytic activity
The photocatalytic activities of the PDPB/SnO2 MSCs have been evaluated for the photodecomposition of RhB in water. The photocatalyst (0.01 g) was added into a 100 mL quartz photoreactor containing 50 mL of RhB solution (10 mg L−1). The suspension containing PDPB/SnO2 with pollutants was stirred in the dark for 1 h to establish adsorption–desorption equilibrium before irradiation. A 300 W Xe lamp with an AM1.5 air mass filter was used as a simulated solar light source. Then, the solutions were irradiated for 3 h and quantified every 30 min. The degradation efficiency of RhB was detected by ultraviolet-visible spectrophotometry.
3. Results and discussion
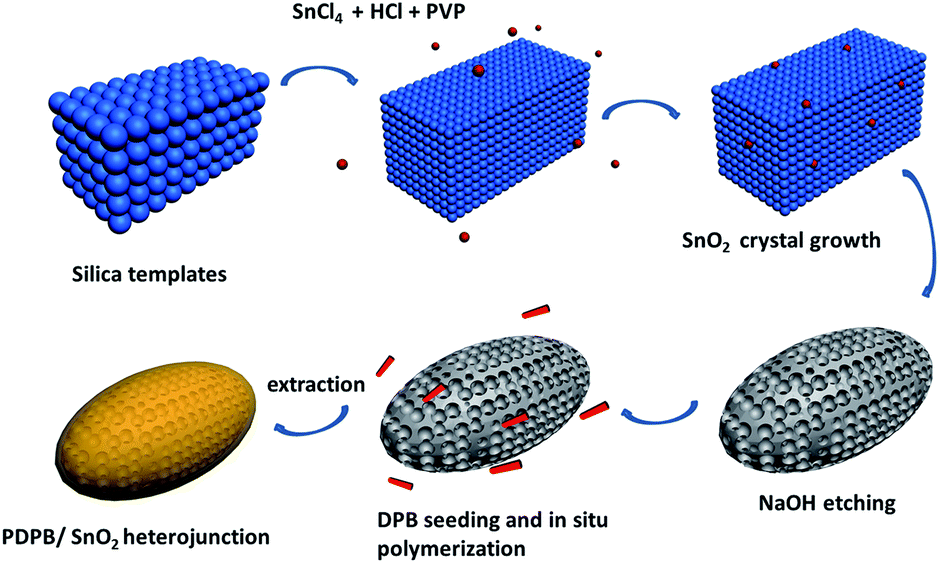
The overall synthesis of the PDPB/SnO2 MSCs heterojunction consisted of two steps (Scheme 1). First, we used a hard template method to synthesize the SnO2 MSCs by a solvothermal process. SnO2 was generated in the gap of the silica template, and the silica was etched by NaOH to form the mesoporous structure of SnO2. Second, the SnO2 MSCs were added into the soft template hexagonal mesophases, which contained DPB and BME. After that, the DPB would grow and adsorb on the surface of SnO2 MSCs under light irradiation. We synthesized the PDPB/SnO2 heterojunction with different weight ratios (PDPB:SnO2 = 4:1, 2:1, 1.33:1, 1:1).
 |
| | Scheme 1 Synthetic steps of SnO2 MSCs and PDPB/SnO2 MSC heterojunction. | |
3.1 Heterojunction structure
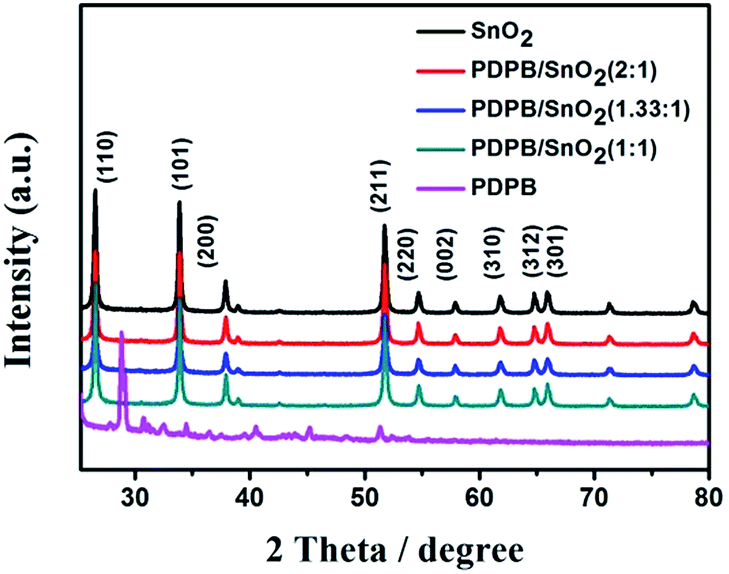
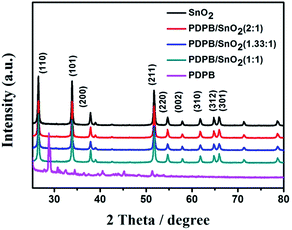
The crystal structures of the PDPB/SnO2 MSCs were examined by X-ray diffraction (XRD). Fig. 1 shows the XRD patterns of pure SnO2 MSCs, pure PDPB nanofibers and PDPB/SnO2 composites. The SnO2 MSCs showed a rutile phase of tetragonal SnO2. The sharp peaks are observed at 2θ = 26.58°, 33.9°, 37.92°, 51.76°, 54.7°, 57.9°, 61.86°, 64.78° and 65.92°, which could be indexed as the (110), (101), (200), (211), (220), (002), (310), (312) and (301) diffraction planes, respectively. The characteristic peaks of PDPB nanofibers also appeared in XRD patterns. There is no evident peak ascribed to the PDPB over the PDPB/SnO2 composite, which is due to the low loading content of PDPB on the surface of SnO2.
 |
| | Fig. 1 XRD patterns of pure PDPB, pure SnO2 and PDPB/SnO2 composites. | |
3.2 Morphology and surface area
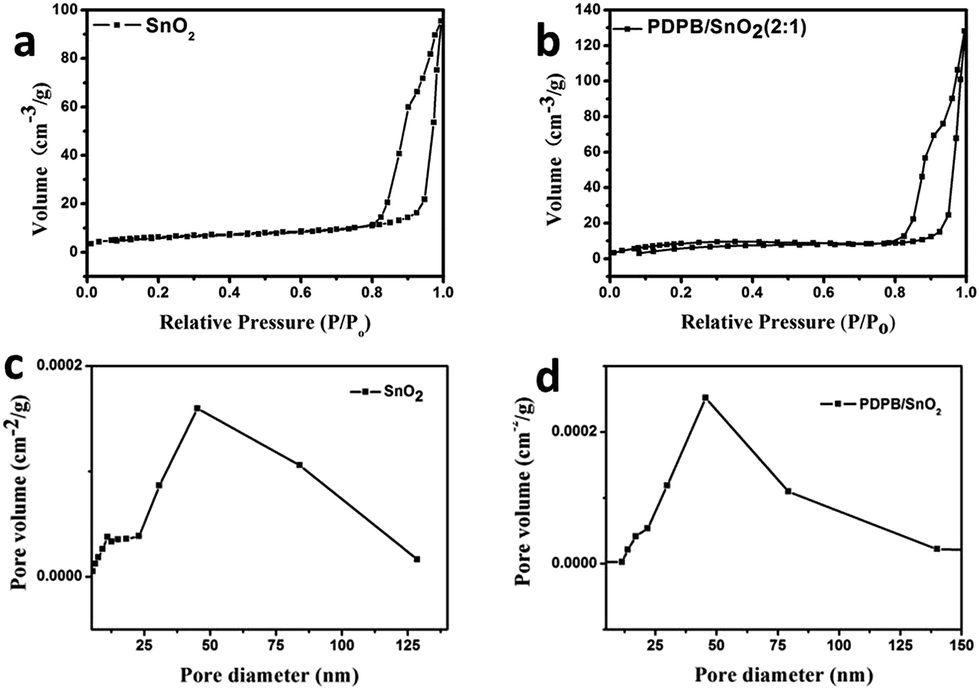
The morphologies of the SnO2 MSCs and PDPB/SnO2 composites were analyzed by TEM and FESEM, and the results are shown in Fig. 2. From Fig. 2a and c, we can find the obvious, well-defined, and uniform mesoporous structure of the shuttle shape SnO2 from the TEM and FESEM images. The length and width of the SnO2 MSCs are ∼400 nm and ∼200 nm, respectively, and the pore size is uniform at ∼50 nm. The HRTEM images of SnO2 MSCs (Fig. 2e) show that the uniform lattice distance is 0.338 nm, which indicates the (110) plane of SnO2. Compared to pure SnO2 MSCs, Fig. 2b and d demonstrate that the pore structure of PDPB/SnO2 becomes hazy, which is attributed to the in situ growth of PDPB on the surface of SnO2 MCMs. This speculation is confirmed by the BET results. The BET curve is shown in Fig. 3; the hysteresis loop and the pore size distribution curve could prove that the PDPB does not enter into the pore structure of SnO2 MSCs. The BET surface area of pure SnO2 MSCs and PDPB/SnO2 is 23.2 m2 g−1 and 31.2 m2 g−1, respectively, indicating that the PDPB was covered on the surface rather than in the pores of SnO2. The surface area of PDPB/SnO2 is a little larger compared to the pure SnO2, which also implies that the loading of PDPB could not change the original mesoporous structure of SnO2.
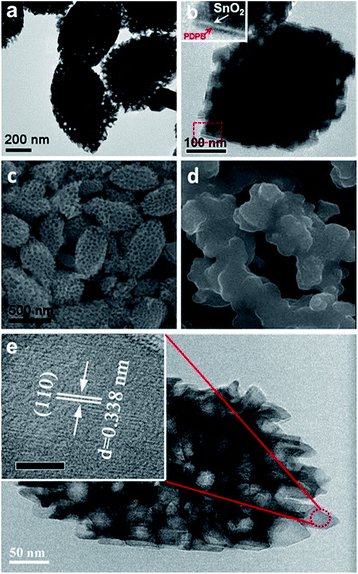 |
| | Fig. 2 Morphology characterization results of as-prepared samples. TEM images of pure SnO2 MSCs (a) and PDPB/SnO2 composites (2:1) (inset is the amplification of the red circle) (b); FESEM images of pure SnO2 MSCs (c) and PDPB/SnO2 composites (2:1) (d); HRTEM image of SnO2 MSCs (e). | |
 |
| | Fig. 3 Nitrogen adsorption/desorption isotherm of SnO2 MSCs (a) and PDPB/SnO2 composites (b); pore size distributions of SnO2 MSCs (c) and PDPB/SnO2 composites (d). | |
3.3 XPS characterization
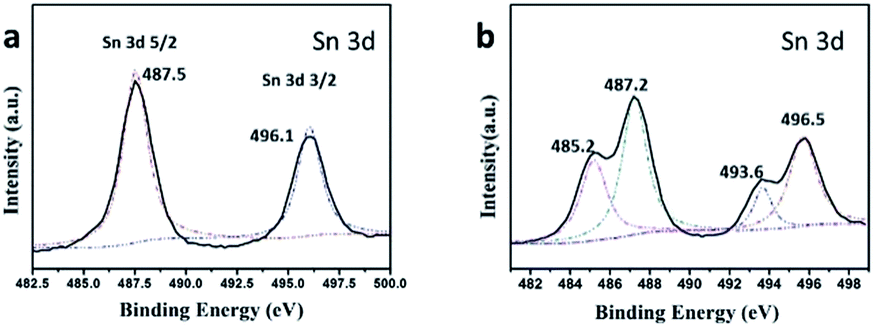
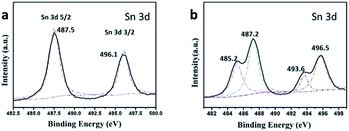
The surface composition and chemical states of SnO2 MSCs and PDPB/SnO2 composites were investigated by XPS spectra. Fig. 4 shows the Sn 3d XPS spectrum of SnO2 MSCs and PDPB/SnO2 composites. The peaks at 487.5 eV and 496.1 eV belong to the Sn 3d5/2 and Sn 3d3/2, respectively, which are the characteristic peaks of Sn(IV). Interestingly, compared to pure SnO2, the Sn 3d spectrum of PDPB/SnO2 has two extra peaks at 485.2 eV and 493.6 eV. These two peaks indicate the changes of chemical states of Sn element, which may be caused by the combination between SnO2 and PDPB. A similar phenomenon was also reported in previous literature.29 We inferred that this result is due to the combination between SnO2 and PDPB and it may generate a new impurity level with the Sn–C bond. C replaced O from SnO2 and acted as the electron donor to enlarge the electron cloud density of Sn element, which led to the appearance of new XPS peaks at a lower binding energy.
 |
| | Fig. 4 Sn 3d XPS spectra of pure SnO2 (a) and PDPB/SnO2 composites (2:1) (b). | |
3.4 IR and TGA analysis
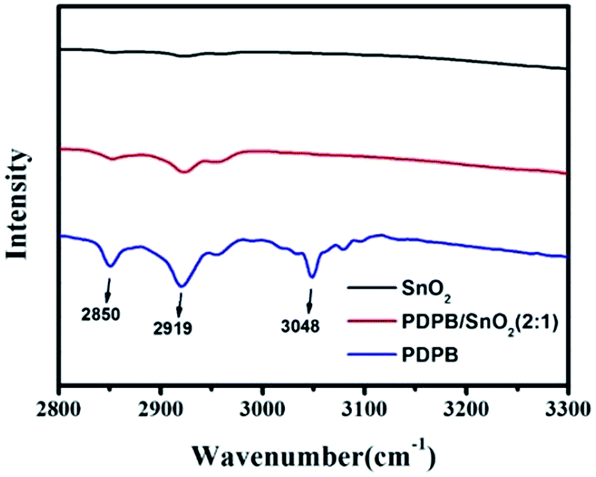
In order to confirm the existence of PDPB and find the interaction between SnO2 and PDPB, IR spectra were obtained, as shown in Fig. 5. The pure PDPB shows the characteristic peaks at 2850 cm−1, 2919 cm−1 and 3048 cm−1, which can be attributed to the C–H vibration of the polymer molecule chains. There are no significant peaks of pure SnO2 in this region. Compared to the pure SnO2 and PDPB, the characteristic peaks at 2850 cm−1 and 2919 cm−1 are consistent with the pure PDPB, but the 3048 cm−1 peak is too weak to locate and could be induced by the chemical bonding between SnO2 and PDPB. The XPS results indicate the generation of Sn–C bonds between polymers and semiconductors, which could be formed by the dehydration between C–H bonds and Sn–OH bonds.
 |
| | Fig. 5 IR spectra of pure SnO2, pure PDPB and PDPB/SnO2 composites (2:1). | |
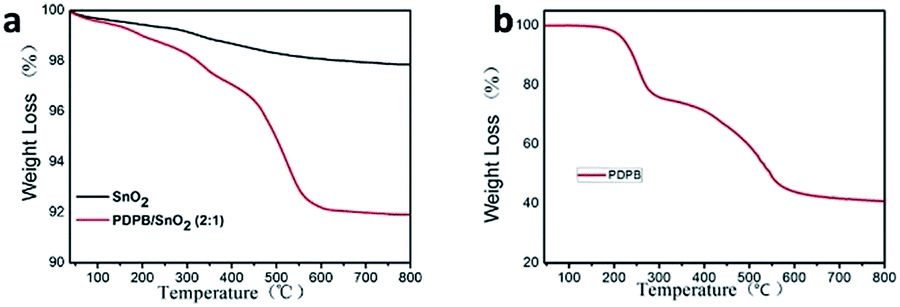
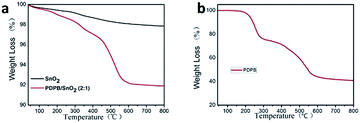
The loading content of PDPB in the heterojunction was examined by the thermogravimetric analysis (TGA). Fig. 6a demonstrates that the TGA curve of pure SnO2 is like a horizontal line, indicating the stable property of SnO2. The curve of the PDPB/SnO2 heterojunction shows a weight loss at 160 °C. The loss process has two steps: (1) from 160 °C to 250 °C, it indicates the thermal decomposition of polymer chains; (2) from 250 °C to 450 °C, it indicates the decomposition of carbons. From the TGA results, it is observed that PDPB mass in the heterojunction is about 8% (2:1 ratio), and the interaction between PDPB and SnO2 causes the heterojunction (160 °C) to have a weight-loss temperature lower than that of the pure PDPB (200 °C) (Fig. 6b).
 |
| | Fig. 6 (a) TGA spectra of SnO2 and PDPB/SnO2 composites (2:1). (b) TGA spectra of PDPB nanofibers. | |
3.5 UV-vis diffuse reflectance spectra
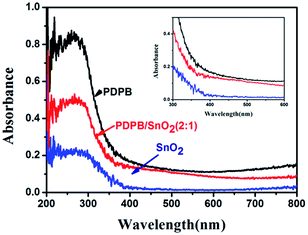
The absorbance of the pure SnO2 MSCs, pure PDPB and PDPB/SnO2 composites were measured by UV-vis diffuse reflectance spectra (Fig. 7). The pure PDPB shows a high absorption from 200–700 nm wavelength, which shows the excellent light harvest. The PDPB/SnO2 composites present a lower photo response than pure PDPB due to the low loading amounts of PDPB in the composites. It is clear that the PDPB/SnO2 composite has a higher absorption value than the pure SnO2 MSCs from 200–700 nm wavelengths. Particularly in the ultraviolet region, the absorption value over heterojunction has a remarkable increase than the pure SnO2 MSCs, which indicates that PDPB could enhance the light absorption of SnO2. From the UV-vis results, we can demonstrate that PDPB could be used as the sensitizer to enlarge the solar light response range of SnO2, which is expected to improve the photocatalytic activity of SnO2 under solar light.
 |
| | Fig. 7 UV-vis diffuse reflectance spectra of pure PDPB, pure SnO2 MSCs and PDPB/SnO2 composites (2:1). | |
3.6 Photochemical property measurement
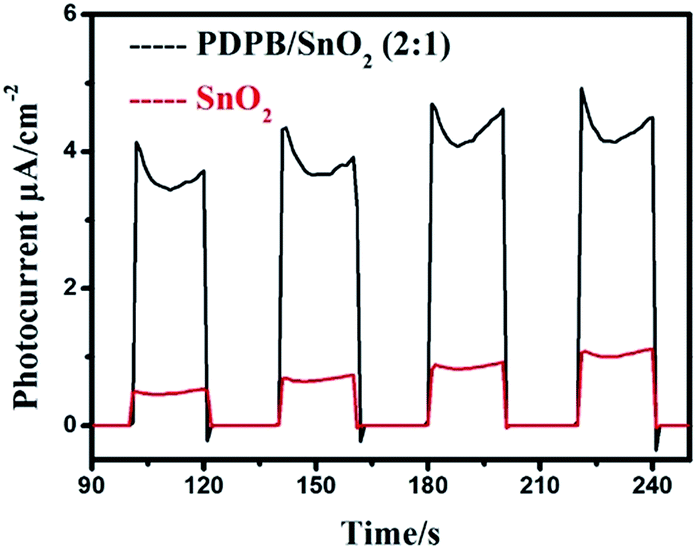
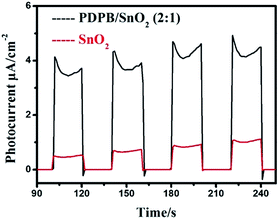
In order to compare the photochemical properties of pure SnO2 and PDPB/SnO2 composites, we used the transient photocurrent response measurements to characterize the separation efficiency of photogenerated electrons and holes. The photocurrents of these samples were recorded in the dark or under solar light illumination using the xenon lamp assembled with an AM1.5 optical filter as the light source, as shown in Fig. 8. The results show that the photocurrent of PDPB/SnO2 is much higher than that of pure SnO2 MSCs. For PDPB/SnO2 composites, the photocurrent response was 4 μA cm−2, which is about 4 times that of the SnO2 MSCs (below 1 μA cm−2). As we know, carbon-doped SnO2 is the n-type semiconductor and PDPB is the p-type polymer semiconductor.30 Owing to the p–n heterojunction structure of PDPB and SnO2 MSCs, the composites display a higher transfer rate of photogenerated electron–hole pairs, which confirms the lower recombination rate for the PDPB/SnO2 composites. When solar light is irradiated on the PDPB/SnO2 heterojunction, the photogenerated electrons can be easily excited from the PDPB valence band (VB) to the conduction band (CB) and subsequently injected to the CB of SnO2 MSCs. Moreover, the hole still remains in the valence band of PDPB. Then, the electrons and holes further react with O2 or H2O to generate the superoxide radical and hydroxyl radicals, and these radicals can oxidize the RhB and degrade it, which is in accordance with the highly photocatalytic activity of PDPB/SnO2.
 |
| | Fig. 8 Photocurrent spectra of pure SnO2 MSCs (red) and PDPB/SnO2 composites (black) (2:1). | |
3.7 Photocatalytic activity measurement
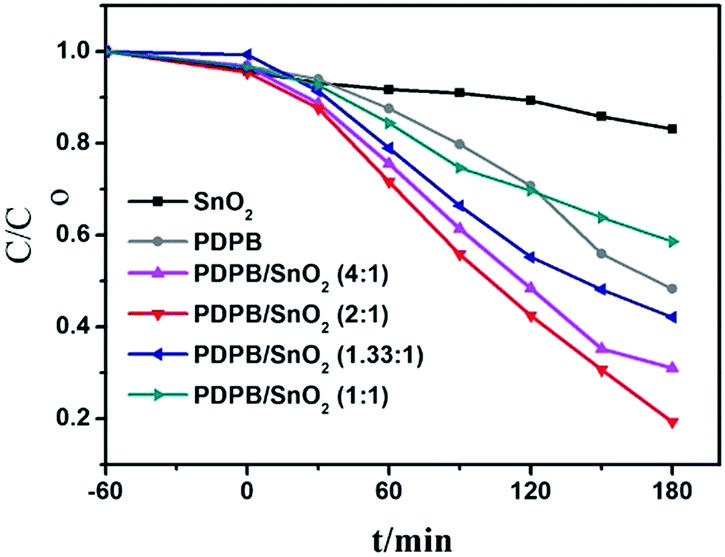
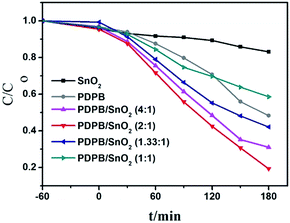
The photocatalytic activity of the as-prepared samples was evaluated by measuring the decomposition rate of the model pollutants of Rhodamine B (RhB) in water under solar light (Xe lamp with AM1.5 filter). The photocatalytic activities at different ratios of PDPB/SnO2 were compared with the activities of pure PDPB and pure SnO2 MSCs. Fig. 9 shows the degradation rate of all samples, and it is clearly shown that all PDPB/SnO2 composites presented an evidently enhanced photocatalytic activity than pure SnO2 MSCs. The samples with 4:1, 2:1, and 1.33:1 ratios also showed a photocatalytic activity higher than the pure PDPB. The SnO2 MSCs with a wide band gap showed a low solar light activity to degrade RhB. The p–n heterojunction showed a much higher photocatalytic activity that is caused due to the sensitization of PDPB and the narrowed band gap of SnO2 resulting due to carbon doping. The PDPB/SnO2 showed a higher activity than pure PDPB owing to the synergistic effect of the p–n heterojunction and PDPB sensitization. That is, the photo-generated electrons and holes have an efficient separation at the interface between PDPB and the SnO2 MSCs. The 2:1 ratio sample had the highest photocatalytic activity, whose degradation rate of RhB is 4 times and 2 times that of pure SnO2 MSCs and pure PDPB, respectively. The sample with a 1:1 ratio showed a relatively lower activity, which indicates that the extra PDPB covered on the surface of SnO2 would decrease the light absorption of C–SnO2. Therefore, the ratio of PDPB and SnO2 MSCs has an optimum value. In addition, the PDPB amount in the PDPB/SnO2 (1:1) composite is relatively low (lower than 8%), and hence the main body of the PDPB/SnO2 composite is SnO2. Thus, the composite with 1:1 ratio shows a lower activity than PDPB. When the amount of PDPB is too high, it generates more recombination centers of electrons and holes. This indicates that the ratio of PDPB and SnO2 has an optimal value.
 |
| | Fig. 9 Photodegradation of RhB of pure PDPB, pure SnO2 and PDPB/SnO2 composites under the solar light irradiation (Xe lamp with AM1.5 filter). | |
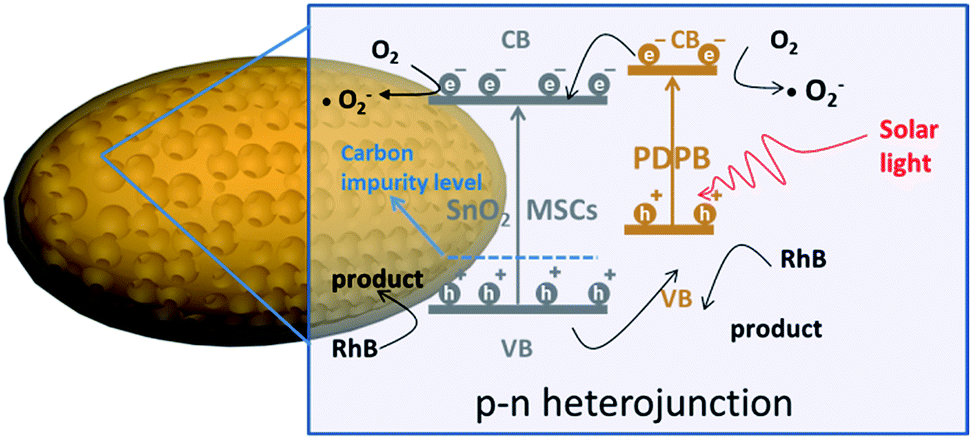
3.8 Mechanism
The proposed mechanism of the PDPB/SnO2 heterojunction is illustrated in Fig. 10. In this heterojunction structure, n-type SnO2 MSCs provided a stable mesoporous structure, a hydrophilic environment, a high electron mobility, and exposed facets with active sites, which could expedite the electron transfer rate. The p-type PDPB on the surface of the heterojunction acted as a sensitizer to improve the solar light absorption.31 The generation of Sn–C bonds between SnO2 and PDPB introduced a carbon impurity level above the VB of SnO2, which led to the solar light response of SnO2. The construction of a p–n heterojunction provided an ohmic interface to enhance the separation of photogenerated electrons and holes.
 |
| | Fig. 10 Mechanism of the PDPB/SnO2 composite degradation of the RhB under solar light. | |
4. Conclusion
In summary, we used an in situ strategy to synthesize a PDPB/SnO2 p–n heterojunction that exhibited a high photocatalytic activity for the degradation of RhB under solar light irradiation owing to its excellent light harvesting and effective separation of electrons and holes. The chemical bonds of Sn–C generated on the interface of heterojunctions could decrease the bandgap of SnO2 and enhance the interaction between the two components. As a result, the as-prepared catalysts had a high solar-driven photocatalytic performance. Our study gives a facile strategy for the preparation of an organic–inorganic hybrid heterojunction with high solar light activity.
Acknowledgements
This study has been supported by the National Natural Science Foundation of China (21577036, 21377038, 21237003 and 21677048) and the State Key Research Development Program of China (2016YFA0204200) and sponsored by the “Chenguang Program” supported by the Shanghai Education Development Foundation and the Shanghai Municipal Education Commission (14CG30, 16JC1401400) and the Fundamental Research Funds for the Central Universities (22A201514021).
Notes and references
- Z. Zhu, X. Zheng and Y. Bai, Phys. Chem. Chem. Phys., 2015, 17(28), 18265–18268 RSC.
- X. Zheng, Q. Kuang, K. Yan, Y. Qiu, J. Qiu and S. Yang, ACS Appl. Mater. Interfaces, 2013, 5, 11249–11257 CAS.
- E. J. W. Crossland, N. Noel, V. Sivaram, T. Leijtens, J. A. Alexander-Webber and H. J. Snaith, Nature, 2013, 495, 215–219 CrossRef CAS PubMed.
- W. Jiao, Y. Xie, R. Chen, C. Zhen, G. Liu, X. Ma and H.-M. Cheng, Chem. Commun., 2013, 49, 11770–11772 RSC.
- S. Bao, Z. Wang, X. Gong, C. Zeng, Q. Wu, B. Tian and J. Zhang, J. Mater. Chem. A, 2016, 4, 18570–18577 CAS.
- Z. Yu, X. Wu, J. Wang, W. N. Jia, G. S. Zhu and F. Y. Qu, Dalton Trans., 2013, 42, 4633 RSC.
- A. Biaggi-Labiosa, F. Soĺa, M. Lebŕon-Coĺon, L. J. Evans, J. C. Xu and G. W. Hunter, Nanotechnology, 2012, 23, 455501 CrossRef CAS PubMed.
- F. Song, H. L. Su, J. Han, W. M. Lau, W. J. Moon and D. Zhang, J. Phys. Chem. C, 2012, 116, 10274–10281 CAS.
- Y. Jia, L. F. He, Z. Guo, X. Chen, F. L. Meng, T. Luo, M. Q. Li and J. H. Liu, J. Phys. Chem. C, 2009, 113, 958 Search PubMed.
- L. Etgar, P. Gao, Z. S. Xue, Q. Peng, A. K. Chandiran, B. Liu, M. K. Nazeeruddin and M. Gratzel, J. Am. Chem. Soc., 2012, 134, 17396 CrossRef CAS PubMed.
- S. Gubbala, V. Chakrapani and V. Kumar, et al., Adv. Funct. Mater., 2008, 18(16), 2411–2418 CrossRef CAS.
- C. B. Fitzgerald, M. Venkatesan and A. P. Douvalis, J. Appl. Phys., 2004, 95(11), 7390–7392 CrossRef CAS.
- Y. Zhao, Y. Zhang, J. Li and Y. Chen, Sep. Purif. Technol., 2014, 129, 90–95 CrossRef CAS.
- W. A. Badawy and H. H. Afify, J. Electrochem. Soc., 1990, 137(5), 1592–1595 CrossRef CAS.
- D. Liu and P. V. Kamat, J. Electrochem. Soc., 1995, 142(3), 835–839 CrossRef CAS.
- G. D. Wang, C. P. Wei and R. Y. He, Mater. Sci. Forum, 2016, 852, 1112–1117 CrossRef.
- N. D. M. Sin, M. F. Malek and M. H. Mamat, Int. J. Mater. Eng. Innovat., 2014, 5(2), 159–170 CrossRef.
- Y. C. Zhang, L. Yao, G. Zhang and D. D. Dionysiou, Appl. Catal., B, 2014, 144, 730–738 CrossRef CAS.
- M. T. Mayer, Y. Lin, G. Yuan and D. W. Wang, Acc. Chem. Res., 2013, 46, 1558–1566 CrossRef CAS PubMed.
- J. S. Jang, H. G. Kim and J. S. Lee, Catal. Today, 2012, 185, 270–277 CrossRef CAS.
- A. Kongkanand, K. Tvrdy, K. Takechi, M. Kuno and P. V. Kamat, J. Am. Chem. Soc., 2008, 130, 4007–4015 CrossRef CAS PubMed.
- D. R. Baker and P. V. Kamat, Adv. Funct. Mater., 2009, 19, 805–811 CrossRef CAS.
- Y. Wang, Nanoscale, 2013, 5, 8326–8339 RSC.
- L. Zhang, H. Zhang and H. Huang, New J. Chem., 2012, 36(8), 1541–1544 RSC.
- L. Zheng, Y. Zheng and C. Chen, Inorg. Chem., 2009, 48(5), 1819–1825 CrossRef CAS PubMed.
- Z. Zhang, C. Shao and X. Li, J. Phys. Chem. C, 2010, 114(17), 7920–7925 CAS.
- S. Ghosh, N. A. Kouamé and L. Ramos, Nat. Mater., 2015, 14(5), 505–511 CrossRef CAS PubMed.
- X. Zheng, Y. Lv and Q. Kuang, Chem. Mater., 2014, 26(19), 5700–5709 CrossRef CAS.
- G. Neri, C. Milone and S. Galvagno, Appl. Catal., A, 2002, 227(1), 105–115 CrossRef CAS.
- S. Sardar, P. Kar and H. Remita, Sci. Rep., 2015, 5, 17313 CrossRef CAS PubMed.
- J. Lei, L. Yang, D. Lu, X. Yan, C. Cheng, Y. Liu, L. Wang and J. Zhang, Adv. Opt. Mater., 2015, 3, 57–63 CrossRef CAS.
|
| This journal is © The Royal Society of Chemistry 2017 |
Click here to see how this site uses Cookies. View our privacy policy here. 
 Open Access Article
 This Open Access Article is licensed under a
  *
*