 Open Access Article
Creative Commons Attribution 3.0 Unported Licence
A solar cell for maximizing voltage up to the level difference of two photocatalysts: optimization and clarification of the electron pathway
Mao Yoshibaa,
Yuta Oguraa,
Masayuki Tambab,
Takashi Kojimab and
Yasuo Izumi *a
*a
aDepartment of Chemistry, Graduate School of Science, Chiba University, Yayoi 1-33, Inage-ku, Chiba 263-8522, Japan. E-mail: yizumi@faculty.chiba-u.jp; Fax: +81-43-290-2783; Tel: +81-43-290-3696
bDepartment of Applied Chemistry and Biotechnology, Graduate School of Engineering, Chiba University, Yayoi 1-33, Inage-ku, Chiba 263-8522, Japan
First published on 5th April 2017
Abstract
Fuel cells (FCs) and solar cells (SCs) are indispensable devices for a hydrogen energy society. The voltages obtained are less than 1 V per cell for most FCs and SCs. Herein, we use a recently developed SC comprising two photocatalysts. In principle, both TiO2 and BiOCl are photo-excited, and the energy difference between the conduction band (CB) minimum of TiO2 for excited electrons (−0.11 V) and the valence band (VB) maximum of BiOCl for holes (2.64 V) can provide a theoretical electromotive force of 2.75 V. This SC converts light energy into an electromotive force corresponding to the level difference of the two photocatalysts permanently mediated by the redox of water/O2. The diffusion overpotential of electrons in the photocatalysts (0.23–0.41 V) and the leakage current (0.38 V) are experimentally evaluated. The contact between the TiO2 film and ITO layer is improved by the better dispersion of the TiO2 suspension at a lower pH than that of the isoelectric point. Cyclic voltammetry data suggest the formation of O/Cl vacancy sites during the SC tests and the superiority of the rear orientation of the BiOCl photocatalyst on the cathode and effective photo-oxidation of water over TiO2, whereas impedance measurements suggest a smaller impedance for the tight and uniform TiO2 film in comparison to the porous BiOCl film. Thus, in the optimized configuration of the electrodes (irradiation from the other side of the photocatalyst), the leakage current and the diffusion overpotential in the catalyst layers are effectively suppressed to realize an open-circuit voltage of 1.91 V and cell output of 55.8 µW per 1.3 cm2.
1 Introduction
Fuel cells (FCs) and solar cells (SCs) are indispensable energy devices for a sustainable society, which do not emit CO2 and do not require fossil fuels, respectively.1 In principle, their open-circuit voltages (VOC) are determined on the basis of the difference in the reaction potentials at the electrodes for polymer electrolyte FCs2 and microbial FCs,3 the difference in the Fermi levels (EF) for Si SCs, the difference between the conduction band (CB) minimum and the reaction potential for dye-sensitized (DS) SCs,4,5 and the difference between the EF of perovskite and the highest occupied molecular orbital of hole transport materials for perovskite SCs.6,7 The maximum VOC for most FCs and SCs is 1 V per cell; however the series connection of these cells to obtain higher voltage values is complex and disadvantageous for portable and/or outdoor use.Thus, herein, an SC with an optimized VOC comprising two photocatalysts is designed. TiO2 and BiOCl are chosen as the photocatalysts for anode and cathode, and the energy difference between the CB minimum of TiO2 for excited electrons (−0.11 V) and the valence band (VB) maximum of BiOCl for holes (2.64 V) can provide a theoretical electromotive force of 2.75 V. TiO2 is an n-type semiconductor and advantageous to accept electrons from water during oxidation.16,17 In contrast, a p-type semiconductor is advantageous to transfer the photo-excited electrons to O2 molecules. The feasibility of these advantages of the n–p combination in the SC is demonstrated.16 In this study, the optimization of cell configuration, reason for the complex current–voltage dependence, fundamental understandings for the electron (e−) pathway in the SC, and reasons for the overpotential are clarified. In contrast to various photoFCs, the SC for the use of glucose,8,9 the SCs comprising a photoanode and a Pt-cathode,10,11 and photoelectrocatalytic cells,12–14 the developed SC directly extracts the V corresponding to the band-gap values (∼3 V) per cell without using fuel.
2 Experimental
2.1 Sample syntheses and preparation of photoelectrodes
A TiO2 organic/aqueous suspension (mean TiO2 particle size 15.6 ± 3.3 nm; PEC-TOM-T03, Peccell Technologies, Inc.) was placed on an indium tin oxide (ITO; thickness 0.12–0.15 µm)-coated Pyrex glass plate (area: 2.5 cm × 2.5 cm and thickness: 0.11 cm; Aldrich). The suspension was controlled to be acidic, below the isoelectric point of TiO2 (4.8–6.7), and well-dispersed by the repulsion of the positive charges of the TiO2 nanoparticles.15 The TiO2/ITO/Pyrex plate was dried at 373 K for 18 h and heated in air at 573 K for 30 min. The amount of TiO2 deposited on the ITO-coated glass plate was 2.0 mg, and it covered an area of 1.0 cm × 1.3 cm.BiOCl was synthesized from an aqueous solution.16,18 3.15 g bismuth trichloride (>97%; Wako Pure Chemical) was dissolved in 100 mL deionized water (<0.055 µS cm−1) supplied by a RFU424TA system (Advantec). The solution was agitated using ultrasound (430 W, 38 kHz) for 10 min and then magnetically stirred at 290 K in the dark for 2 h. The precipitate was filtered using a polytetrafluoroethylene-based membrane filter (Omnipore JVWP04700, Millipore; pore size 0.1 µm), washed with ethanol (total 200 mL), and dried at 353 K for 12 h.
The obtained BiOCl powder was suspended in 38 µL deionized water and placed on an ITO/Pyrex plate in a manner similar to that used for the TiO2/ITO/Pyrex. The amount of BiOCl placed on each ITO-coated glass plate was 2.5 mg, and it covered an area of 1.0 cm × 1.3 cm.
2.2 Characterization
Cross-sectional scanning electron microscopy (SEM) images were observed using a JSM-6510 scanning electron microscope (JEOL) at an accelerating voltage of 20 kV. A tungsten filament was used in the electron gun. The photocatalyst film on the ITO/Pyrex plate was cut and mounted on an aluminum sample holder using an adhesive. The incident angle of e−'s with reference to the normal of the sample surface was between 75° and 85°. The magnification was between 250 and 50![[thin space (1/6-em)]](https://www.rsc.org/images/entities/char_2009.gif) 000 times.
000 times.
X-ray diffraction (XRD) patterns were obtained for the photocatalyst powder and the film. In comparison, XRD was also performed on the ITO/Pyrex plate. The XRD patterns of the powder were measured at a Bragg angle of 2θB = 10–60° with a scan step of 0.02° and scan rate of 4 s per step using D8 ADVANCE (Bruker) operated at 40 kV and 40 mA with Cu Kα emission (wavelength λ = 0.15419 nm)19 and a nickel filter. The XRD patterns of the film were observed under similar conditions but with a scan rate of 0.1 s per step using a Mini Flex (Rigaku) operated at 30 kV and 15 mA. The mean particle size (t) was determined using the Scherrer equation
 | (1) |
2.3 SC tests
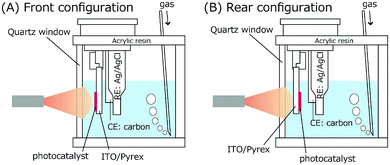
The TiO2/ITO/Pyrex and BiOCl/ITO/Pyrex electrodes were immersed in hydrochloric acid solutions (40 mL in each compartment, initial pH 2.0; Fig. 1). The two compartments were separated by a 50 µm-thick H+-conducting polymer film (Nafion, DuPont; acid capacity > 9.2 × 10⁻⁴ equivalent per g−1). N2 and O2 gases were bubbled 30 mm away from each photoelectrode at a flow rate of 100 mL min−1. The distance was fixed both in the front and rear configurations for the photocatalysts (Fig. 1). The SC was equipped with quartz windows (Φ = 80 mm) on both sides. Both the TiO2 and BiOCl photocatalysts were irradiated with UV-visible light through the quartz windows using a two-way branched quartz fiber light guide (Model 5Φ-2B-1000L, San-ei Electric Co.) from a 500 W xenon arc lamp (Model SX-UID502XAM, Ushio). The distance between the light exit (Φ = 5 mm) and the surface of the TiO2 or BiOCl film was 46 mm. The light intensity was 91.3 mW cm−2 at the center of the photocatalyst film on each electrode (Fig. 2).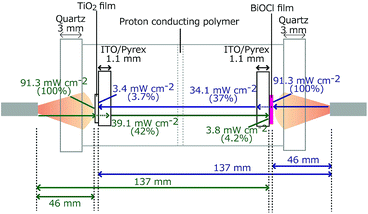 | ||
| Fig. 2 The light intensity at the photocatalyst (left: 2.0 mg of TiO2 and right: 2.5 mg of BiOCl), on the other side of the ITO/Pyrex electrode, and at the photocatalyst on the other side of the SC. | ||
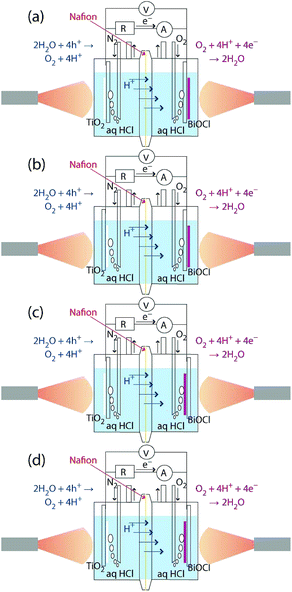
The dependence of the i–V curves on the configuration of the anode and cathode was tested in four combinations, as depicted in Fig. 1a–d, with an N2 and O2 flow. As a control, 40 mL of hexane layer was added on the top of the aqueous HCl layer (40 mL) in the anode and the two compartments of anode and cathode were flowed with N2 and O2, respectively. Furthermore, the gas supply was stopped, and the compartments were isolated before the start of the i–V test.
The i–V dependence by the irradiation of one electrode only was monitored in the front–front configuration (Fig. 1a), in which the rear sides of the electrodes were covered by a 3 mm-thick polytetrafluoroethylene (PTFE) plate (area = 2.0 cm × 2.0 cm). As a control, PTFE plates were not used and only the cathode was irradiated in the i–V test for the practical feasibility of irradiation from one side only.
Static photocurrent generation tests were performed by connecting the external parallel circuit for one route via a voltmeter and for another route via an ammeter with a resistance of 0.5 Ω (Fig. 1). Both catalysts were exposed to UV-visible light for 30 min and then kept in the dark for 30 min, and this process was repeated five times. The i–V characteristics were obtained by changing the resistance between the two electrodes from 500 kΩ to 0.3 Ω over 30 min for the four anode–cathode configurations (Fig. 1a–d).
2.4 [Photo]electrochemical measurements
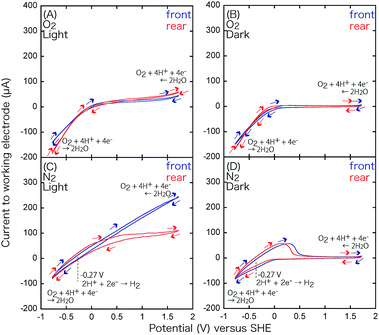
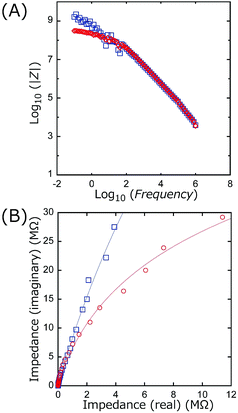
Cyclic voltammetry (CV) measurements were performed for TiO2 and BiOCl as the working electrode (WE; TiO2/ITO/Pyrex or BiOCl/ITO/Pyrex and an Au/Ni-coated stainless clip; Toyo Corporation), glassy carbon as the counter electrode (CE; Model 002012, Φpolyetheretherketone: 6.0 mm, ΦC: 3.0 mm; BAS Incorporation), and Ag/AgCl as the reference electrode (RE; Model RE-1B, BAS Incorporation), immersed in an HCl solution of pH 4.0 (Fig. 3). The voltage of the WE was swept between −1.00 and 1.50 V for TiO2, −1.22 and 1.50 V for BiOCl versus Ag/AgCl at a rate of 50 mV s−1 using a potentio/galvanostat (VersaSTAT 3-100, Princeton Applied Research) in either an O2 or a N2 atmosphere at a flow rate of 500 mL min−1 irradiated with UV-visible light (91.3 mW cm−2 at the WE sample position) or in the dark.Impedance measurements were performed for TiO2 (mean thickness 4.7 ± 0.3 µm) and BiOCl (mean thickness 5.4 ± 1.9 µm) on ITO/Pyrex plates using a potentio/galvanostat (VSP, Bio-Logic). A Cu plate (area 0.28 cm2) was attached on these photocatalyst films, and the impedance between the Cu plate and ITO film was monitored using Au-coated Cu probes (KPRO-RY, Toyo Corporation). The applied alternative voltage was 500 mV, and the frequency was scanned between 10−1 Hz and 106 Hz.
The light transmission was checked using a photosensor and a counter (PCM-01, Prede and KADEC-UP, North One, respectively). The quartz windows of the SC absorbed/reflected 8.7% of the light, and 2.0 mg of the TiO film and 2.5 mg of the BiOCl film both on ITO/Pyrex absorbed/reflected/scattered 58% and 63% of the light, respectively. Moreover, 3.7–4.2% of the light reached the electrode on the other side (Fig. 2).
3 Results and discussion
3.1 Characterization
TiO2 and BiOCl photocatalyst films were formed over indium tin oxide (ITO)-coated Pyrex glass plates, as observed by cross-sectional SEM (Fig. 4). The film area was 1.0 cm × 1.3 cm, and the mean thickness of the photocatalysts was 4.7 ± 0.3 µm for TiO2 (Fig. 4A2) and 5.4 ± 1.9 µm for BiOCl (Fig. 4B2). The TiO2 nanoparticles (mean particle size = 15.6 nm ± 3.3 nm) were closely packed via an acidic well-dispersed suspension to constitute uniform layers (Fig. 4A), whereas the BiOCl particles (mean size = 127 ± 43 nm) were less packed via a neutral aqueous suspension and showed porosity (Fig. 4B).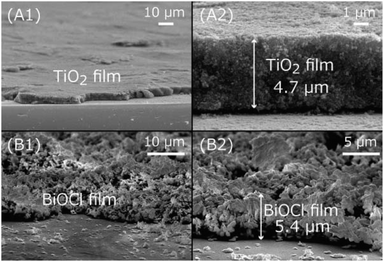 | ||
| Fig. 4 Cross-sectional SEM images of TiO2 (A) and BiOCl (B) particles in wide (1) and close (2) views. | ||
The XRD patterns of the powder and the TiO2 and BiOCl films were obtained (Fig. 5). Four peaks appear at 2θB = 21.4, 30.3, 35.4, and 50.5° for ITO/Pyrex (Fig. 5A), which are assigned to the 2 1 1, 2 2 2, 4 0 0, and 4 4 0 diffractions of the ITO film, respectively. The broad peak at 20–30° is due to the amorphous phase of the Pyrex glass.
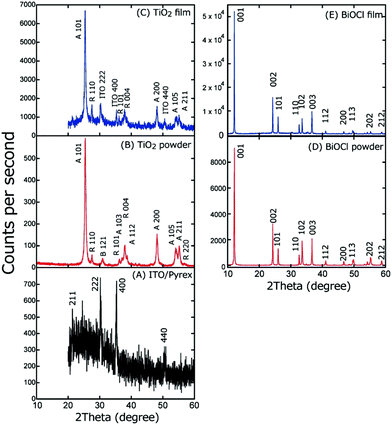 | ||
| Fig. 5 XRD pattern of (A) ITO/Pyrex, (B) TiO2 powder, (C) TiO2 film on ITO/Pyrex, (D) BiOCl powder, and (E) BiOCl film on ITO/Pyrex. | ||
Fig. 5B depicts the XRD pattern of the TiO2 powder. Peaks appear at 2θB = 25.4, 37.1, 38.7, 48.0, 53.9, and 55.1°, which are assigned to the 1 0 1, 1 0 3, 1 1 2, 2 0 0, 1 0 5, and 2 1 1 diffractions of the anatase phase, respectively. In addition, peaks appear at 2θB = 27.5, 36.1, 38.0, and 56.8°, which are assigned to the 1 1 0, 1 0 1, 0 0 4, and 2 2 0 diffraction of the rutile phase, respectively, and a peak appears at 2θB = 31.0° and is assigned to the 1 2 1 diffraction of the brookite phase.
In contrast, for the TiO2 film on ITO/Pyrex (Fig. 5C), the 1 0 1, 2 0 0, 1 0 5, and 2 1 1 diffraction peaks at 2θB = 25.4, 48.1, 54.0, and 55.1° due to the anatase phase, the 1 1 0, 1 0 1, and 0 0 4 diffraction peaks at 2θB = 27.5, 36.2, and 37.9° due to the rutile phase, and the 2 2 2, 4 0 0, and 4 4 0 diffraction peaks at 2θB = 30.3, 35.3, and 50.6° due to the ITO film appear. The peak intensity ratios in the XRD patterns of the TiO2 powder and the TiO2 film are listed with reference to the 1 0 1 peak intensity (Table 1A). Furthermore, the intensity ratio of the corresponding peaks for film versus powder was also calculated, as listed in Table 1A. Clearly, based on the values, the thermodynamically unstable 2 0 0, 1 0 5, and 2 1 1 planes of the anatase phase are unfavorable in the TiO2 film, contrary to the thermodynamically stable 1 1 0 and 1 0 1 planes of the rutile phase that are significantly favoured because the TiO2/ITO/Pyrex electrode was heated in air at 573 K and stabilized prior to the characterization and SC tests. Thus, the thermodynamically stable planes of TiO2 were prioritized during the preparation of the TiO2 film on ITO/Pyrex (see Section 2.1).
| (A) TiO2 | ||||
|---|---|---|---|---|
| TiO2 | Peak intensity ratio | |||
| Crystal phase | Diffraction plane | Film | Powder | Film/powder |
| Anatase | 1 0 1 | 1.00 | 1.00 | 1.00 ± 0.03 |
| 2 0 0 | 0.18 | 0.26 | 0.71 ± 0.10 | |
| 1 0 5 | 0.10 | 0.15 | 0.66 ± 0.17 | |
| 2 1 1 | 0.11 | 0.17 | 0.65 ± 0.15 | |
| Rutile | 1 1 0 | 0.20 | 0.10 | 1.99 ± 0.26 |
| 1 0 1 | 0.10 | 0.05 | 1.95 ± 0.48 | |
| 0 0 4 | 0.16 | 0.17 | 0.92 ± 0.15 | |
| (B) BiOCl | |||
|---|---|---|---|
| BiOCl | Peak intensity ratio | ||
| Diffraction plane | Film | Powder | Film/powder |
| 0 0 1 | 3.37 | 2.84 | 1.18 ± 0.01 |
| 0 0 2 | 1.00 | 1.00 | 1.00 ± 0.01 |
| 1 0 1 | 0.47 | 0.40 | 1.17 ± 0.02 |
| 1 1 0 | 0.25 | 0.25 | 1.01 ± 0.04 |
| 1 0 2 | 0.42 | 0.59 | 0.71 ± 0.02 |
| 0 0 3 | 0.61 | 0.64 | 0.95 ± 0.01 |
In the XRD patterns of both the powder and the film of BiOCl (Fig. 5D and E), peaks at 2θB = 12.1, 24.3, 26.0, 32.7, 33.6, 36.7, 41.0, 46.8, 49.8, 55.3, and 58.8° appeared and were assigned to the 0 0 1, 0 0 2, 1 0 1, 1 1 0, 1 0 2, 0 0 3, 1 1 2, 2 0 0, 1 1 3, 2 0 2, and 2 1 2 diffraction of the tetragonal structure of BiOCl, respectively.20 The peak intensity ratio in each XRD pattern for the BiOCl powder and film is listed with reference to the 0 0 2 peak intensity (Table 1B). Furthermore, the intensity ratio of the corresponding peaks of the film versus the powder was also calculated (Table 1B). Based on the values, the thermodynamically stable 0 0 1 and 1 0 1 faces are favored, whereas the thermodynamically unstable 102 face is unfavourable due to the heating at 573 K in air prior to the characterization and SC tests.
3.2 i–V dependence of SC
 | ||
| Fig. 6 i–V dependence curves of SC comprising TiO2 and BiOCl photocatalysts in four configurations of anode and cathode, as illustrated in Fig. 1a–d(A), in the front–rear configuration and a hexane layer (40 mL) added on the aqueous layer in the anode (B), and (a) when both electrodes are irradiated, (a′) when only the anode is irradiated, and (a″) when only the cathode is irradiated in the front–front configuration (Fig. 1a) (C). i–V dependence curve when only the anode (a′) or cathode (a″) is irradiated in the front–front configuration (D). N2 and O2 gases were supplied to the anode and cathode in tests A, C, and D while the compartments of the anode and cathode were purged by N2 and O2, respectively, and isolated in test B. The rear sides of the electrodes were covered by PTFE plates in tests C whereas PTFE plates were not used in tests A, B, and D. | ||
| (A) Dependence on the anode–cathode configuration | |||||||
|---|---|---|---|---|---|---|---|
| Entry | Configuration of photocatalysts to UV-visible light | N2, O2 supply | VOC (V) | iSC (µA) | PMAX (µW) | ATotal (µW) | |
| Anode | Cathode | ||||||
| a The area of the photocatalysts: 1.3 cm2.b Hexane (40 mL) was on the top of aqueous HCl (40 mL) in the anode.c Both electrodes were irradiated from the photocatalyst side, but the rear side was covered by 3 mm-thick plastic plates. | |||||||
| a | Front | Front | Flowed | 1.43 | 186 | 53.9 | 99.3 |
| b | Rear | Front | 1.66 | 66.7 | 23.8 | 43.6 | |
| c | Front | Rear | 1.84 | 85.0 | 55.0 | 92.1 | |
| c′b | Closed | 1.84 | 84.4 | 43.7 | 84.4 | ||
| d | Rear | Rear | Flowed | 1.88 | 84.4 | 55.8 | 93.0 |
| (B) Dependence on the UV-visible irradiation to anode and/or cathodec | |||||||
|---|---|---|---|---|---|---|---|
| Entry | Presence/absence of light irradiation | N2, O2 supply | VOC (V) | iSC (µA) | PMAX (µW) | ATotal (µW) | |
| Anode | Cathode | ||||||
| a | Light | Light | Flowed | 1.56 | 163 | 53.4 | 103 |
| a′ | Light | Dark | 0.38 | 79.6 | 2.80 | 7.61 | |
| a″ | Dark | Light | 0.28 | 1.5 | 0.29 | 0.31 | |
| a″′ | Dark | Dark | <0.01 | <0.1 | <0.01 | <0.01 | |
Next, the TiO2 film was positioned on the rear side toward the irradiation of light, while the BiOCl film remained on the front side toward the light (Fig. 1b). Although the VOC value increased to 1.66 V, both the convex and linear characteristics in the entire V range and the range below 0.3 V, respectively, were suppressed and resulted in an iSC of 66.7 µA and a maximum power (PMAX) of 23.8 µW corresponding to 36% and 44% of the original values (Fig. 1a), respectively (Table 2A-a and b). Thus, the number of effectively excited e−'s at the anode was smaller than the number of holes at the cathode, and the i value of SC was determined by the former number. The decrease in the number of excited e−'s at the anode in Fig. 1b is attributed to the following: (1) the filtering of the light by the ITO/Pyrex electrode in front of TiO2 in the rear configuration and (2) to the fact that only the TiO2 catalyst layer near the ITO electrode contributed to the supply of excited e−'s, and the holes photo-oxidized water (Fig. 1b), whereas most of the TiO2 catalyst was utilized in the frontal configuration (Fig. 1a). Compared to the total absorption, scattering, and/or reflection of TiO2/ITO/Pyrex (63%, Fig. 2), the absorption, scattering, and/or reflection of the ITO film and Pyrex plate were 8.0% and 0.7%, respectively. Thus, the contribution of the ITO film in the rear configuration is not negligible but that of TiO2 (thickness 4.7 ± 0.3 µm) is predominant under the conditions of this study. Conversely, the overpotential due to the diffusion of e−'s in the catalyst layer was minimal in the rear configuration of the anode (Scheme 1, left), leading to an increase in the VOC value by 0.23 V (Table 2A-a and b).
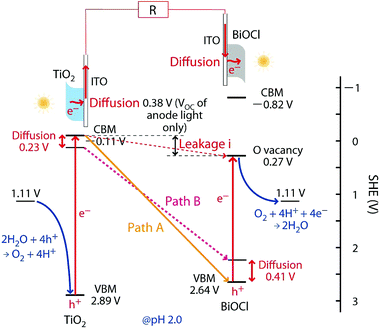 | ||
| Scheme 1 Energy diagram and e− flow paths for the SC comprising TiO2 and BiOCl. Path A provides the optimized electromotive force in the rear–rear configuration of the anode and the cathode toward the UV-visible light irradiation (Fig. 1d) owing to an effective charge combination at the interface between the electrodes and the photocatalysts, whereas path B provides the same in the front–front configuration (Fig. 1a). The leakage current from the CB of TiO2 to the OV sites of BiOCl is also indicated. | ||
Then, the BiOCl photocatalyst film was positioned on the rear side toward the irradiation of light, while the TiO2 film was irradiated from the front side (Fig. 1c). Considering the i–V dependence at the front–front configuration (Fig. 1a), the convex curve expanded to a higher V range (Fig. 6A-a and c), resulting in a maximal VOC of 1.84 V (Table 2A-c). The linear i increase in the range below 0.4 V was mostly suppressed below 20 µA, and the i–V dependence became similar to that for Si SCs and DSSCs. The improvement in the complex i–V curve, as in Fig. 6A-a, to a simple convex curve, as in Fig. 6A-c and d is similar to the improvement in a series combination of different SCs, in which their impedance was not matched very well or in which a part of the SC was shaded.21,22 Further improvement would be possible, particularly by the control of uniformity of the BiOCl film and the secure interface between BiOCl and the electrode.
The total e− flow from the anode to cathode during an i–V test was
 | (2) |
The PMAX and ATotal values shown in Fig. 1a were essentially preserved in the results shown in Fig. 1c (changing by 1.02 and 0.93 times, respectively; Table 1A-a and c) and Fig. 6A-c, substituting the increase in the VOC value for the linear increase to iSC in Fig. 6A-a in the V range below 0.4 V.
In the rear configuration of the cathode, the photoexcited e−'s were transferred from TiO2 to the cathode and were quickly combined with the remaining holes at the VB of the BiOCl film near the cathode (Scheme 1, right). The holes in the VB of BiOCl tended to concentrate near the interface with the ITO due to the band-bending of the p-type semiconductor (Scheme 1, right),16 and the shorter diffusion length of e−'s at the interface in the cathode enabled greater VOC values (Table 2A-c).
Finally, the rear–rear configuration for the TiO2 and BiOCl photocatalysts (Fig. 1d) was tested. The dependence curve was essentially identical to that of the front–rear configuration (Fig. 6A-c and d). Thus, the number of effective holes at the cathode in Fig. 1c and d (rear configuration) would be smaller than the number of excited e−'s at the anode, and the i value of SC was determined by the former number.
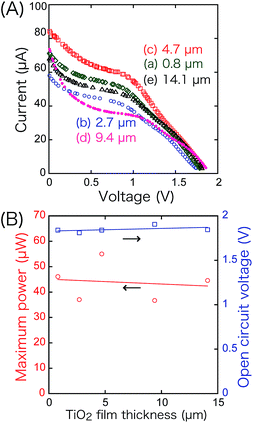
Associated with this, the thickness of the TiO2 layer (4.7 ± 0.3 µm) on the anode varied between 0.8 and 14.1 µm in the front–rear configuration (Fig. 7). The VOC (1.81–1.91 V) and PMAX values (36.7–55.0 µW) were almost independent of the thickness and in agreement with the hypothesis in the previous paragraph that the i value of the SC is determined by the number of holes at the cathode in Fig. 1c and d.
As a future option of this SC, which does not need a gas supply, N2 and O2 gases were first flowed to the anode and cathode in the front–rear configuration (Fig. 1c) at a rate of 100 mL min−1 and then stopped prior to the i–V test (Fig. 6B). 40 mL of hexane on the top of HCl aqueous solution in the anode compartment was also used to circulate the photocatalytically formed O2.23 The obtained electrochemical data (VOC 1.84 V, iSC 84.4 µA, ATotal 84.4 µW; Table 2A-c′) is quite similar to that for the test under gas flow (Table 2A-c) within the variance of 0.916–1.00 times; however, the PMAX value in the closed SC was 79.5% of that in the SC with a gas flow. Since the number of holes at the cathode determine the i value of the SC in the front–rear configuration, the ATotal value is essentially preserved in the results shown in Fig. 6A-c and B and Table 2A-c and c′ independent of the changes in the anode conditions (N2 flow stopped and upper hexane layer in the anode versus essentially no effect of abundant O2 flow stopped).
The i–V dependence in the front–front configuration (Fig. 6A-a) is reproduced in Fig. 6C-a, in which the VOC, PMAX, and ATotal values are essentially the same within the variance of 0.99–1.09 times, whereas the iSC value decreases by a factor of 0.88 times due to the light being blocked from the rear side by the PTFE plate (Table 2A-a and B-a).
When only the anode was irradiated with UV-visible light, a current as high as 79.6 µA was observed only in the V range below 0.4 V (Fig. 6C-a′), and the ATotal value decreased by a factor of 0.074 times compared to that obtained under light irradiation from both sides (Table 2B-a and a′). Testing the front–front configuration, we observed a sharp linear i increase at the V range below 0.4 V (Fig. 6A-a and C-a). Thus, the linear i increase at the low-V region is a leakage current from the CB of TiO2 on the anode to the O vacancy (OV) sites in BiOCl on the cathode (Scheme 1). Conversely, when only the cathode was irradiated (Fig. 6C-a″), the VOC, iSC, PMAX, and ATotal values were only 0.3–18% of the corresponding values for Fig. 6C-a due to the polarization of TiO2.
The future feasibility of irradiation from one side only was also tested when the PTFE plates on the rear side of the electrodes were not used under the conditions of irradiation of anode only (Fig. 6D-a′) and cathode only (Fig. 6D-a″). The iSC values were satisfactory in the former (134 µA) compared to values for the tests where irradiation was from both sides (186–66.7 µA; Table 2A); however, the convex section was suppressed in these tests because the UV-visible light spot from the fibers in this study (Fig. 2) tended to extend (the spot radius was two times at 9.2 mm from the light exit), and only 3.7–4.2% of light reached the electrode on the other side (Fig. 2). This problem would be partially mitigated by use under sunlight or translatory, parallel light.
Scheme 1 illustrates the band-gaps of 3.00 V and 3.46 V (ref. 16 and 20) for the TiO2 and BiOCl photocatalysts, respectively. The potential for surface reactions between water and O2 (1.11 V, pH 2.0) occurring on both electrodes is also presented. The difference in the VOC values obtained for front irradiation (Fig. 1a) and rear irradiation (Fig. 1b) toward TiO2 on the anode allows us to evaluate the effective diffusion overpotential for e−'s in the TiO2 layer to the electrode in the front configuration (0.23 V) compared to direct e− injection into electrode in the rear configuration (Table 2A-a and b and Scheme 1, left). Similarly, the difference in the VOC values obtained for front irradiation (Fig. 1a) and rear irradiation (Fig. 1c) toward BiOCl on the cathode can be used to evaluate the effective diffusion overpotential in BiOCl from the electrode to the reduction sites of O2 in the front configuration (0.41 V), compared to the direct charge recombination of the e−'s and the holes at the interface between the electrode and the BiOCl layer (Table 2A-a and c, and Scheme 1, right). Associated with this, greater impedance is observed for the BiOCl film compared to that for the TiO2 film (see Section 3.4.3).
Moreover, the EF for ITO (4.12–4.78 eV with reference to vacuum) is also considered.24 Compared to the CB minimum for TiO2 (4.33 eV versus vacuum), a voltage loss of 0–0.45 V during photoexcited e− diffusion from TiO2 to ITO and then to the circuit is plausible. Thus, the theoretical electromotive force in the front–front configuration (Fig. 1a) is 2.11–1.66 V (Scheme 1, path B), whereas in the rear–rear configuration (Fig. 1d) it is greater: 2.75–2.30 V (Scheme 1, path A). Compared to the experimental VOC values (1.43 and 1.88 V; Table 2A-a and d), unknown overvoltage values of 0.68–0.23 V and 0.87–0.42 V, respectively, are observed, presumably due to the resistance between the photocatalysts and electrodes. Particularly, the porosity, size and configuration of the BiOCl film's crystals (Fig. 2B) need to be optimized for better e− transfer at the interface.
The VOC value for the leakage currents from the anode to the OV sites was also evaluated (0.38 V, Fig. 6C-a′ and Table 2B-a′) by irradiating only the anode. This value accordingly gave the potential of the OV sites [0.27 V versus standard hydrogen electrode (SHE); Scheme 1] which was almost consistent with the values based on density functional calculations (−0.25 to 0 V).16,18,25
3.3 Photocurrent changes of SC
In the front–front anode–cathode configuration (Fig. 1a), the photocurrent quickly increased in response to UV-visible light irradiation, reaching 176, 179, 180, 183, and 190 µA in the first, second, third, fourth, and fifth cycles of irradiation, respectively (Fig. 8a). The photocurrent quickly decreased to zero when the irradiation was stopped. The gradual increase in the converged photocurrents in five cycles could be related to the OV sites' increase in BiOCl when the irradiation under UV-visible light was continued, as evidenced by the Bi L3-edge extended X-ray absorption fine structure (EXAFS; the decrease in Bi–O atomic pairs starting from 4 to 2.2).16 OV sites are considered active sites for O2 reduction (Scheme 1, right), but also effective e− receptors from the anode resulting in a leakage current. Namely, the photocurrents in Fig. 8a included a significant portion of leakage currents (Scheme 1) because the resistance was 0.5 Ω (Fig. 1a), which is near the lower limit in the i–V tests (500 kΩ–0.3 Ω; Fig. 6A-a).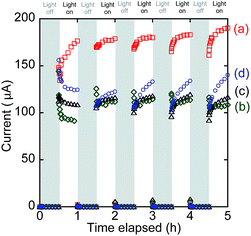 | ||
| Fig. 8 Time course of the SC comprising both TiO2 and BiOCl photocatalysts. (a) Front–front, (b) rear–front, (c) front–rear, and (d) rear–rear configuration (see Fig. 1a–d). | ||
The static photocurrent test in the rear–front configuration (Fig. 1b) is plotted in Fig. 8b, which corresponds to the i–V test shown in Fig. 6A-b. The converged currents were 91.3, 112, 114, 114, and 109 µA in the five irradiation cycles, and they were apparently suppressed in comparison to the ones shown in Fig. 6A-a in the front–front configuration because of the light filtering by the electrode in front of TiO2. Thus, only the TiO2 photocatalyst layer in the proximity of the ITO electrode contributed to the photocurrents.
The photocurrents (109–120 µA) in the front–rear configuration (Fig. 8c) were more stabilized and slightly improved in comparison to those in the rear–front configuration (Fig. 8b).
Finally, the photocurrents in the rear–rear configuration gradually increased from 125, 123, 133, 134, and 140 µA in the five irradiation cycles (Fig. 8d) mostly due to the increase in the active OV sites in BiOCl similar to the test in the front–front configuration (Fig. 8a). The order of converged i values in Fig. 8 is consistent with that of iSC (Table 2A):
| a (front–front) > d (rear–rear) ∼ c (front–rear) > b (rear–front) | (3) |
The converged currents in Fig. 8b–d were 1.66–1.41 times greater than the corresponding iSC values (Table 2A) because of the difference in the total irradiation time resulting in a higher concentration of OV sites, which was 150 min during the static photocurrent tests (Fig. 8) versus 30 min during the i–V tests (Fig. 6A).
3.4 CV and impedance measurements for the photoelectrodes
| BiOCl + 2H+ + 3e− ⇄ Bi + Cl− + H2O | (4) |
| Redox reaction conditions | CV peak (V) versus SHE | Equilibrium voltage@298 K, pH 4.0 | ||
|---|---|---|---|---|
| Reduction wave | Oxidation wave | Center | ||
| (A) BiOCl + 2H+ + 3e− = Bi + Cl− + H2O | ||||
| O2, light | — | — | — | 0.0909 |
| O2, dark | −0.42 | — | — | |
| N2, light | −0.42 | 0.49 | 0.04 | |
| N2, dark | −0.42 | 0.49 | 0.04 | |
![[thin space (1/6-em)]](https://www.rsc.org/images/entities/char_2009.gif) |
||||
| (B) Bi3+ + 3e− = Bi | ||||
| O2, light | — | — | — | 0.3172 |
| O2, dark | — | — | — | |
| N2, light | −0.25 | 0.93 | 0.34 | |
| N2, dark | — | — | — | |
![[thin space (1/6-em)]](https://www.rsc.org/images/entities/char_2009.gif) |
||||
| (C) 2H+ + 2e− ⇄ H2 | ||||
| O2, light | −0.24 | |||
| O2, dark | ||||
| N2, light | −0.27 | — | — | |
| N2, dark | −0.27 | — | — | |
![[thin space (1/6-em)]](https://www.rsc.org/images/entities/char_2009.gif) |
||||
| (D) O2 + 2H+ + 2e− ⇄ H2O | ||||
| O2, light | <0.1 | >1.6 | — | 0.993 |
| O2, dark | <0.1 | >1.6 | — | |
| N2, light | — | — | — | |
| N2, dark | — | >1.6 | — | |
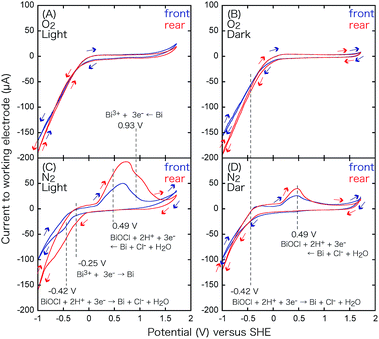
Under these conditions, a part of the Cl− of BiOCl dissolves in aqueous HCl,24 and the oxidation peak for BiOCl at 0.49 V becomes more pronounced. The minor difference of the peak intensity in the two configurations may be because the supplied N2 gas diffuses and purges O2 more effectively in the rear configuration rather than in the front configuration (Fig. 3) and facilitates the dissolution of Cl−.
Under UV-visible light irradiation and an N2 atmosphere, the pair of peaks at 0.49 V and −0.42 V becomes more pronounced (Fig. 9C and Table 3A) due to the photodissolution of Cl−, which is in accordance with previous observations26 and EXAFS measurements under light, demonstrating the decrease in the Bi–Cl interatomic pair.16 A new pair of peaks appears at 0.93 and −0.25 V, particularly in the rear configuration. The center (0.34 V; Table 3B) is essentially identical with the equilibrium voltage at 298 K, pH 0 (0.3172 V; Table 3B) for eqn (5).
| Bi3+ + 3e− ⇄ Bi | (5) |
The CV curve in Fig. 9C suggests the presence of reduced Bi(3−2x−y)+O1−xCl1−y, particularly in the rear configuration because of the faster e− transfer between the electrode and BiO1−xCl1−y. The faster e− transfer should be related to the higher VOC values obtained in the rear configuration of BiOCl in Fig. 1c and d (1.84–1.88 V; Table 2A-c and d).
In the dark and an O2 atmosphere (Fig. 9B), only a very weak reduction peak appears at −0.42 V (Table 3A) via eqn (4), which suggests that BiOCl is stabilized under O2. Under light and an O2 atmosphere (Fig. 9A), the redox of the Bi0/3+ species via eqn (4) and (5) disappears completely. Nevertheless, minor O and Cl vacancy sites are observed under these conditions by in situ EXAFS and can form active sites for O2 reduction.16,18,27,28 The O2 reduction reaction is indirectly monitored as the more negative slope of the reduction wave in Fig. 9A and B, in comparison to that in Fig. 9C and D, in the V range below −0.4 V. However, the slope is exclusively dependent on the potential and independent of light irradiation (Fig. 9A and B). The electrode configuration exhibits only a minor effect on the slope. The advantage of the rear configuration for BiOCl (Fig. 6A-c and d) may be the stabilization of BiOCl by O2 in the rear configuration (Fig. 1c and d) rather than in the front configuration (Fig. 1a and b) because the photocatalyst faces the O2 supply source and suppresses the number of OV sites, resulting in less leakage current to the OV sites (Scheme 1) in the rear configuration (Fig. 1c and d, and 3).
| 2H+ + 2e− ⇄ H2 | (6) |
Under UV-visible light irradiation and a N2 atmosphere (Fig. 10C), peaks at −0.27 V also appear owing to H+ oxidation (Table 3C).
In the dark and an O2 atmosphere (Fig. 10B), no distinct peaks appear; however, the reduction wave is significantly enhanced to −150 µA, demonstrating the electro-reduction of O2 to H2O.
| O2 + 2H+ + 2e− ⇄ H2O | (7) |
The equilibrium voltage of eqn (7) was 0.993 V at 298 K, pH 4.0 (Table 3D),16 but it was difficult to compare it to the negative slope in Fig. 10B. Under light and an O2 atmosphere (Fig. 10A), the O2 reduction was again monitored as the more negative slope of the reduction wave; however, the slope was exclusively dependent on the potential. Conversely, water oxidation (reverse reaction of eqn (7)) was clearly accelerated in the oxidative wave in the V range above 1.5 V (Fig. 10A) by UV-visible light irradiation in comparison to the CV curve under O2 and dark conditions (Fig. 10B), which demonstrates the effective photo-oxidation by TiO2 on the anode (Scheme 1, left).
The CV for the electrode comprising the TiO2 film in the rear configuration (Fig. 10, red) was basically similar to that for the electrode in the front configuration (Fig. 10, blue). The only clear difference was the steeper slope in the oxidation wave for the front configuration under N2 and UV-visible light (Fig. 10C) because most of the TiO2 was utilized in the front configuration (Fig. 3A), that is under the condition of the anode of the SC, versus some of the UV-visible light was absorbed by the electrode and only the TiO2 in the proximity of the electrode participated in the H2O oxidation in the rear configuration (Fig. 3B). This difference supports the different efficiencies of the i–V dependence in Fig. 6A-a (front–front configuration) and 6A-b (rear–front configuration).
3.5 Efficiency of the SC comprising two photocatalysts
The incident light intensity was 91.3 mW (see Section 2.3) at the center of the photocatalyst film on the electrodes. The quantum efficiency of this SC was evaluated based on the amount of incident light (1.7 × 10¹⁷ photons per s−1)29,30 absorbed (6.9%) by the photocatalyst to photocatalyst layers and the iSC value (186 µA ∼ 1.2 × 10¹⁵ e−' per s s−1). The overall efficiency that was evaluated as the cell current per absorbed photons was 0.096, and this could be considered as the result of the anode (TiO2) and cathode (BiOCl) efficiencies.16,17 The cell currents were created by the combination of excited e−'s formed at the CB of the anode with holes formed at the VB of the cathode. If a similar efficiency was assumed for the e−'s at the anode and the holes at the cathode, the product of 0.31 × 0.31 would be 0.096. By the optimization of the SC in the rear–rear configuration as well as the intimate connection between TiO2 and the ITO layer (Scheme 1), the efficiency of the preliminary SC comprising TiO2 and Ag–TiO2 (0.04)17 and that comprising TiO2 and BiOCl (0.024)16 was improved to 0.096 in this study.The intimate contact between TiO2 and the ITO/Pyrex anode was clearly strengthened by the positive charge repulsion in the acidic suspension of TiO2 and dispersion to constitute a uniform film (Fig. 4A) in contrast to the neutral aqueous suspension of TiO2 and Ag–TiO2 in preliminary SCs.16,17 Thus, the contact between BiOCl and ITO should be improved to suppress the overvoltage of 0.87–0.42 V for the SC in this study in the rear–rear configuration (Scheme 1) other than the voltage loss due to e− diffusion in the photocatalyst layers and the EF for the ITO layer to realize the VOC of 2.75–2.30 V per cell.
4 Conclusions
An SC comprising two photocatalysts, TiO2 and BiOCl, enables the VOC of 1.91 V and PMAX of 55.8 µW per cell (1.3 cm2) in the optimized rear configuration of the anode and the cathode, eliminating the diffusion overvoltage of 0.23 V and 0.41 V in the photocatalyst layer and suppressing the leakage current (0.38 V) directly from the CB of TiO2 to the OV sites of BiOCl. XRD suggests the preferable exposure of the stable crystal faces of the TiO2 and BiOCl films used in the SC. The balance of the number of excited electrons at TiO2 and that of remaining holes at BiOCl determine the iSC values in each configuration of the photoelectrodes. The CV data support the formation of OV sites in BiOCl during the SC tests and the superiority of the rear configuration, whereas the impedance data suggest a smaller impedance for a tight and uniform TiO2 film in comparison to the porous BiOCl film. The efficiency of this optimized SC was improved to 0.096.Acknowledgements
For this study, the authors received financial support from Grant-in-Aid for Scientific Research C (26410204) from the Japan Society for the Promotion of Science, Feasibility Study Stage of A-STEP (AS262Z00159L, AS251Z00906L) from the Japan Science and Technology Agency, and the Leading Research Promotion Program (2015–) from the Institute for Global Prominent Research, Chiba University.References
- Y. Izumi, Coord. Chem. Rev., 2013, 257, 171–186 CrossRef CAS.
- M. Kawase, K. Sato, R. Mitsui, H. Asonuma, M. Kageyama, K. Yamaguchi and G. Inoue, AIChE J., 2017, 63, 249–256 CrossRef CAS.
- S. V. Mohan, G. Velvizhi, J. A. Modestra and S. Srikanth, Renewable Sustainable Energy Rev., 2014, 40, 779–797 CrossRef.
- M. A. M. Al-Alwani, A. B. Mohamad, N. A. Ludin, A. A. H. Kadhum and K. Sopian, Renewable Sustainable Energy Rev., 2016, 65, 183–213 CrossRef CAS.
- S. R. Raga, E. N. Barea and F. Fabregat-Santiago, J. Phys. Chem. Lett., 2012, 3, 1629–1634 CrossRef CAS PubMed.
- H. S. Jung and N. G. Park, Small, 2015, 11, 10–25 CrossRef CAS PubMed.
- S. Ryu, J. H. Noh, N. J. Jeon, Y. C. Kim, W. S. Yang, J. Seo and S. I. Seok, Energy Environ. Sci., 2014, 7, 2614–2618 CAS.
- B. Zhang, W. Fan, T. Yao, S. Liao, A. Li, D. Li, M. Liu, J. Shi, S. Liao and C. Li, ChemSusChem, 2017, 10, 99–105 CrossRef CAS PubMed.
- K. Yan, Y. Yang, O. K. Okoth, L. Cheng and J. Zhang, Anal. Chem., 2016, 88, 6140–6144 CrossRef CAS PubMed.
- K. Ren, Y. X. Gan, T. J. Young, Z. M. Moutassem and L. Zhang, Composites, Part B, 2013, 52, 292–302 CrossRef CAS.
- K. Ren, C. A. McConnell, Y. X. Gan, A. A. Afjeh and L. Zhang, Electrochim. Acta, 2013, 109, 162–167 CrossRef CAS.
- A. Heller, Acc. Chem. Res., 1981, 14, 154–162 CrossRef CAS.
- Q. Chen, J. Li, X. Li, K. Huang, B. Zhou, W. Cai and W. Shangguan, Environ. Sci. Technol., 2012, 46, 11451–11458 CrossRef CAS PubMed.
- M. C. Hanna and A. J. Nozik, J. Appl. Phys., 2006, 100, 074510 CrossRef.
- Y. Kijitori, M. Ikegami and T. Miyasaka, Chem. Lett., 2007, 36, 190–191 CrossRef CAS.
- Y. Fujishima, S. Okamoto, M. Yoshiba, T. Itoi, S. Kawamura, Y. Yoshida, Y. Ogura and Y. Izumi, J. Mater. Chem. A, 2015, 3, 8389–8404 CAS.
- Y. Ogura, S. Okamoto, T. Itoi, Y. Fujishima, Y. Yoshida and Y. Izumi, Chem. Commun., 2014, 50, 3067–3070 RSC.
- L. Ye, K. Deng, F. Xu, L. Tian, T. Peng and L. Zan, Phys. Chem. Chem. Phys., 2012, 14, 82–85 RSC.
- J. A. Bearden, Rev. Mod. Phys., 1967, 39, 78–124 CrossRef CAS.
- K. L. Zhang, C. M. Liu, F. Q. Huang, C. Zheng and W. D. Wang, Appl. Catal., B, 2006, 68, 125–129 CrossRef CAS.
- A. Bidram, A. Davoudi and R. S. Balog, IEEE J. Photovolt., 2012, 2, 532–546 CrossRef.
- F. Martínez-Moleno, J. Muñoz and E. Lorenzo, Sol. Energy Mater. Sol. Cells, 2010, 94, 2298–2303 CrossRef.
- Y. Ogura, M. Yoshida and Y. Izumi, Oil Gas Sci. Technol., 2015, 70, 853–862 CrossRef.
- R. Schlaf, H. Murata and Z. H. Kafafi, J. Electron Spectrosc. Relat. Phenom., 2001, 120, 149–154 CrossRef CAS.
- X. Zhang, L. Zhao, C. Fan, Z. Liang and P. Han, Comput. Mater. Sci., 2012, 61, 180–184 CrossRef CAS.
- F. Chen, H. Liu, S. Bagwasi, X. Shen and J. Zhang, J. Photochem. Photobiol., A, 2010, 215, 76–80 CrossRef CAS.
- K. Zhao, L. Zhang, J. Wang, Q. Li, W. He and J. J. Yin, J. Am. Chem. Soc., 2013, 135, 15750–15753 CrossRef CAS PubMed.
- B. Sarwan, B. Pare and A. D. Acharya, Mater. Sci. Semicond. Process., 2014, 25, 89–97 CrossRef CAS.
- Y. Yoshida, Y. Mitani, T. Itoi and Y. Izumi, J. Catal., 2012, 287, 190–202 CrossRef CAS.
- S. Kawamura, H. Zhang, M. Tamba, T. Kojima, M. Miyano, Y. Yoshida, M. Yoshiba and Y. Izumi, J. Catal., 2017, 345, 39–52 CrossRef CAS.
| This journal is © The Royal Society of Chemistry 2017 |

