
 Open Access Article
 This Open Access Article is licensed under a
 Creative Commons Attribution 3.0 Unported Licence
Ferromagnetic behavior of non-stoichiometric ZnS microspheres with a nanoplate-netted surface
Jing Dong,
Xianghua Zeng *,
Weiwei Xia,
Xiuyun Zhang,
Min Zhou and
Caixia Wang
*,
Weiwei Xia,
Xiuyun Zhang,
Min Zhou and
Caixia Wang
College of Physics Science and Technology & Institute of Optoelectronic Technology, Yangzhou University, Yangzhou 225002, P. R. China. E-mail: xhzeng@yzu.edu.cn; Tel: +86-514-87975500
First published on 11th April 2017
Abstract
Undoped ZnS microspheres with a size of 4–5 μm were produced using a hydrothermal method with different ratios of Zn and S precursors. Structural and morphological measurements show that the sphalerite ZnS microspheres have a cavity surface self-assembled with nanoplates with a thickness of 20–30 nm. Experimentally measured magnetic hysteresis curves for the undoped ZnS microspheres clearly indicate ferromagnetic behavior at room temperature with a saturation magnetization Ms = 3.66 and 1.566 memu g−1 for an atomic ratio of Zn to S equal to 0.966 and 1.32, respectively. The calculations based on density functional theory within the generalized gradient approximation + Hubbard U (GGA + U) approach demonstrated that the ZnS (111) surface with Zn vacancies produces a ferromagnetic state with a magnetic moment per unit cell of 2.0 μB; the defective ZnS (111) surface with mixed Zn and S vacancies has a reduced magnetic moment of 1.12 μB because of the structural reconstruction, while the defective ZnS (111) surface with only S vacancies is non-magnetic. The observed weak ferromagnetism for the ZnS microspheres can be ascribed to the Zn vacancies and the cavity surface; the latter results in a large number of unsaturated bonds for the S and Zn atoms at the interfacial and surface regions. These studies will be helpful for understanding the d0 ferromagnetism.
1. Introduction
Nanomaterials exhibit some typical optoelectric and magnetic properties due to their large specific surface area and intrinsic defects that exist in the low dimensional structured materials. Among them, the observation of ferromagnetism in semiconductors and insulating oxide nanostructures without doping magnetic ions is regarded as a very interesting phenomenon; this new type of magnetism is referred as d0 ferromagnetism (FM).1,2 As the d0 magnetism combining both semiconducting and ferromagnetic properties may provide a new way to design spintronic devices, it has attracted great attention recently.3–7Although there are numerous discussions on d0 ferromagnetism, its mechanism is still unclear. For example, whether or not d0 ferromagnetism can be ascribed to either anionic vacancies or metal vacancies is not certain. The studies on ZnS nanocrystals8 reported that the magnetization of the material is drastically reduced upon increasing the number of sulfur vacancies.9 Gao et al.10 reported that oxygen vacancies play an important role in introducing ferromagnetism in ZnO nanoparticles. Liu et al.11 found that the ferromagnetism behavior of a TiO2 nanoarray is related to the oxygen vacancies on the surface of the nanoparticles. Shi et al.12 reported that the activation of a weak FM is attributed to the long-range exchange between singly ionized oxygen vacancy  defects with an unpaired electron. Rainey et al.13 ascribed the saturation magnetization of ZnO NPs of around 0.077–0.088 memu g−1 to the changes in the number of Zn interstitials and oxygen vacancies.
In addition, some results have shown that an induced room-temperature ferromagnetism (RTFM) mainly originates from metal vacancies. For example, Pan et al.14 reported that the presence of metal vacancies induced room-temperature ferromagnetism. However, Clara et al.15 showed that the occurrence of RTFM in these systems was related to the conduction band of the semiconductor but not related to the metallic cation. Motaung et al.16 reported that  and zinc vacancies (VZn) are the main defects and that their relative concentration decreases with an increase in particle size, resulting in a decreased ferromagnetism (FM). Singh et al.17 observed size dependent ferromagnetism, where the degree of ferromagnetism in titanium dioxide increases with an increase in the particle size, while it is reversed for zinc oxide. They explained that the origin of ferromagnetism was a consequence of exchange interactions between localized electron spin moments originating from point defects. By studying the relationships of the grain boundary with the d0 ferromagnetism, Tietze et al. found that the grain area to volume fraction, i.e. the specific grain boundary area SGB, plays an important role in d0 ferromagnetism with a saturation magnetization of 8.3 emu cm−3 found in the undoped ZnO nanostructures.18 Theoretical calculations on ZnS quantum dots and wires showed that a higher concentration of Zn vacancies results in a larger magnetic moment in nanocrystals.19 In addition, the theoretical results reported by Xiao et al. showed that the magnetism on the surfaces of ZnS thin film and nanoparticles is driven by a surface effect, namely low coordination, which results in unpaired electrons in the S-3p orbital on their surfaces.20
II–VI semiconductors have been extensively studied due to their potential applications in solar cells, lithium-ion batteries, chemical sensors, optoelectric detectors, etc. In addition, nanostructured ZnS materials display unique properties due to the introduction of a large surface area and defects. Therefore, undoped ZnS microspheres self-assembled with nanoplates with a thickness of 20–30 nm were produced using a hydrothermal approach, where samples #1, #2 and #3 were obtained for the ratios of Zn and S precursors equal to 1![[thin space (1/6-em)]](https://www.rsc.org/images/entities/char_2009.gif) :1.5, 1:1.2 and 1:1, respectively. First, XPS was carried out to explain the relative ratio of Zn to S vacancies in the prepared samples, where the atomic ratio of Zn to S was obtained as 0.966, 1.024 and 1.32 for samples #1, #2 and #3, respectively. The PL spectra of the three ZnS samples exhibited two asymmetric peaks at ∼450 and 520 nm, and the integrated PL intensity of sample #1 was only one quarter that of sample #3 and nearly one half that of sample #2, indicating that the dominant defects are sulphur vacancies for sample #3. All the PL spectra can be de-convoluted into four emission peaks located at 427, 449, 496 and 540 nm, i.e. 2.90, 2.76, 2.49 eV and 2.28 eV, which are ascribed to singly ionized sulphur vacancies
:1.5, 1:1.2 and 1:1, respectively. First, XPS was carried out to explain the relative ratio of Zn to S vacancies in the prepared samples, where the atomic ratio of Zn to S was obtained as 0.966, 1.024 and 1.32 for samples #1, #2 and #3, respectively. The PL spectra of the three ZnS samples exhibited two asymmetric peaks at ∼450 and 520 nm, and the integrated PL intensity of sample #1 was only one quarter that of sample #3 and nearly one half that of sample #2, indicating that the dominant defects are sulphur vacancies for sample #3. All the PL spectra can be de-convoluted into four emission peaks located at 427, 449, 496 and 540 nm, i.e. 2.90, 2.76, 2.49 eV and 2.28 eV, which are ascribed to singly ionized sulphur vacancies  , Zn vacancies, singly ionized zinc vacancies
  and the recombination of the S vacancies and Zn vacancies, respectively. Moreover, the XPS spectra of S 2p3/2 core level and that of Zn (2p3/2) core level exhibited the existence of sulphur vacancies and zinc vacancies in samples #1 and #3, while the latter sample had more sulphur vacancies. Room temperature ferromagnetic measurements show that the saturation magnetization Ms was equal to 3.66, 0.966 and 1.566 memu g−1 for samples #1, #2 and #3, respectively, implying that a larger concentration of zinc vacancies corresponds to a larger magnetic moment. Density functional theory within the generalized gradient approximation + Hubbard U (GGA + U) approach was used to study the changes in the magnetic moments. It shows that the ZnS (111) surface with Zn vacancies produces a ferromagnetic state with a magnetic moment per unit cell of 2.0 μB, and the defective ZnS (111) surface with mixed Zn–S vacancies has a reduced magnetic moment of 1.12 μB due to the occurrence of structural reconstruction, while the defective ZnS (111) surface with S vacancies is non-magnetic.
2. Experimental
2.1 Chemicals
Zinc acetate [Zn(OAc)2·2H2O], thiourea [(NH2)2CS], sodium hydroxide (NaOH) and ethanol (C2H5OH) were purchased from Sinopharm Chemical Reagent Co, Ltd. (Shanghai China). All chemicals were of AR (analytically pure) grade and used without further purification.2.2 Synthesis of the ZnS microspheres
ZnS microspheres with a cavity surface were prepared via a facile one step hydrothermal approach using zinc acetate, thiourea and sodium hydroxide as precursors. In a typical procedure, 16.5 mL of deionized water and 16.5 mL of ethanol were mixed in a 100 mL beaker and stirred to ensure complete mixing. Then, 0.165 mol of sodium hydroxide, 0.33 mmol of zinc acetate and 0.495 mmol of thiourea were individually dissolved in the mixture and agitated for approximately 2 h at room temperature. Then, the well-mixed solution was transferred into a 50 mL sealed autoclave and heated in an oven at 180 °C for 18 h. The resulting product was separated under centrifugation, alternately washed with distilled water and absolute alcohol, and dried at 60 °C for 24 h. To obtain other samples, the concentration of zinc acetate and thiourea were varied while all others were kept constant.2.3 Characterization
The as-synthesized ZnS products were characterized via X-ray diffraction (D8 Advance, Bruker-AXS) with Cu Kα radiation (λ = 0.154056 nm), and their powder X-ray diffraction (XRD) patterns were collected in the 2θ range from 10° to 120° using a continuous scanning method at a scanning speed of 5° (2θ) min−1. The morphologies of the obtained products were characterized using field-emission scanning electron microscopy (FESEM, s-4800II, Hitachi). Absorption measurements were carried out using a UV-vis-NIR spectrophotometer (UV-vis, Cary-5000, Varian) with an integrating sphere. Photoluminescence (PL) measurements were performed using a Britain Renishaw In Via spectrophotometer, with a 325 nm line of a He–Cd laser as the excitation light source in a closed-cycle He cryostat. X-ray photoelectron spectroscopy (XPS) (VG Scientific, ESCALAB250Xi) measurements were conducted to obtain information on the valence state of the S and Zn ions. The magnetic measurements were performed using a quantum design superconducting quantum interference device (SQUID) located at Nanjing University. As the properties of sample #2 were similar to those of the others, its data are not listed in the text.3. Results and discussions
3.1 Structure and morphology
Scanning electron microscopy (SEM) techniques were used to study the morphology of the prepared samples, as shown in Fig. 1a and b. The SEM images show that the products were composed of microspheres for the three samples. In addition, the field-emission scanning electron microscopy (FESEM) images show that the microspheres have a size of 4–5 μm with adjoining cavities self-assembled by nanoplates, as displayed in Fig. 1c and d with each nanoplate having a thickness of 20–30 nm and the cavities having a depth of tens to hundreds nm. The three samples have a similar morphology. Transmission electron microscopy (TEM) and high resolution transmission electron microscopy (HRTEM) images were recorded to examine the structure and surface of the microstructured samples, as shown in Fig. 2a and b. From Fig. 2a, the as-prepared ZnS microsphere has a core–shell structure with an outer shell of ∼1 μm, implying that the cavities on the surface of the samples have a depth as large ∼1 μm. The deep cavities provide a large specific surface and result in a large number of unsaturated bonds for S and Zn atoms at the contact interface areas. The measured d-spacings of 0.312 nm, observed from the HRTEM images (in Fig. 2b), correspond to the (111) crystal planes of ZnS (JCPDS card no. 65-5476), as shown in Fig. 2c. Fig. 2c indicates that all the reflection peaks match well with the standard data of the sphalerite structure of ZnS (JCPDS card no. 65-5476) with a = 5.404 Å, where the diffraction peaks at 2θ = 28.59°, 33.13°, 47.55°, 56.43°, 59.18° and 69.52° match well to the planes of (111), (200), (220), (311), (222) and (400), respectively. No extra peaks were detected by XRD, indicating the superior purity of the ZnS product.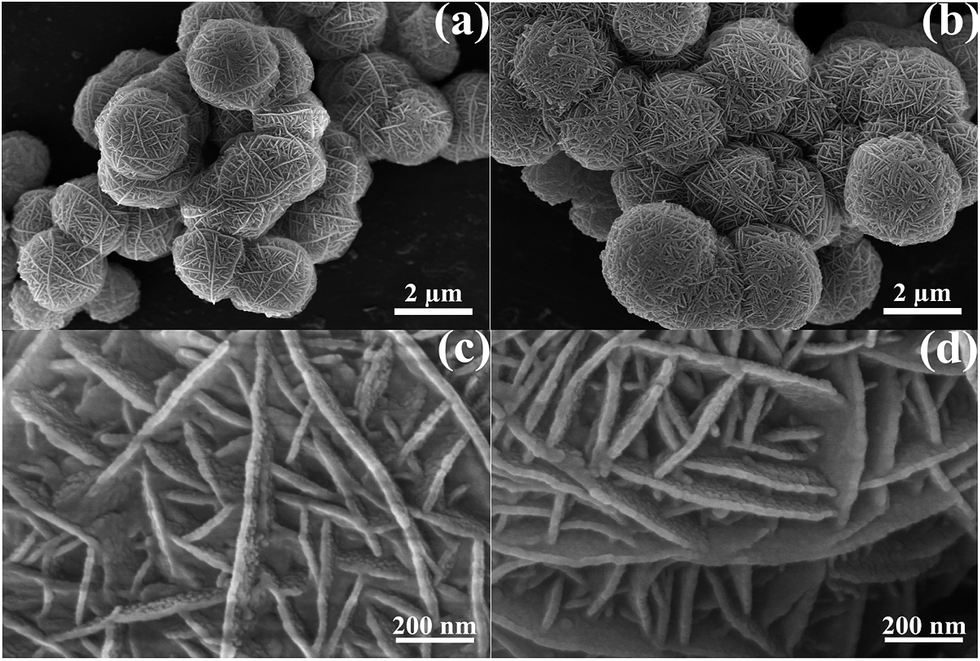 | ||
| Fig. 1 SEM images of samples #1 (a) and #3 (b). FESEM images of samples #1 (c) and #3 (d). | ||
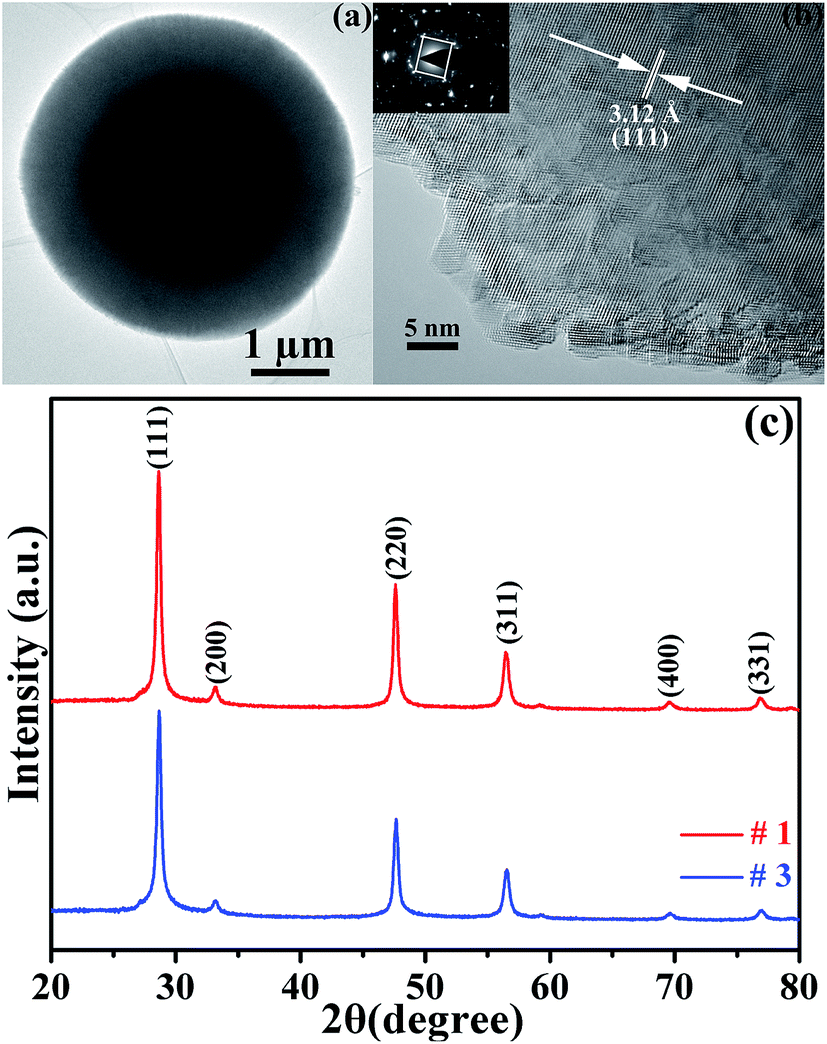 | ||
| Fig. 2 (a) Low magnification TEM images and (b) high magnification TEM images for sample #1. (c) The XRD patterns of samples #1 and #3. | ||
3.2 XPS spectra
XPS measurements were used to investigate the surface composition of the three samples. Fig. 3a shows the XPS survey spectra of samples #1 and #3, in which all of the peaks can be ascribed to the elements Zn, S, and C only; the binding energies have been calibrated using the carbon C 1s peak (285.0 eV) as reference, as labeled in Fig. 3a. This indicates that no other impurities were observed in both the samples. From the XPS spectra, the atomic ratio of Zn to S was obtained as 0.966, 1.024 and 1.32 for samples #1, #2 and #3, respectively, implying that sample #1 had more zinc vacancies, while sample #3 had more sulfur vacancies.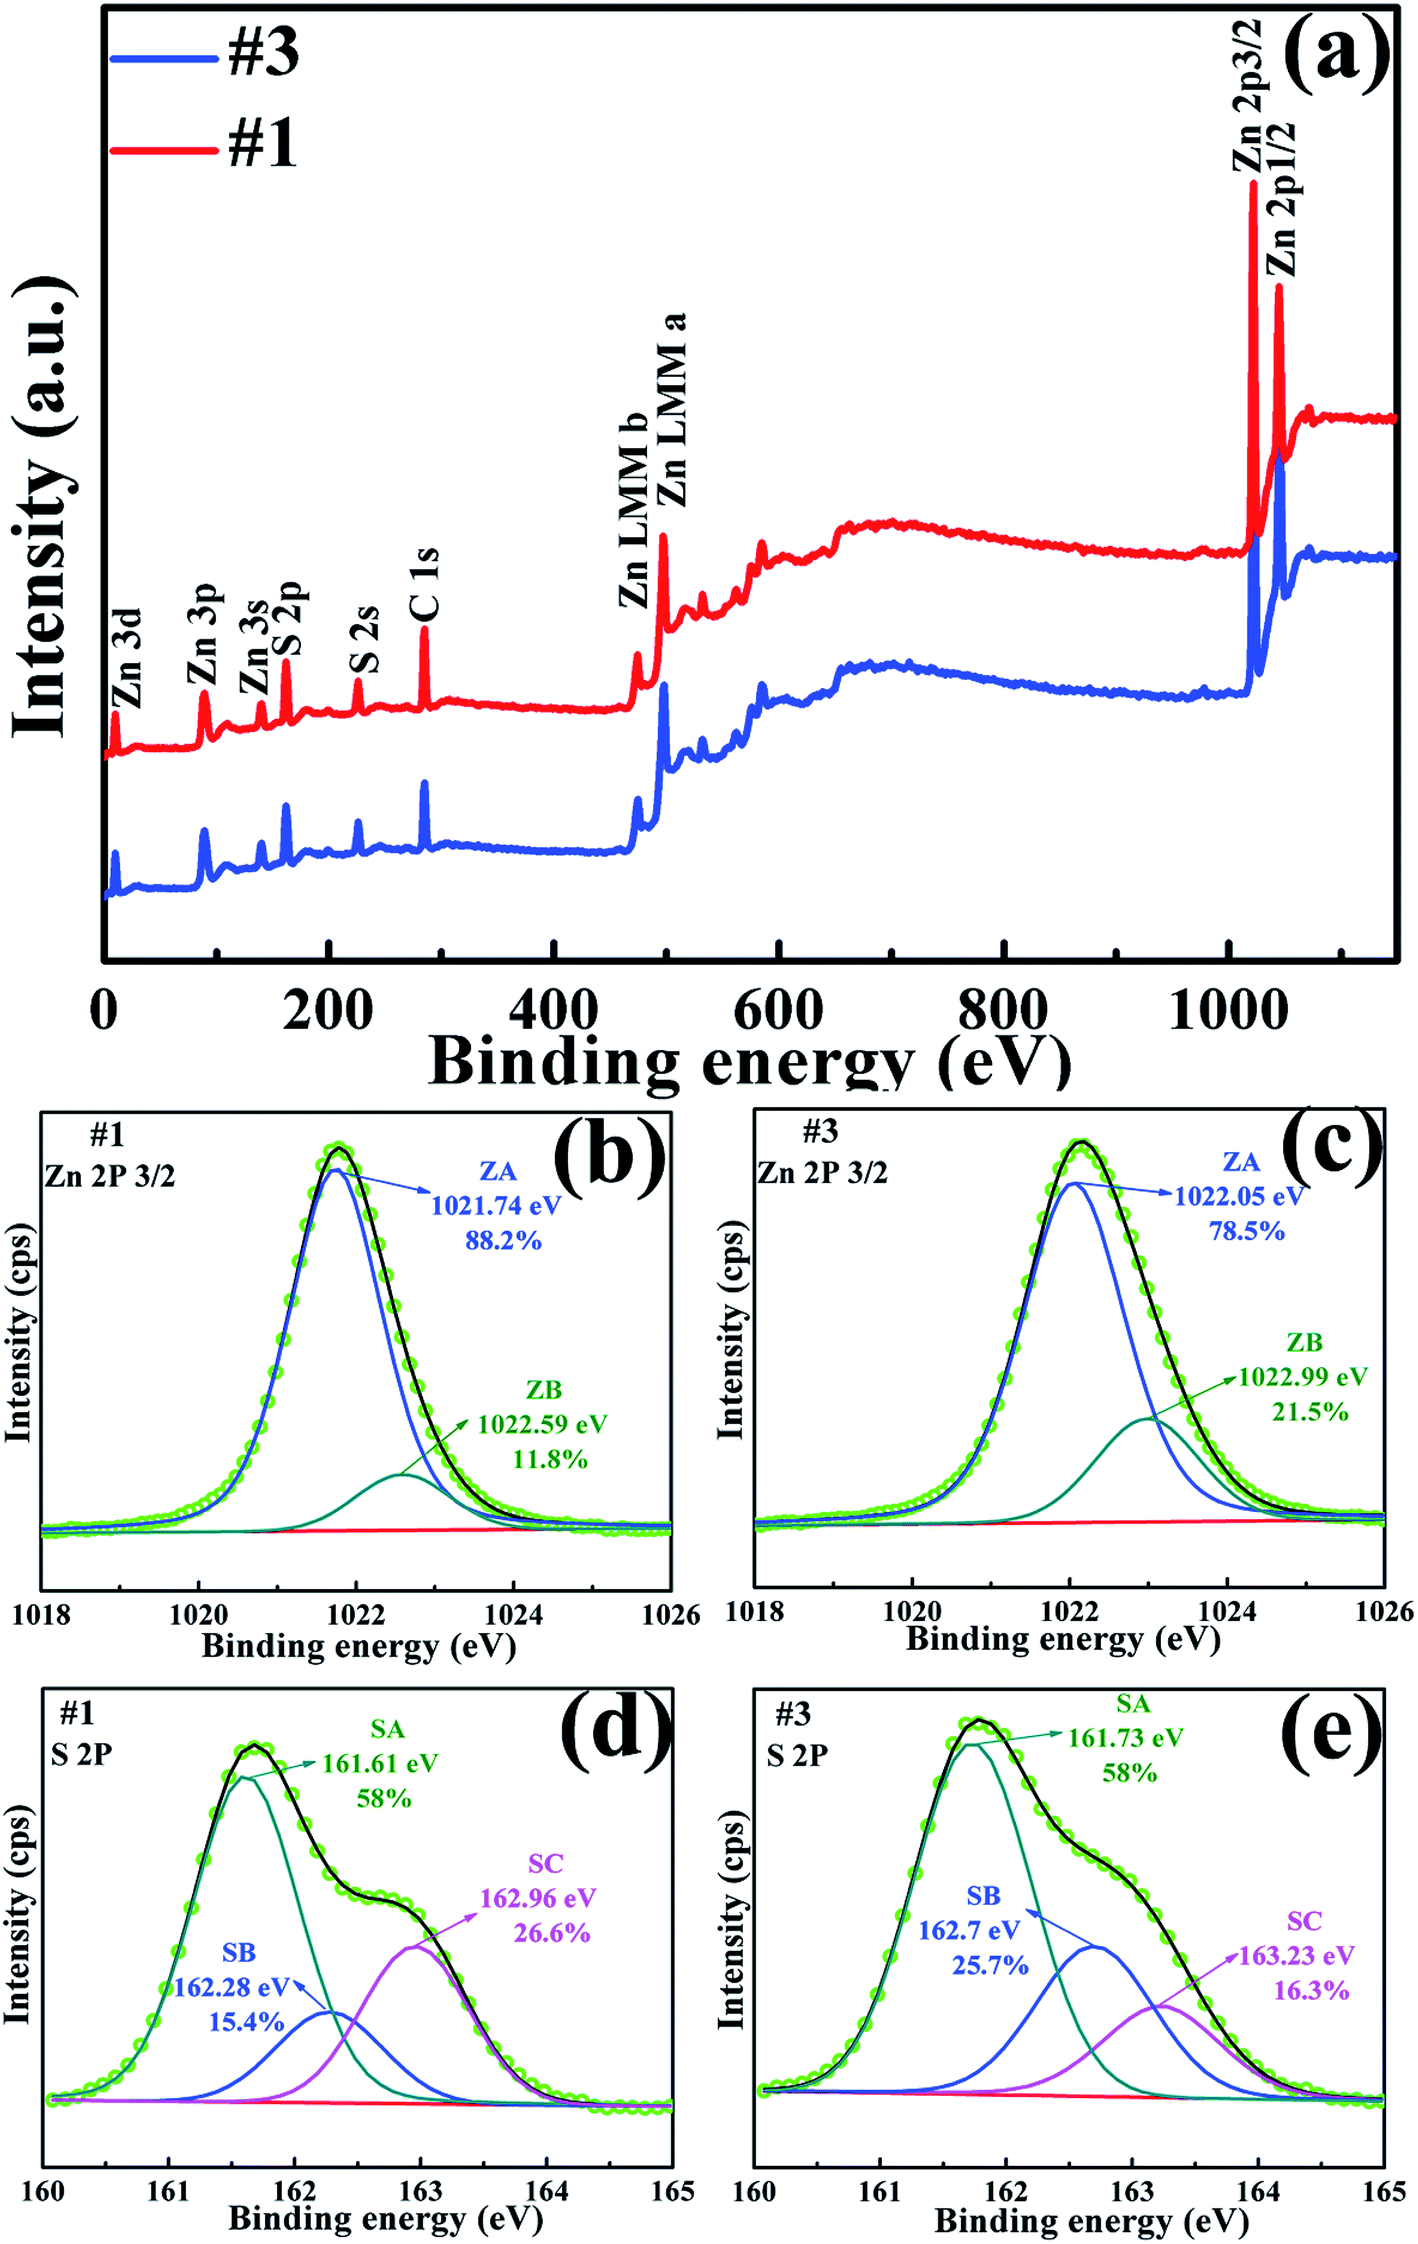 | ||
| Fig. 3 The XPS spectra of samples #1 and #2 (a). The Zn 2p3/2 spectra with Gaussian fitting of samples #1 (b) and #3 (c). The S 2p3/2 spectra with Gaussian fitting of samples #1 (d) and #3 (e). | ||
The Zn (2p3/2) core level spectra in both ZnS samples can be resolved into two peaks, the lower peak (ZA) and higher peak (ZB), as shown in Fig. 3b and c. The peaks at lower energies 1021.74 eV (#1) and 1022.05 eV (#3) are ascribed to zinc in the ZnS lattice, while the higher peaks at 1022.59 eV (#1) and 1022.99 eV (#3) may be related to the Zn2+ ions in the sulphur-deficient regions.21 The relative intensity ratios between ZB and total zinc (ZA + ZB) are equal to 0.12 and 0.22 for samples #1 and #3, respectively, indicating that the suppressed ZB intensity of sample #1 was due to the lower number of sulphur vacancies.
The XPS spectra of the S 2p3/2 core level can be resolved into triple peaks at 161.6, 162.28 and 162.96 eV for sample #1 and three peaks at 161.73, 162.7 and 163.23 eV for sample #3. The three peaks are labeled as SA, SB and SC in sequence. The peaks at a lower energy of 161.6 eV (SA in #1) and 161.73 eV (SA #3) were ascribed to S 2p3/2 and the peaks at a higher energy of 162.96 eV (SC #1) and 163.23 eV (SC #3) were ascribed to S 2p1/2.22 While the middle peaks at 162.28 eV (SB #1) and 162.7 eV (SB #3) can be ascribed to the sulphur vacancies. The larger relative integrated intensity of SB in #3 further explains the existence of a larger number of sulphur vacancies in sample #3.
3.3 Absorption and PL spectra of the samples
The UV-Vis absorption spectra were obtained by measuring the optical absorption spectra on a UV-Vis spectrophotometer (Cary-5000). The absorption spectra of samples #1 and #3 are displayed in Fig. 4a. From the formula of (αhv) = c(hv − Eg)1/2 (where c is a constant and Eg is the band gap), the direct band gaps estimated from the plot of (αhv)2 versus the photon energy hv are equal to 3.55 and 3.54 eV for samples #1 and #3, respectively (inset in Fig. 4a). In the same way the band gap of 3.54 eV for sample #2 was obtained. Sample #3 has a slightly smaller band gap in comparison to sample #1 due to its larger number of sulphur vacancies. | ||
| Fig. 4 (a) The absorption spectra of samples ZnS #1 and #3 and their corresponding Tauc's plots (insets). (b) The PL spectra and their deconvolution with Gaussian fitting for sample #1 (c) and #3 (d). A schematic diagram of the energy levels of samples #1 (e) and #3 (f). | ||
The PL measurement results are shown in Fig. 4b. It shows that the spectra are in the range from 400 nm to 600 nm for the three samples, but the PL intensity of sample #3 is quite larger than the others, which is 4.6 times and 2.6 times larger than that of samples #1 and #2, respectively. From the above XPS results, sample #3 has a greater number of sulphur vacancies, and therefore the enhanced PL intensity in sample #3 can be ascribed to the sulphur-related vacancies. The PL intensity of sample #1 was lower than that of sample #2, even though the atomic ratio of S to Zn for sample #2 is 0.98, and the atomic ratio of Zn to S for sample #2 is 0.966. This was attributed to the ZnS nanocrystal having more native defects during its preparation.
Furthermore, all the PL spectra between 300 to 700 nm can be de-convoluted into four emission peaks centered at 427, 449, 496 and 540 nm, corresponding to 2.90, 2.76, 2.49 eV and 2.28 eV, respectively, for sample #1, 426.61 (2.91 eV), 448.53 (2.76 eV), 498.7 (2.49 eV) and 557.6 nm (2.22 eV) for sample #2 and 426 nm (2.91 eV), 448 nm (2.77 eV), 494 nm (2.51 eV) and 537 nm (2.31 eV) for sample #3. The deconvolutions in the PL spectra for sample #1 and #3 are shown in Fig. 4c and d, respectively. The PL emission peaks at 2.90 (#1) and 2.91 eV (#2 and #3) were attributed to the singly ionized sulphur vacancies  in regard to the literature.23,24 The emissions at 2.76 (#1) and 2.77 eV (#2 and #3) were ascribed to the Zn vacancies (VZn), which are consistent with the literature.25 The green emission peaks at 2.49 (#1 and #2) and 2.51 eV (#3) were assigned to the singly ionized zinc vacancies
  in comparison with the results obtained for ZnO.26 In addition, the emissions at 2.28 eV (#1), 2.22 eV (#2) and 2.31 eV (#3) were ascribed to the emissions from the sulphur vacancies to the zinc vacancies, as shown in Fig. 4e and f. Then, the corresponding depth of the VS donor level of 0.48 eV (#1) and 0.46 eV (#3) matches well with the previous observation of a self-activated emission in ZnS recombination between the charge carriers from the sulfur vacancies to the valence band.27 The singly ionized zinc vacancies and singly ionized sulphur vacancies are a result of the large number of Zn and S vacancies due to their unique structure. Table 1 shows the de-convoluted peaks of the PL spectra for the three samples, where the relative ratios of the four emissions are listed. One can find that the zinc vacancy-related emissions for sample #1 showed the highest percentage and the lowest was observed for #2, indicating that sample #2 has a much lower number of zinc vacancies than the others, and sample #1 has the largest number of zinc vacancies among the three samples.
| Peak no | Wavelength (nm) | Energy (eV) | Relative ratio (%) | FWHM (nm) |
|---|---|---|---|---|
| Atomic Zn:S = 0.966 (#1) | ||||
| P1 | 427.26 | 2.90 | 7.6 | 38.28 |
| P2 | 449.18 | 2.76 | 3.1 | 21.64 |
| P3 | 497.49 | 2.49 | 31.5 | 77.51 |
| P4 | 544.67 | 2.28 | 57.8 | 133.76 |
|
||||
| Atomic Zn:S = 1.024 (#2) | ||||
| P1 | 426.61 | 2.91 | 6.5 | 33.57 |
| P2 | 448.53 | 2.76 | 3.7 | 21.77 |
| P3 | 498.73 | 2.49 | 48.1 | 91.27 |
| P4 | 557.62 | 2.22 | 41.6 | 139.74 |
|
||||
| Atomic Zn:S = 1.32 (#3) | ||||
| P1 | 425.91 | 2.91 | 10.9 | 41.76 |
| P2 | 448.27 | 2.77 | 3.8 | 22.65 |
| P3 | 493.63 | 2.51 | 35.4 | 81.26 |
| P4 | 536.78 | 2.31 | 49.9 | 138.19 |
3.4 Magnetic properties
SQUID measurements at room temperature were carried out to study the magnetic properties. The samples show weak ferromagnetic behavior embedded in a diamagnetic background response, which is reproducible under the experimental conditions. To compare the ferromagnetic signals, M–H curves after subtracting the diamagnetic contribution from the samples are shown in Fig. 5. All the samples exhibit a clear hysteresis loop, suggesting that the samples are ferromagnetic with a Curie temperature above 300 K. It can be observed that sample #1 has the largest saturation moment (Ms = 3.66 memu g−1), which was more than 3.8 times larger than that observed for sample #2 (0.966 memu g−1) and 1.5 times larger than that observed for sample #3 (1.566 memg g−1). The results are consistent with the changes in the number of zinc vacancies discussed above, i.e. the largest number of zinc vacancies in sample #1 gave the largest ferromagnetic value, and the lowest number of zinc vacancies in sample #2 gave the smallest ferromagnetic value. Therefore, we assigned the FM to the presence of the zinc vacancies. The observed results are consistent with the literature,19 where their calculated magnetization values were larger than our experiment results and calculations (in the following discussion); at the same time the linear increase in ferromagnetism with the zinc vacancies was not observed. | ||
| Fig. 5 The M–H magnetic hysteresis loops obtained for samples #1, #2 and #3 (the inset is for sample #3). | ||
To study the effect of the surface defects on the magnetism of ZnS, we took into consideration of the defective ZnS (111) surface with intrinsic Zn (VZn) or S (VS) defects based on density functional theory within the generalized gradient approximation and Hubbard U (GGA + U) approach. The VZn (or VS) are sequentially generated by removing Zn (or S) atoms on the Zn-ended (or S-ended) surface, which have been proven to have the lowest formation energy. The lattice constants of the system were used from the ZnS bulk parameters as reference. The calculations were performed by selecting the (2 × 2) unit cells for a single Zn vacancy or S vacancy (see Fig. 6d and e) and a larger (2 × 4) unit cell was used for the mixed Zn–S vacancies (see Fig. 6f). In addition, the 5 ZnS-layer, 6 ZnS-layer and 9 ZnS-layer were considered. The (5 × 5 × 1) and (11 × 11 × 1) k-point meshes were used for the geometry optimization and electronic structure calculations, respectively. Moreover, to consider the effect of the onsite Coulomb repulsion on the electronic structure of ZnS, a DFT + U scheme self-interaction correction of U = 6.0 and 4.0 eV was applied on the Zn-3d and S-3p states, respectively. Our results show that the ZnS (111) surface with S vacancies is non-magnetic (see Fig. 6a). Differently, the ZnS (111) surfaces with Zn vacancies produce a ferromagnetic state, in which the total magnetic moment per unit cell is 2.0 μB (see Fig. 6b). The density of state (DOS) displays the dominant contribution of the spin-polarized S-3pz orbitals. Such calculation results are in accordance with the literature.20 As for the defective ZnS (111) surface with mixed Zn and S vacancies, structural reconstruction occurs (see Fig. 6f), and the magnetic moment is largely reduced to 1.12 μB (see Fig. 6c) compared with the case for Zn vacancies. The addition of the number of ZnS-layers has no effect on the magnetic moment value in our calculations.
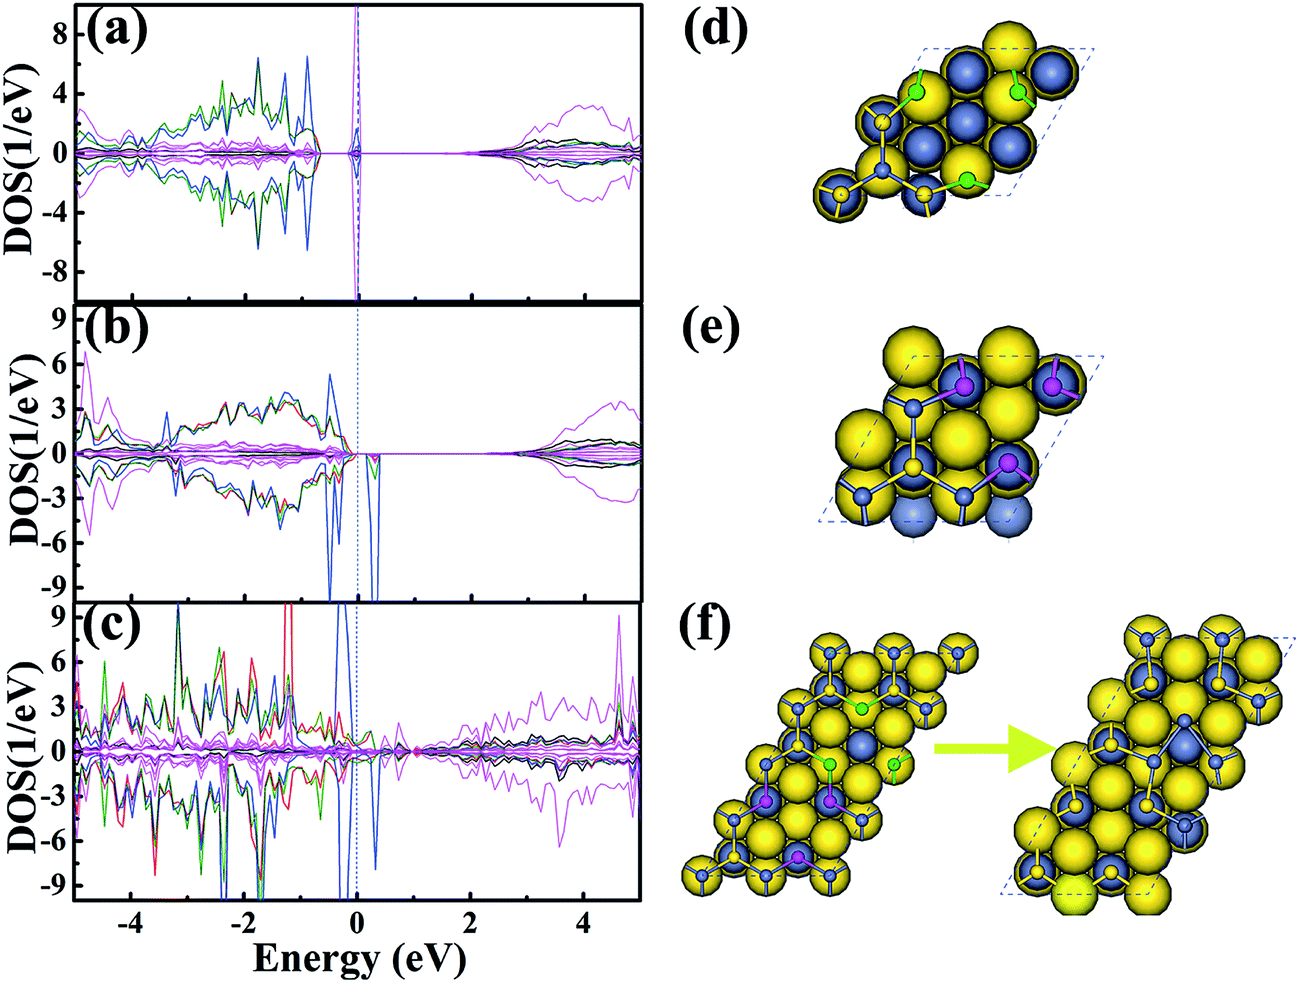 | ||
| Fig. 6 The calculated α (spin ↑) and β (spin ↓) density of states and with (2 × 2) unit cells for the (a) S vacancies, (b) Zn vacancies and (c) mixed Zn–S vacancies with a (2 × 4) unit cell. (d)–(f) The corresponding geometry configurations for VS, VZn and mixed VS/VZn. | ||
4. Conclusions
Room temperature ferromagnetism of ZnS microspheres self-assembled with nanoplates with a thickness of 20–30 nm has been experimentally and theoretically studied. First, the PL spectra of three ZnS samples exhibited two asymmetric peaks at ∼450 and 520 nm, which were ascribed to S and Zn vacancy related emissions. In addition, the XPS spectra of the S 2p3/2 core level and the Zn (2p3/2) core level showed the existence of sulphur vacancies and zinc vacancies in the three samples, whereas sample #1 showed a much larger number of Zn vacancies, while sample #3 displayed a larger number of sulphur vacancies. Even for sample #2 there were still a number of Zn and S vacancies because the microspheres with a cavity surface have a large number of unsaturated bonds for S and Zn atoms at the interfacial and surface regions. Experimentally the measured magnetic hysteresis curves clearly display ferromagnetic behavior at room temperature with a saturation magnetization Ms = 3.66, 0.966 and 1.566 memu g−1 for an atomic ratio of Zn to S equal to 0.966, 1.024 and 1.32, respectively, indicating that the Zn vacancies are favorable for the existence of ferromagnetism. The calculations based on density functional theory within the generalized gradient approximation + Hubbard U (GGA + U) approach demonstrate that the ZnS (111) surface with Zn vacancies produces a ferromagnetic state with a magnetic moment per unit cell of 2.0 μB, the defective ZnS (111) surface with mixed Zn–S vacancies has a reduced magnetic moment of 1.12 μB and the defective ZnS (111) surface with S vacancies is non-magnetic. The mechanism for the magnetic coupling on the ZnS (111) surface with the Zn vacancies essentially originates from the partially filled S 3p orbitals due to the under coordinated S atoms and the mixed Zn–S vacancies reduce the magnetic moment because the structural reconstruction will offset the DOS. So, we conclude that the observed weak ferromagnetism of ZnS microspheres can be ascribed to the Zn vacancies as well as their cavity surface. These studies will be helpful for the understanding of d0 ferromagnetism.Conflict of interest
The authors declare no competing financial interest.Acknowledgements
We gratefully acknowledge the financial support for this study from the National Natural Science Foundation of China (No. 61474096 and 61604127).References
- J. A. Chan, S. Lany and A. Zunger, Electronic Correlation in Anion p Orbitals Impedes Ferromagnetism due to Cation Vacancies in Zn Chalcogenides, Phys. Rev. Lett., 2009, 103, 016404 CrossRef CAS PubMed.
- S. Ning, P. Zhan, Q. Xie, W. P. Wang and Z. J. Zhang, Defects-Driven Ferromagnetism in Undoped Dilute Magnetic Oxides: A Review, J. Mater. Sci. Technol., 2015, 31, 969–978 Search PubMed.
- A. Sundaresan and C. N. R. Rao, Ferromagnetism as a universal feature of inorganic nanoparticles, Nano Today, 2009, 4, 96–106 CrossRef CAS.
- H. W. Peng, H. J. Xiang, S. H. Wei, S. S. Li, J. B. Xia and J. B. Li, Origin and enhancement of hole-induced ferromagnetism in first-row d0 semiconductors, Phys. Rev. Lett., 2009, 102, 017201 CrossRef PubMed.
- C. Guglieri and J. Chaboy, Characterization of the ZnO/ZnS Interface in THIOL-Capped ZnO Nanoparticles Exhibiting Anomalous Magnetic Properties, J. Phys. Chem. C, 2010, 114, 19629–19634 CAS.
- C. M. Cepeda-Jiménez, A. Hernando, J. M. Barandiarán and M. T. Pérez-Prado, Onset of room temperature ferromagnetism by plastic deformation in three paramagnetic pure metals, Scr. Mater., 2016, 118, 41–45 CrossRef.
- G. X. Zhu, S. G. Zhang, Z. Xu, J. Ma and X. P. Shen, Ultrathin ZnS Single Crystal Nanowires: Controlled Synthesis and Room-Temperature Ferromagnetism Properties, J. Am. Chem. Soc., 2011, 133(39), 15605–15612 CrossRef CAS PubMed.
- D. Q. Gao, G. J. Yang, J. Zhang, Z. H. Zhu, M. S. Si and D. S. Xue, d0 ferromagnetism in undoped sphalerite ZnS nanoparticles, Appl. Phys. Lett., 2011, 99, 052502 CrossRef.
- F. L. Faita, K. Ersching, C. M. Poffo, L. C. Benetti, D. M. Trichês, S. M. Souza, A. D. C. Viegas and J. C. de Lima, Structural, thermal, magnetic and optical characterization of undoped nanocrystalline ZnS prepared by solid state reaction, J. Alloys Compd., 2014, 590, 176–183 CrossRef CAS.
- D. Q. Gao, Z. H. Zhang, J. L. Fu, Y. Xu, J. Qi and D. S. Xue, Room temperature ferromagnetism of pure ZnO nanoparticles, J. Appl. Phys., 2009, 105, 113928 CrossRef.
- Y. P. Liu, S. S. Feng, Z. G. Li, L. Zhang, G. P. Wang, W. P. Chen, T. L. Wang and W. W. Zhong, Oxygen vacancy-related room temperature ferromagnetism in TiO2 nanohole arrays, RSC Adv., 2016, 6, 57013–57018 RSC.
- S. B. Shi, Z. M. Dang, J. P. Xu, L. Li and G. H. Hu, Surface-related emissions and ferromagnetism in undoped ZnO nanorods, Superlattices Microstruct., 2013, 64, 375–387 CrossRef CAS.
- K. Rainey, J. Chess, J. Eixenberger, D. A. Tenne, C. B. Hanna and A. Punnoose, Defect induced ferromagnetism in undoped ZnO nanoparticles, J. Appl. Phys., 2014, 115, 17D727 CrossRef.
- L. Pan, S. B. Wang, W. B. Mi, J. J. Song, J. J. Zou, L. Wang and X. W. Zhang, Undoped ZnO abundant with metal vacancies, Nano Energy, 2014, 9, 71–79 CrossRef CAS.
- C. Guglieri, E. Céspedes, A. Espinosa, M. Laguna-Marco, N. Carmona, Y. Takeda, T. Okane, T. Nakamura, M. García-Hernández, M. Ángel García and J. Chaboy, Evidence of Oxygen Ferromagnetism in ZnO Based Materials, Adv. Funct. Mater., 2014, 24, 2094–2100 CrossRef CAS.
- D. E. Motaung, P. R. Makgwane and S. S. Ray, Induced ferromagnetic and gas sensing properties in ZnO-nanostructures by altering defect concentration of oxygen and zinc vacancies, Mater. Lett., 2015, 139, 475–479 CrossRef CAS.
- S. C. Singh, R. K. Kotnala and R. Gopal, Room temperature ferromagnetism in liquid-phase pulsed laser ablation synthesized nanoparticles of nonmagnetic oxides, J. Appl. Phys., 2015, 118, 064305 CrossRef.
- T. Tietze, P. Audehm, Y. C. Chen, G. Schütz, B. B. Strauma, S. G. Protasova, A. A. Mazilkin, P. B. Strauma, T. Prokscha, H. Luetkens, Z. Salman, A. Suter, B. Baretzky, K. Fink, W. Wenzel, De. Danilov and E. Goering, Interfacial dominated ferromagnetism in nanograined ZnO: a mSR and DFT study, Sci. Rep., 2014, 5, 8871 CrossRef PubMed.
- V. Proshchenko, A. Karanovich and Y. Dahnovsky, Surface-Bulk Model for d0 Ferromagnetism in ZnS Quantum Dots and Wires, J. Phys. Chem. C, 2016, 120, 11253–11261 CAS.
- W. Z. Xiao, L. L. Wang, Q. Y. Rong, G. Xiao and B. Meng, Magnetism in undoped ZnS studied from density functional theory, J. Appl. Phys., 2014, 115, 213905 CrossRef.
- X. Q. Gu, S. Zhang, Y. L. Zhao and Y. H. Qiang, Band alignment of ZnO/ZnS heterojunction prepared through magnetron sputtering and measured by X-ray photoelectron spectroscopy, Vacuum, 2015, 122, 6–11 CrossRef CAS.
- M. Stefan, D. Toloman, A. Popa, A. Mesaros, O. R. Vasile, C. Leostean and O. Pana, Interface charge transfer process in ZnO: Mn/ZnS Nanocomposites, J. Nanopart. Res., 2016, 18, 59 CrossRef.
- K. Vanheusden, W. L. Warren, C. H. Seager, D. R. Tallant and J. A. Voigt, Mechanisms behind green photoluminescence in ZnO phosphor powders, J. Appl. Phys., 1996, 79, 7983–7990 CrossRef CAS.
- D. E. Motaung, P. R. Makgwane and S. S. Ray, Induced ferromagnetic and gas sensing properties in ZnO-nanostructures by altering defect concentration of oxygen and zinc vacancies, Mater. Lett., 2015, 139, 475–479 CrossRef CAS.
- B. Bhattacharjee and C. H. Lu, Multicolor luminescence of undoped zinc sulfide nanocrystalline thin films at room temperature, Thin Solid Films, 2006, 514, 132–137 CrossRef CAS.
- S. Repp, S. Weber and E. Erdem, Defect Evolution of Nonstoichiometric ZnO Quantum Dots, J. Phys. Chem. C, 2016, 120(43), 25124–25130 CAS.
- C. H. Ye, X. S. Fang, M. Wang and L. D. Zhang, Temperature-dependent photoluminescence from elemental sulfur species on ZnS nanobelts, J. Appl. Phys., 2006, 99, 063504 CrossRef.
| This journal is © The Royal Society of Chemistry 2017 |