 Open Access Article
A green, facile, and rapid method for microextraction and Raman detection of titanium dioxide nanoparticles from milk powder†
B. Zhao a,
X. Caoa,
R. De La Torre-Rochec,
C. Tana,
T. Yanga,
J. C. White
 c,
H. Xiao
 a,
B. Xing
 b and
L. He*a
aDepartment of Food Science, University of Massachusetts, Amherst, Massachusetts 01003, USA. E-mail: lilihe@foodsci.umass.edu; Tel: +1 413 545 5847
bStockbridge School of Agriculture, University of Massachusetts, Amherst, Massachusetts 01003, USA
cDepartment of Analytical Chemistry, The Connecticut Agricultural Experiment Station, New Haven, Connecticut 06511, USA
First published on 18th April 2017
Abstract
Titanium dioxide (TiO2) has been widely used as a common ingredient in numerous food products. Recently, the analysis of TiO2 nanoparticles (NPs) has attracted increasing attention due to potential risks to human health and the environment. Herein, we present a green, facile, and rapid method using flavonoid-assisted microextraction and Raman spectroscopy for TiO2 NPs (anatase, 21 nm) detection in real food samples. Flavonoids can bind onto TiO2 NPs, enabling the microextraction of the particles by ethyl acetate and sodium chloride. The extracted TiO2 NPs concentrate at the interlayer and are easily removed for analysis by Raman spectroscopy. By taking advantage of surface-enhanced Raman spectroscopy (SERS), we evaluated and selected the best binding flavonoid, myricetin (MYC) bound onto TiO2 NPs, and were able to achieve detection at concentrations as low as 0.2 mg L−1 TiO2 NPs in water. The method was successfully challenged in the presence of various interferences from common food components and different pH conditions. The recoveries determined using inductively coupled plasma mass spectrometry (ICP-MS) ranged from 66.6% to 88.3%. More important, the method showed good capability for the extraction and quantification of TiO2 NPs from infant milk powder dilutions. As flavonoids, ethyl acetate, and sodium chloride have low toxicity and are relatively abundant in the environment, this may be considered a green approach for TiO2 NP extraction and detection. The developed method in this study holds great potential for rapid (<1 h) detection of TiO2 NPs from food products.
Introduction
In the past decades, titanium dioxide (TiO2) has been considered an inert and safe material and has been used in many applications. Approximately 7 million tons of TiO2 are produced annually and are used as a pigment in order to provide whiteness and opacity to a variety of products. More recently, with the development of nanotechnology, TiO2 nanoparticles (NPs) with a number of unique and useful properties have been manufactured, with increasing production to 60![[thin space (1/6-em)]](https://www.rsc.org/images/entities/char_2009.gif) 000 tons per year by 2025.1 The presence of TiO2 NPs has been reported not only in consumer products, but also food products. Food-grade TiO2 (E171) has been widely used as a common ingredient in numerous products. Studies have shown that in E171, approximately 36% of the TiO2 NPs have at least one dimension less than 100 nm.2 Products such as candies, sweets and chewing gums are known to contain the highest amount of TiO2 NPs. Due to their antimicrobial activity, TiO2 NPs have also been used in food packaging.3 TiO2 NPs have also been used as a photocatalyst in food packaging film to preserve fruits and vegetables.1 This large scale application of TiO2 NPs in food products and other products increases the likelihood of human exposure and release into the environment. However, a number of studies have shown that TiO2 NPs may pose considerable risks to human health and the environment.4,5 Toxicological studies show that TiO2 NPs cause adverse effects via induction of oxidative stress resulting in cell damage, genotoxicity, inflammation, and immune response.6–8 Based on the experimental evidence from animal inhalation studies, TiO2 NPs have recently been classified as “possibly carcinogenic to humans” by the International Agency for Research on Cancer and as occupational carcinogen by the National Institute for Occupational Safety and Health.4 Therefore, it is critically important and urgent to assess the levels of TiO2 NPs in food products and the environment.
000 tons per year by 2025.1 The presence of TiO2 NPs has been reported not only in consumer products, but also food products. Food-grade TiO2 (E171) has been widely used as a common ingredient in numerous products. Studies have shown that in E171, approximately 36% of the TiO2 NPs have at least one dimension less than 100 nm.2 Products such as candies, sweets and chewing gums are known to contain the highest amount of TiO2 NPs. Due to their antimicrobial activity, TiO2 NPs have also been used in food packaging.3 TiO2 NPs have also been used as a photocatalyst in food packaging film to preserve fruits and vegetables.1 This large scale application of TiO2 NPs in food products and other products increases the likelihood of human exposure and release into the environment. However, a number of studies have shown that TiO2 NPs may pose considerable risks to human health and the environment.4,5 Toxicological studies show that TiO2 NPs cause adverse effects via induction of oxidative stress resulting in cell damage, genotoxicity, inflammation, and immune response.6–8 Based on the experimental evidence from animal inhalation studies, TiO2 NPs have recently been classified as “possibly carcinogenic to humans” by the International Agency for Research on Cancer and as occupational carcinogen by the National Institute for Occupational Safety and Health.4 Therefore, it is critically important and urgent to assess the levels of TiO2 NPs in food products and the environment.
The conventional method for analyzing TiO2 NPs in complex matrices relies on the sample digestion with concentrated acid, followed by quantification with inductively coupled plasma mass spectrometry (ICP-MS) or inductively coupled plasma optical emission spectrometer (ICP-OES) for elemental titanium.2,9,10 Normally, hydrofluoric acid is used for sample digestion but this presents numerous safety and environmental hazards. As a relatively new approach, single-particle ICP-MS can achieve fast size determination of TiO2 particles.11 However, it is only suitable for 20 nm or larger NPs, requires significant analytical expertise, involves assumptions of particle morphology, and is difficult to apply in complex or heterogeneous matrices. Majedi et al. reported on a hydrophobization and solvent microextraction method for extracting trace TiO2 from water before ICP-MS detection.12 11-Mercaptoundecanoic acid combined with octadecylamine and cyclohexane were used as a hydrophobization reagent and extraction solvent, respectively. Although highly sensitive, these methods are still limited by several disadvantages: destruction of NPs (so the technique cannot discriminate between NPs and bulk particles), the use of toxic reagents, significant analytical expertise, and use of a complicated and time-consuming procedure (analysis time > 2 h, excluding sample digestion). Facing the need to investigate the presence of TiO2 NPs in various products and the challenge due to the large number of products, it is critically important to develop a rapid and facile method to extract and detect TiO2 NPs in various matrices.
Herein, we developed a novel approach using flavonoid-assisted extraction and Raman detection for simple, green and fast analysis of TiO2 NPs. Flavonoids are naturally occurring plant polyphenolic compounds with a wide range of biological and pharmacological properties.13–15 Importantly, many flavonoids contain catechol groups, suggesting that they can act as bidentate ligands for TiO2 NPs.16–18 Furthermore, considering their hydrophobicity and ability to form charge transfer complexes with TiO2,19 flavonoids may be a potential green ligand molecule which could be used for the extraction of hydrophilic TiO2 NPs.20 The interaction between flavonoids and TiO2 NPs can be measured and characterized using surface enhanced Raman spectroscopy (SERS) due to the charge transfer mechanism.16–18,21–27
In this study, we first evaluated three flavonoids and selected the best binding ligand bound onto TiO2 NPs through competitive adsorption experiments with SERS. Then a flavonoid-assisted microextraction was developed, and the extracted TiO2 NPs were detected and quantified based on both of the intrinsic Raman peak of TiO2 NPs and the SERS peak of flavonoid. The developed method was challenged with various interferences and different pH conditions. ICP-MS was used for determination of analyte recovery. Finally, the capability of the method for the extraction and quantification of TiO2 NPs from infant milk powder dilutions was studied, because TiO2 NPs was unexpectedly found in baby formula more recently which caused great public concerns.28 To the best of our knowledge, this is the first example of combining flavonoid-assisted microextraction with Raman spectroscopy to develop a green, simple and fast method for TiO2 NPs analysis. The development of such a method will potentially fulfill the critically important need of screening TiO2 NPs in a large variety and number of products, and greatly facilitate accurate and reliable assessment of the environmental and human health risks associated with TiO2 NPs exposure.
Experimental section
Chemicals and materials
21 nm TiO2 anatase nanopowder was purchased from Sigma-Aldrich (St. Louis, USA). Infant milk powder (Similac) was purchased from Super Stop & Shop Supermarket (Hadley, USA). All flavonoids, MYC, quercetin (QUC) and luteolin (LUT) were purchased from Quality Phytochemicals LLC. All other chemicals were purchased from Sigma-Aldrich (St. Louis, USA) unless otherwise stated. All aqueous solutions were prepared with ultrapure water (18.2 MΩ cm) from Thermo Scientific Barnstead Smart2Pure Water Purification System.Adsorption study of flavonoids on TiO2 NPs
A 1 g L−1 TiO2 NPs aqueous stock suspension was prepared by dispersing TiO2 NPs in ultrapure water (pH 7.0) by sonication (Branson 2800 Ultrasonic Cleaner) for 15 min prior to use. Before adsorption of flavonoids on TiO2 NPs, the size of TiO2 nanopowder and prepared TiO2 NPs aqueous suspension were characterized using scanning electron microscopy (SEM, Magellan 400 XHR, FEI) and Zetasizer Nano-ZS (Malvern Instruments), respectively. The TiO2 nanopowder was directly casted onto carbon conductive tape for SEM characterization and diluted TiO2 NPs aqueous suspension (200 mg L−1) was used for size analysis with Zetasizer Nano-ZS. MYC, QUC and LUT were dissolved in ethanol to prepare 5 mM stock solution. For the adsorption study of flavonoids on TiO2 NPs, the above MYC, QUC and LUT stock solution (5 mM) was mixed with an equal volume of TiO2 aqueous stock suspension, respectively. After incubation overnight at ambient temperature with gentle shaking, the mixture was centrifuged at 13![[thin space (1/6-em)]](https://www.rsc.org/images/entities/char_2009.gif) 300 rpm (17
300 rpm (17![[thin space (1/6-em)]](https://www.rsc.org/images/entities/char_2009.gif) 000g) for 5 min and the supernatant was discarded. The precipitate was redispersed with water and centrifuged at 13, 300 rpm for 5 min and the supernatant was discarded. This washing step was repeated two more times to completely wash away flavonoid molecules that were not bound to TiO2 NPs. The sediment was redispersed with water and 1 μL was pipetted onto a gold slide (BioGold™ Microarray Slides, Thermo Scientific) and air dried for SERS measurement. The gold coated slide has no SERS enhancement effect but it can provide great light reflectivity.29,30
000g) for 5 min and the supernatant was discarded. The precipitate was redispersed with water and centrifuged at 13, 300 rpm for 5 min and the supernatant was discarded. This washing step was repeated two more times to completely wash away flavonoid molecules that were not bound to TiO2 NPs. The sediment was redispersed with water and 1 μL was pipetted onto a gold slide (BioGold™ Microarray Slides, Thermo Scientific) and air dried for SERS measurement. The gold coated slide has no SERS enhancement effect but it can provide great light reflectivity.29,30
Selection of flavonoid for TiO2 NPs extraction by competitive adsorption
Competitive adsorption experiments were used to select the flavonoid with the highest binding affinity to TiO2 NPs. Two of the three flavonoids (MYC and QUC, MYC and LUT, QUC and LUT) were first mixed together in a volume ratio of 1![[thin space (1/6-em)]](https://www.rsc.org/images/entities/char_2009.gif) :
:![[thin space (1/6-em)]](https://www.rsc.org/images/entities/char_2009.gif) 1. The concentration of each flavonoid in the mixture was 2.5 mM. The above mixture was then mixed with an equal volume of TiO2 NPs aqueous stock suspension and the resulting mixture was incubated overnight with gentle shaking. The mixture was centrifuged at 13, 300 rpm for 5 min and the supernatant was discarded. The precipitate was washed three times with water by centrifugation as described above and was then redispersed with water. One μL of redispersed sediment was pipetted onto a gold slide and air dried for SERS measurement.
1. The concentration of each flavonoid in the mixture was 2.5 mM. The above mixture was then mixed with an equal volume of TiO2 NPs aqueous stock suspension and the resulting mixture was incubated overnight with gentle shaking. The mixture was centrifuged at 13, 300 rpm for 5 min and the supernatant was discarded. The precipitate was washed three times with water by centrifugation as described above and was then redispersed with water. One μL of redispersed sediment was pipetted onto a gold slide and air dried for SERS measurement.
Optimization of MYC concentration and incubation time
MYC was selected as the optimal flavonoid due to its strong affinity to TiO2 NPs. The concentration and incubation time were optimized to enable maximum adsorption capacity for further analyte extraction. A series of concentrations of MYC (1 μM, 10 μM, 100 μM, and 1 mM) were mixed with an equal volume of TiO2 NPs aqueous suspension (400 mg L−1). The final concentration of MYC in the mixture was 0.5 μM, 5 μM, 50 μM, and 500 μM. All the mixtures were incubated for 2 h at ambient temperature with gentle shaking. The resulting mixtures were then centrifuged at 13, 300 rpm for 5 min and the supernatant was discarded. After washing three times with water, the precipitate was redispersed with water and 1 μL was pipetted onto a gold slide and air dried for SERS measurement.For optimization of incubation time, a TiO2 NPs suspension (400 mg L−1) was mixed with an equal volume of MYC (1 mM in ethanol) and incubated at ambient temperature with gentle shaking. At different time points (5, 15, 30, 60 and 120 min), an aliquot was pipetted out and centrifuged at 13, 300 rpm for 5 min. After washing three times with water, the precipitate was redispersed with water and 1 μL was pipetted onto a gold slide and air dried for SERS measurement.
SERS detection sensitivity
SERS detection sensitivity for MYC-adsorbed TiO2 NPs was investigated to determine the overall assay performance. The optimal MYC concentration (500 μM) and incubation time (30 min) were used. TiO2 NPs aqueous suspensions at various concentrations (0.4, 4, 40, and 400 mg L−1) were mixed with an equal volume of MYC (1 mM in ethanol) and were incubated for 30 min as described above. The resulting mixtures were then centrifuged at 13, 300 rpm for 5 min and the supernatant was discarded. After washing three times with water, the precipitate was redispersed with water and 1 μL was pipetted onto a gold slide and air dried for SERS measurement.Flavonoid-assisted TiO2 NPs extraction from water
Having demonstrated that MYC was the optimal flavonoid at 500 μM with 30 min of incubation time as optimal conditions, MYC-assisted extraction of TiO2 NPs from water was evaluated. First, a series of concentrations of TiO2 NPs suspensions were mixed with an equal volume of MYC (1 mM in ethanol). The final concentration of TiO2 NPs in the mixture was 0.2, 2, 20, and 200 mg L−1. All the mixtures were incubated for 30 min at ambient temperature with gentle shaking. Then, the extraction was performed by mixing a 200 μL aliquot of above mixture sample with NaCl aqueous solution (3 M) and ethyl acetate at a volume of 1![[thin space (1/6-em)]](https://www.rsc.org/images/entities/char_2009.gif) :
:![[thin space (1/6-em)]](https://www.rsc.org/images/entities/char_2009.gif) 1
1![[thin space (1/6-em)]](https://www.rsc.org/images/entities/char_2009.gif) :
:![[thin space (1/6-em)]](https://www.rsc.org/images/entities/char_2009.gif) 2, respectively. After vortexing 15 s to facilitate phase separation, the resulting interlayer containing MYC-adsorbed TiO2 NPs between the organic and aqueous phase was separated manually and 1 μL was pipetted onto a gold slide and air dried for SERS measurement. To validate performance of the MYC-assisted extraction method, no NPs control and no MYC controls were also evaluated.
2, respectively. After vortexing 15 s to facilitate phase separation, the resulting interlayer containing MYC-adsorbed TiO2 NPs between the organic and aqueous phase was separated manually and 1 μL was pipetted onto a gold slide and air dried for SERS measurement. To validate performance of the MYC-assisted extraction method, no NPs control and no MYC controls were also evaluated.
To assess the impact of matrix effects, TiO2 NPs suspension (800 mg L−1) was first dispersed with an equal volume of aqueous solution containing 100 g L−1 glucose, 100 g L−1 maltose, 10 g L−1 albumin, 90 g L−1 canola oil or 100 g L−1 NaCl. An equal volume of MYC (1 mM in ethanol) was added and the mixture was incubated for 30 min as described above. The final concentration of TiO2 NPs was 200 mg L−1. The extraction was then performed as mentioned above, followed by SERS measurement. To study the effect of pH, 400 mg L−1 TiO2 NPs suspensions under different pH conditions were prepared by dispersing TiO2 NPs in a series of aqueous solution at different pH (pH 4, 6, 7, 8 and 10) adjusted by HCl or NaOH. After adding an equal volume of MYC (1 mM in ethanol), the mixture was incubated for 30 min, followed by extraction and SERS measurement.
TiO2 NPs extraction from milk powder dilutions
A series of milk powder dispersions containing different concentrations of TiO2 NPs (10, 4, 1, 0,4 and 0.1 g L−1) were prepared by dispersing milk powder and TiO2 NPs with ultrapure water according to the recipe provide by manufacturer. In detail, 14 g milk powder and TiO2 NPs with different concentration (1, 0.4, 0.1, 0.04 and 0.01 g) were dispersed in 100 mL ultrapure water. The as-prepared TiO2 NPs-contained milk powder dispersions were then diluted 100 times with ultrapure water. TiO2 NPs extraction with MYC-assisted method was performed as described above for NPs extraction from water. The final concentration of diluted TiO2 NPs in extraction system was 50, 20, 5, 2 and 0.5 mg L−1, respectively. The milk powder dispersion containing 0 mg L−1 TiO2 NPs, namely no TiO2 NPs control, was also tested.Raman and SERS measurements
A DXR Raman microscope (Thermo Scientific, Madison, USA) equipped with a 780 nm laser and a 20× microscope objective was used in this study. All Raman and SERS spectra were obtained with a 5.0 mW laser power and a 50 μm slit aperture for 2 s acquisition time. OMINC 9.0 software (Thermo Scientific) was used for Raman data acquisition and analysis. For each sample, five spots were selected randomly and scanned with the range of 100–2000 cm−1. The mean and standard deviation were analyzed. All the experiments were repeated three times.ICP-MS
ICP-MS analysis was conducted to verify extraction efficiency of developed MYC-assisted extraction method for TiO2 NPs. Briefly, the extract containing TiO2 NPs was mixed with 500 μL aqua regia (concentrated nitric and hydrochloric acids in a volume ration of 1![[thin space (1/6-em)]](https://www.rsc.org/images/entities/char_2009.gif) :
:![[thin space (1/6-em)]](https://www.rsc.org/images/entities/char_2009.gif) 3) and incubated for 48 h at room temperature in a fume hood allowing complete digestion. After dilution to 10 mL with water and filtration with 0.45 μm filter membrane, all the samples were analyzed with ICP-MS (Agilent 7500ce, Santa Clara, USA) to determine Ti content.
3) and incubated for 48 h at room temperature in a fume hood allowing complete digestion. After dilution to 10 mL with water and filtration with 0.45 μm filter membrane, all the samples were analyzed with ICP-MS (Agilent 7500ce, Santa Clara, USA) to determine Ti content.
Data analysis
All the calibration curves for quantification assays were obtained by using log![[thin space (1/6-em)]](https://www.rsc.org/images/entities/char_2009.gif) 10–log
10–log![[thin space (1/6-em)]](https://www.rsc.org/images/entities/char_2009.gif) 10 model:
10 model:log![[thin space (1/6-em)]](https://www.rsc.org/images/entities/char_2009.gif) Y = a Y = a![[thin space (1/6-em)]](https://www.rsc.org/images/entities/char_2009.gif) log log![[thin space (1/6-em)]](https://www.rsc.org/images/entities/char_2009.gif) X + b X + b |
Relative standard deviation, expressed as a percentage (% RSD), was calculated to evaluate the precision of SERS detection:
SD and mean are the standard deviation and the mean of TiO2 NPs concentration reported by SERS detection method, respectively.
The method's accuracy was evaluated by analyzing aqueous samples and milk powder diluted samples containing different concentrations of TiO2 NPs and by calculating the percentage recovery value (% RV), which was defined as:
The extraction efficiency was determined by calculating the percentage of extracted TiO2 concentration obtained from ICP-MS analysis ([TiO2]IM) of the actual TiO2 concentration added for microextraction ([TiO2]Nom):
Results and discussion
Characterization of TiO2 NPs
Anatase TiO2 NPs (21 nm, Sigma-Aldrich) were selected as model particles because anatase is more widely used in food and consumer products and is more toxic than rutile.2,8 We first characterized the size of both TiO2 nanopowder and aqueous suspension. The TiO2 NPs aqueous stock suspension (1 g L−1) was prepared by dispersing TiO2 NPs in ultrapure water (pH 7.0) by sonication for 15 min prior to use. As shown in Fig. S1A,† SEM image of TiO2 nanopowder depicts that NPs are uniform in size with an average diameter of 21 nm, but tend to aggregate. The size distribution data of TiO2 NPs aqueous suspension shows a broad peak range from 80 nm to 1112.8 nm with an average size of 607.4 nm and some particles of 3–5 μm were also observed (Fig. S1B†). Aggregation of the TiO2 NPs was reported to be influenced by many factors such as ionic strength, pH, and cation valence.31 As these factors are largely varied between sample to sample in real situation, a good extraction method is expected to be able to work for all conditions regardless of their aggregation status. Therefore, in the following studies, we challenged our method with a wide range of interference.Selection of flavonoid for TiO2 NPs extraction
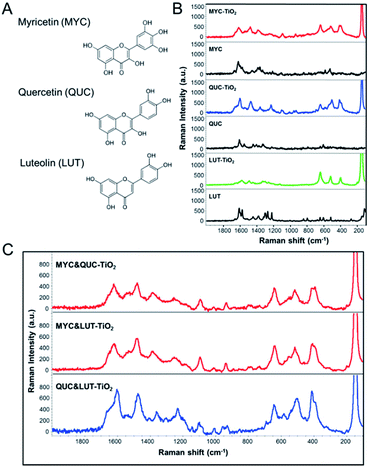
Given that flavonoid-assisted extraction relies on the adsorption behavior of flavonoid molecules to TiO2 NPs, selection of an appropriate flavonoid is critical for an effective extraction method. We investigated adsorption behavior of three kinds of flavonoids; myricetin (MYC), quercetin (QUC) and luteolin (LUT) using SERS. The molecular structures of three flavonoids are shown in Fig. 1A. All SERS spectra of flavonoid-adsorbed TiO2 NPs (Fig. 1B, MYC-TiO2, QUC-TiO2 and LUT-TiO2) show characteristic flavonoid peaks in the range from 800 cm−1 to 1700 cm−1 that differ from their own Raman peaks (black curves) due to charge transfer. TiO2 NPs could provide the SERS effect for adsorbed flavonoid molecule due to the charge transfer effect. The Raman signature of TiO2 NPs at 144 cm−1 could be clearly observed from the SERS spectra of flavonoid-bound TiO2 NPs (Fig. 1B, MYC-TiO2, QUC-TiO2 and LUT-TiO2).Competitive adsorption studies were performed to select the flavonoid with the strongest binding affinity to TiO2 NPs. Fig. 1C shows SERS spectra of competitive adsorption of two of three flavonoids, MYC and QUC on TiO2 NPs (MYC&QUC-TiO2), MYC and LUT on TiO2 NPs (MYC&LUT-TiO2), and QUC and LUT on TiO2 NPs (QUC&LUT-TiO2). By comparison, it is found that competitive adsorption spectra of MYC and QUC on TiO2 NPs (Fig. 1C, MYC&QUC-TiO2) shows the same SERS spectra as MYC-adsorbed TiO2 NPs (Fig. 1B, MYC-TiO2), suggesting that only MYC molecules were bound to TiO2 NPs despite the presence of QUC. This indicates MYC has stronger binding affinity than QUC, so that MYC could be preferentially bind to TiO2 NPs or displace QUC adsorbed on NPs. Similarly, MYC has stronger binding affinity than LUT (Fig. 1C, MYC&LUT-TiO2), and QUC has stronger binding affinity than LUT (Fig. 1C, QUC&LUT-TiO2). Therefore, we conclude that MYC has the strongest binding affinity to TiO2 NPs and selected MYC as optimal flavonoid for following study.
Optimization of MYC concentration and incubation time for sensitive SERS/Raman detection
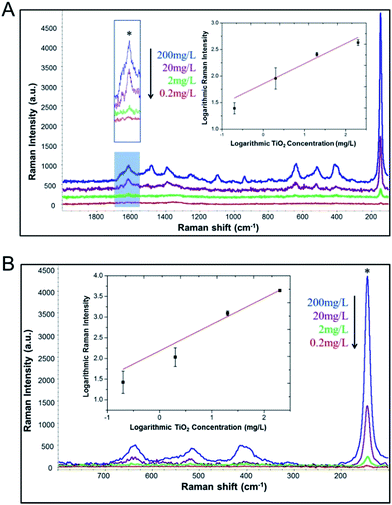
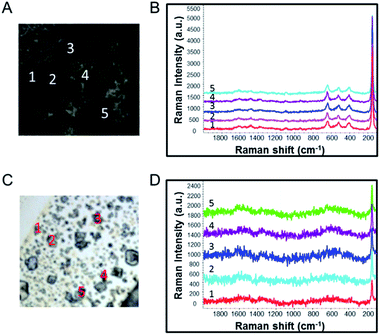
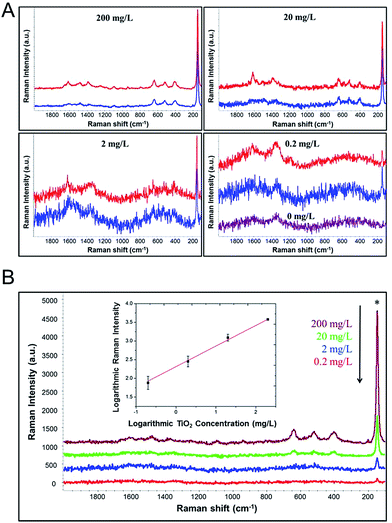
The concentration and incubation time were then optimized to enable maximum adsorption capacity for effective extraction and sensitive SERS/Raman detection. As shown in Fig. S2,† the SERS intensity increased with the increasing MYC concentration from 0.5 μM to 50 μM; however, SERS signals reached a plateau at 50 μM. Response at 500 μM was equivalent to that of 50 μM, indicating maximum adsorption of MYC on TiO2 NPs. Thus, 500 μM was selected as the optimal concentration of MYC to ensure sufficient analyte surface adsorption. Fig. S3† shows the dependence of SERS signals on the incubation time of MYC (500 μM) adsorbed on TiO2 NPs. SERS intensity increased gradually over time, and became constant at 30 min; as such, 30 min was selected as the optimal incubation time for following experiments.Different concentrations of TiO2 were incubated with MYC at the optimal concentration and incubation time to evaluate assay performance (Fig. 2). Under the Raman microscope, the aggregates of TiO2 NPs dried on a gold slide were clearly seen, which facilitated the selection of effective spots for reproducible analysis. As seen in Fig. 3, the spots selected from the aggregates of TiO2 NPs of high and low concentrations produced consistent signals. We also evaluated the precision of SERS detection method, which is important for the quantitative analysis of FDA-regulated products. The precision of the method was assessed by different levels (0.2, 2, 20 and 200 mg L−1) of TiO2 NPs. The relative standard deviation (RSD) expressed as a percentage are reported in Table 1. All of the reported % RSD values for our method are below 10%, which can be considered as adequately precise according to EPA Method 6200.32 The SERS signals increased with increasing concentration of TiO2 NPs. At concentrations as low as 0.2 mg L−1, TiO2 NPs could be clearly detected based on Raman peaks of both MYC and TiO2. TiO2 NPs could be quantified using the characteristic peak of MYC at 1615 cm−1 as indicated with the asterisk in Fig. 2A (inset). A reasonable linear response was achieved in the concentration range from 0.2 mg L−1 to 200 mg L−1, with an R square (R2) = 0.868. The regression equation is log![[thin space (1/6-em)]](https://www.rsc.org/images/entities/char_2009.gif) Y = 0.38
Y = 0.38![[thin space (1/6-em)]](https://www.rsc.org/images/entities/char_2009.gif) log
log![[thin space (1/6-em)]](https://www.rsc.org/images/entities/char_2009.gif) X + 1.85. This suggests that MYC could not only be used for TiO2 NPs extraction/detection, but also has potential for NPs quantification.
X + 1.85. This suggests that MYC could not only be used for TiO2 NPs extraction/detection, but also has potential for NPs quantification.
| Nominal [TiO2] (mg L−1) | % RSD |
|---|---|
| 0.2 | 9.0 |
| 2 | 5.8 |
| 20 | 2.9 |
| 200 | 0.7 |
We also demonstrated the quantitative capability based on the intrinsic Raman peak of TiO2 itself at 144 cm−1 (Fig. 2B). In contrast, a much better linear response (R2 = 0.954) in the concentration range from 0.2 mg L−1 to 200 mg L−1 was obtained (Fig. 2B, inset). The regression equation is log![[thin space (1/6-em)]](https://www.rsc.org/images/entities/char_2009.gif) Y = 0.64
Y = 0.64![[thin space (1/6-em)]](https://www.rsc.org/images/entities/char_2009.gif) log
log![[thin space (1/6-em)]](https://www.rsc.org/images/entities/char_2009.gif) X + 2.18. Obviously, the peak intensity of the TiO2 peaks is much greater than the MYC peaks, and as such, would be more sensitive for quantification.
X + 2.18. Obviously, the peak intensity of the TiO2 peaks is much greater than the MYC peaks, and as such, would be more sensitive for quantification.
Extraction and Raman detection of TiO2 from water
After optimization, a series of TiO2 NPs concentrations (0.2, 2, 20 and 200 mg L−1) were tested with our extraction method. Fig. 4A schematically illustrates the design of our flavonoid-assisted microextraction method for TiO2 NPs from water. TiO2 NPs dispersed in water were first mixed with MYC solution thoroughly and then incubated to allow the binding between MYC and TiO2 NPs. Then, the microextraction was performed by mixing above mixture with NaCl aqueous solution (3 M) and ethyl acetate at a volume of 1![[thin space (1/6-em)]](https://www.rsc.org/images/entities/char_2009.gif) :
:![[thin space (1/6-em)]](https://www.rsc.org/images/entities/char_2009.gif) 1
1![[thin space (1/6-em)]](https://www.rsc.org/images/entities/char_2009.gif) :
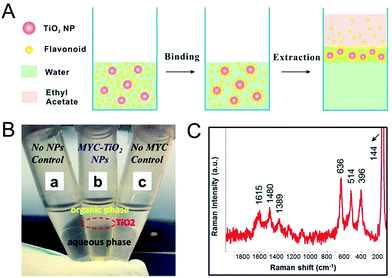
:![[thin space (1/6-em)]](https://www.rsc.org/images/entities/char_2009.gif) 2, respectively. The introduction of NaCl was to promote the extraction efficiency by decreasing the solubility of ethyl acetate in aqueous phase. After short vortex (15 s) to facilitate phase separation, the resulting interlayer containing MYC-adsorbed TiO2 NPs between the organic and aqueous phase was separated manually and 1 μL was pipetted onto a gold slide and air dried for Raman measurement. It is noteworthy that compared with conventional centrifugation method which could precipitate TiO2 NPs and other components simultaneously, the use of microextraction in this study could enable the separation of TiO2 NPs and eliminate the interference of other components. As shown in Fig. 4B-b, the interlayer containing MYC adsorbed TiO2 NPs was clearly evident between the organic and aqueous layer after phase separation. The extraction mechanism is attributed to the surface hydrophobization of TiO2 NPs resulting from the binding between MYC molecules and TiO2 NPs through coordination interaction.16,17,20 Finally, the extracted NPs can be easily separated and detected by Raman spectroscopy. The extracted TiO2 NPs showed SERS characteristic peaks of MYC at 1615 cm−1, 1480 cm−1 and 1389 cm−1, as well as Raman characteristic peaks of TiO2 NPs at 636 cm−1, 514 cm−1, 396 cm−1 and 144 cm−1 (Fig. 4C). The SERS peaks of MYC at 1615 cm−1, 1480 cm−1 and 1389 cm−1 were assigned to C
2, respectively. The introduction of NaCl was to promote the extraction efficiency by decreasing the solubility of ethyl acetate in aqueous phase. After short vortex (15 s) to facilitate phase separation, the resulting interlayer containing MYC-adsorbed TiO2 NPs between the organic and aqueous phase was separated manually and 1 μL was pipetted onto a gold slide and air dried for Raman measurement. It is noteworthy that compared with conventional centrifugation method which could precipitate TiO2 NPs and other components simultaneously, the use of microextraction in this study could enable the separation of TiO2 NPs and eliminate the interference of other components. As shown in Fig. 4B-b, the interlayer containing MYC adsorbed TiO2 NPs was clearly evident between the organic and aqueous layer after phase separation. The extraction mechanism is attributed to the surface hydrophobization of TiO2 NPs resulting from the binding between MYC molecules and TiO2 NPs through coordination interaction.16,17,20 Finally, the extracted NPs can be easily separated and detected by Raman spectroscopy. The extracted TiO2 NPs showed SERS characteristic peaks of MYC at 1615 cm−1, 1480 cm−1 and 1389 cm−1, as well as Raman characteristic peaks of TiO2 NPs at 636 cm−1, 514 cm−1, 396 cm−1 and 144 cm−1 (Fig. 4C). The SERS peaks of MYC at 1615 cm−1, 1480 cm−1 and 1389 cm−1 were assigned to C![[double bond, length as m-dash]](https://www.rsc.org/images/entities/char_e001.gif) O stretching motion in combination with C2
O stretching motion in combination with C2![[double bond, length as m-dash]](https://www.rsc.org/images/entities/char_e001.gif) C3 stretches, B-Ring CH in-plane bending and A-Ring breath.18 To validate the efficiency of the MYC-assisted extraction method, no NPs and no MYC controls were evaluated (Fig. 4B-a and B-c). No interlayer formed in either of the controls. More importantly, in the no MYC control, all TiO2 NPs were still dispersed in aqueous phase after phase separation (Fig. 4B-c) and finally precipitated to the bottom after 30 min (Fig. S4†), indicating that the flavonoid plays an essential role in the extraction of the NPs from water.
C3 stretches, B-Ring CH in-plane bending and A-Ring breath.18 To validate the efficiency of the MYC-assisted extraction method, no NPs and no MYC controls were evaluated (Fig. 4B-a and B-c). No interlayer formed in either of the controls. More importantly, in the no MYC control, all TiO2 NPs were still dispersed in aqueous phase after phase separation (Fig. 4B-c) and finally precipitated to the bottom after 30 min (Fig. S4†), indicating that the flavonoid plays an essential role in the extraction of the NPs from water.
Fig. 5A depicts SERS spectra of different concentrations of TiO2 NPs with and without extraction. Both SERS characteristic peaks of MYC and Raman peaks of TiO2 NPs could be clearly observed. SERS spectra of extracted TiO2 NPs show comparable intensity with that of TiO2 NPs without extraction, indicating the efficacy of our method for extraction and detection of different particle concentrations. As shown in Fig. 5B, the Raman signal intensity increased as the concentration of TiO2 NPs increased from 0.2 mg L−1 to 200 mg L−1. The detection sensitivity is as low as 0.2 mg L−1, which is much lower than the 1% (by weight) limit set for foods.5 The extracted TiO2 NPs were quantified based on the characteristic peak of TiO2 NPs at 144 cm−1 (Fig. 5B, Inset). The fitting curve shows a good linear response in the concentration range from 0.2 mg L−1 to 200 mg L−1. The linear fitting equation is log![[thin space (1/6-em)]](https://www.rsc.org/images/entities/char_2009.gif) Y = 0.55
Y = 0.55![[thin space (1/6-em)]](https://www.rsc.org/images/entities/char_2009.gif) log
log![[thin space (1/6-em)]](https://www.rsc.org/images/entities/char_2009.gif) X + 2.31 and R2 is 0.995. The accuracy of the assay was evaluated by testing aqueous samples with different concentrations of TiO2 NPs and calculating percentage recovery value (% RV) based on regression equation (Table 2). The mean % RV for TiO2 assay level ranged from 83.7 to 101.6%, which demonstrates that the assay is able to accurately analyze TiO2 NPs in aqueous solutions.
X + 2.31 and R2 is 0.995. The accuracy of the assay was evaluated by testing aqueous samples with different concentrations of TiO2 NPs and calculating percentage recovery value (% RV) based on regression equation (Table 2). The mean % RV for TiO2 assay level ranged from 83.7 to 101.6%, which demonstrates that the assay is able to accurately analyze TiO2 NPs in aqueous solutions.
| Nominal [TiO2] (mg L−1) | Mean% RV |
|---|---|
| 0.2 | 83.7 ± 7.1 |
| 2 | 96.1 ± 5.7 |
| 20 | 101.6 ± 9.2 |
| 200 | 98.9 ± 3.5 |
Complex food matrix effects and extraction efficiency
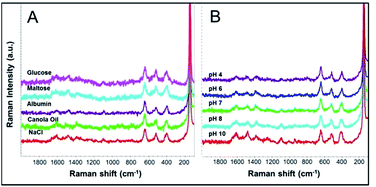
Understanding the effect of various food components (e.g. sugar, protein, oil and salt) in complex food matrices to interfere the developed method is very important for practical application of the method. Therefore we challenged our method in the presence of different food components (i.e. sugar, protein, oil and salt), as well as under different pH conditions. In all cases (Fig. 6), SERS spectra showed characteristic peaks of both MYC and TiO2 NPs at similar intensities to the controls (extraction tests under pH 7 in the absence of interferences, Fig. 6B, pH 7). The results demonstrate that our developed method is fit for purpose with regard to the detection and quantification of TiO2 NPs, including in relatively complex sample matrices.We verified the extraction efficiency of flavonoid-assisted extraction for TiO2 NPs by ICP-MS. As shown in Fig. 7, the recoveries of 68.9%, 88.3%, 81.2%, and 87.1% were achieved at 0.2 mg L−1, 2 mg L−1, 20 mg L−1 and 200 mg L−1 TiO2 NPs, respectively, verifying the suitability of the current method for the high-efficiency extraction of these NPs at different concentrations. The effects of complex matrix including interferences and pH on extraction efficiency were also studied. For various interferences, the extraction efficiency of 200 mg L−1 TiO2 NPs in the presence of glucose, maltose, albumin, canola oil and NaCl were 71.1%, 83.5%, 84.2%, 66.6% and 72.9%, respectively. The extraction efficiencies of 200 mg L−1 TiO2 NPs under pH 4, pH 6, pH 7, pH 8 and pH 10 were 69.2%, 77.9%, 87.1%, 69.7% and 74.9%, respectively. This data demonstrate the strong binding affinity of MYC to TiO2 even in the presence of many interferences and the good robustness of this method.
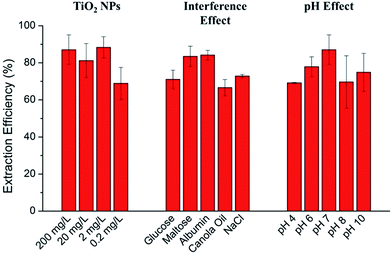 | ||
| Fig. 7 Extraction efficiency of variable concentrations of TiO2 NPs and effects of complex matrices (interferences and pH) on extraction efficiency of 200 mg L−1 TiO2 NPs. | ||
The overall extraction efficiency in this study (66.6–88.3%) were satisfied and could compare favourably with the recoveries of 61.5% to 78.5% reported by a previous study using 11-mercaptoundecanoic acid and octadecylamine as surfactant and cyclohexane as extraction solvent.10 In addition, centrifugation and evaporation were used to concentrate the extracted NPs in their study, which is time consuming. In another study, alkylphosphonic acids and chloroform were used for simultaneous surface modification and phase transfer of TiO2 NPs.33 Although they claimed total transfer by eye observation, overnight evaporating was used to concentrate the transferred TiO2 NPs, which is again time consuming. In contrast, our developed method is much faster (<1 h) and more convenient due to the fact that TiO2 NPs were extracted and concentrated into an interlayer between aqueous phase and organic phase. Furthermore, our method is considered green because of the use of non-toxic and naturally existed chemicals, including flavonoids, sodium chlorite, and ethyl acetate. Ethyl acetate is a natural compound found in a variety of food (e.g. wine) and considered as a green solvent in many studies and reports.34–37 For example, it is reported as a solvent to develop green methods for alkene epoxidation.34
TiO2 NPs extraction from real food samples
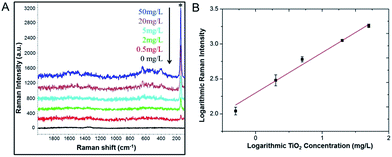
Finally, the developed flavonoid-assisted microextraction method was challenged with real food samples, milk powder. Infant milk powder (no detectable TiO2) artificially added with TiO2 NPs were used as standard samples for the preparation of milk powder dispersions. Under the consideration of developing simple analytical method for real samples detection and avoid additional complicated procedures, sample pretreatment was performed in terms of simple diluting step that is supremely suitable for on-site measurement. Interestingly, we found that the extraction method could work satisfactorily with 100 times milk powder dilutions, but not undiluted dispersions and 10 dilutions due to the matrix interference at high concentration (data not shown).38 A series of milk powder dilutions containing different concentrations of TiO2 NPs were tested.As shown in Fig. 8A, SERS spectra show characteristic peaks of both MYC and TiO2 NPs and the Raman signal intensity decreased as the concentration of TiO2 NPs decreased from 50 mg L−1 to 0.5 mg L−1. In contrast, the sample containing 0 mg L−1 TiO2 NPs, namely no TiO2 NPs control, did not show any Raman signals. We can detect as low as 0.5 mg L−1 TiO2 NPs from milk powder dilutions, corresponding to 100 mg L−1 (0.01% by weight) which is likewise much lower than the 1% (by weight) limit set for TiO2 in foods. Based on the characteristic peak of TiO2 NPs at 144 cm−1, the extracted TiO2 NPs from milk powder shows a good linear response in the concentration range from 0.5 mg L−1 to 50 mg L−1 (Fig. 8B). The linear fitting equation is log![[thin space (1/6-em)]](https://www.rsc.org/images/entities/char_2009.gif) Y = 0.58
Y = 0.58![[thin space (1/6-em)]](https://www.rsc.org/images/entities/char_2009.gif) log
log![[thin space (1/6-em)]](https://www.rsc.org/images/entities/char_2009.gif) X + 2.30 and R2 = 0.980. We also evaluated the accuracy of the assay for powder milk dilutions containing different concentrations of TiO2 NPs by calculating % RV based on regression equation (Table 3). The mean % RV for TiO2 assay level ranged from 87.2 to 103.7%, suggesting that the assay is able to accurately analyze TiO2 NPs in real samples. The results demonstrated the good capability and accuracy of the developed method for the extraction and quantification of TiO2 NPs from milk powder samples.
X + 2.30 and R2 = 0.980. We also evaluated the accuracy of the assay for powder milk dilutions containing different concentrations of TiO2 NPs by calculating % RV based on regression equation (Table 3). The mean % RV for TiO2 assay level ranged from 87.2 to 103.7%, suggesting that the assay is able to accurately analyze TiO2 NPs in real samples. The results demonstrated the good capability and accuracy of the developed method for the extraction and quantification of TiO2 NPs from milk powder samples.
| Nominal [TiO2] (mg L−1) | Mean% RV |
|---|---|
| 0.5 | 87.2 ± 9.5 |
| 5 | 98.6 ± 8.3 |
| 50 | 103.7 ± 5.5 |
Conclusions
In conclusion, we present a novel method using flavonoid-assisted extraction and Raman detection for TiO2 NPs analysis in real food samples. Using MYC, we were able to extract and detect concentration as low as 0.5 mg L−1 TiO2 NPs from milk powder dilutions. The developed method was sufficiently robust, performing well in various complex matrices and at a range of pH values. Although the sensitivity of the developed Raman detection method is not as great as ICP-MS, the developed method has several advantages. First, the use of non-toxic flavonoids, ethyl acetate, and sodium chloride could significantly decrease safety concerns caused by hazardous chemical use, especially hydrofluoric acid. Second, the method is both facile (no centrifugation needed) and rapid (analysis time < 1 h), and has significant potential for on-site or field detection with a portable Raman instrument. Future work will focus on the optimization of this method to improve the sensitivity as well as study TiO2 of different types and particle sizes. The feasibility of using a portable Raman instrument for on-site measurement of TiO2 NPs will be explored.Acknowledgements
We acknowledge the National Institute of Food and Agriculture of the U.S. Department of Agriculture (USDA-NIFA, grant no. 2015-67017-23070) for partially supporting this work.Notes and references
- X. Chen and S. S. Mao, Chem. Rev., 2007, 107, 2891–2959 CrossRef CAS PubMed.
- A. Weir, P. Westerhoff, L. Fabricius, K. Hristovski and N. von Goetz, Environ. Sci. Technol., 2012, 46, 2242–2250 CrossRef CAS PubMed.
- C. Chawengkijwanich and Y. Hayata, Int. J. Food Microbiol., 2008, 123, 288–292 CrossRef CAS.
- M. Skocaj, M. Filipic, J. Petkovic and S. Novak, Radiol. Oncol., 2011, 45, 227–247 CAS.
- B. Jovanović, Integr. Environ. Assess. Manage., 2015, 11, 10–20 CrossRef.
- V. K. Sharma, J. Environ. Sci. Health, Part A: Toxic/Hazard. Subst. Environ. Eng., 2009, 44, 1485–1495 CrossRef CAS PubMed.
- B. Trouiller, R. Reliene, A. Westbrook, P. Solaimani and R. H. Schiestl, Cancer Res., 2009, 69, 8784–8789 CrossRef CAS PubMed.
- C. M. Sayes, R. Wahi, P. A. Kurian, Y. Liu, J. L. West, K. D. Ausman, D. B. Warheit and V. L. Colvin, Toxicol. Sci., 2006, 92, 174–185 CrossRef CAS PubMed.
- G. Singh, C. Stephan, P. Westerhoff, D. Carlander and T. V. Duncan, Compr. Rev. Food Sci. Food Saf., 2014, 13, 693–704 CrossRef CAS.
- J. P. F. G. Helsper, R. J. B. Peters, M. E. M. van Bemmel, Z. E. H. Rivera, S. Wagner, F. von der Kammer, P. C. Tromp, T. Hofmann and S. Weigel, Anal. Bioanal. Chem., 2016, 408, 6679–6691 CrossRef CAS PubMed.
- R. J. B. Peters, G. van Bemmel, Z. Herrera-Rivera, H. P. F. G. Helsper, H. J. P. Marvin, S. Weigel, P. C. Tromp, A. G. Oomen, A. G. Rietveld and H. Bouwmeester, J. Agric. Food Chem., 2014, 62, 6285–6293 CrossRef CAS PubMed.
- S. M. Majedi, B. C. Kelly and H. K. Lee, Anal. Chim. Acta, 2013, 789, 47–57 CrossRef CAS PubMed.
- S. Kumar and A. K. Pandey, Sci. World J., 2013, 2013, 162750 Search PubMed.
- C. A. Rice-Evans, N. J. Miller and G. Paganga, Free Radical Biol. Med., 1996, 20, 933–956 CrossRef CAS PubMed.
- E. Tripoli, M. L. Guardia, S. Giammanco, D. D. Majo and M. Giammanco, Food Chem., 2007, 104, 466–479 CrossRef CAS.
- I. A. Janković, Z. V. Šaponjić, M. I. Čomor and J. M. Nedeljković, J. Phys. Chem. C, 2009, 113, 12645–12652 Search PubMed.
- I. A. Janković, Z. V. Šaponjić, E. S. Džunuzović and J. M. Nedeljković, Nanoscale Res. Lett., 2010, 5, 81–88 CrossRef PubMed.
- X. Cao, C. Ma, Z. Gao, J. Zheng, L. He, D. J. McClements and H. Xiao, J. Agric. Food Chem., 2016, 64, 9436–9441 CrossRef CAS PubMed.
- S. Lee, D.-H. Seo, H.-L. Park, Y. Choi and S. Jung, Antonie Van Leeuwenhoek, 2003, 84, 201–207 CrossRef CAS PubMed.
- J. Kurepa, R. Nakabayashi, T. Paunesku, M. Suzuki, K. Saito, G. E. Woloschak and J. A. Smalle, Plant J., 2014, 77, 443–453 CrossRef CAS PubMed.
- L. Yang, X. Jiang, W. Ruan, B. Zhao, W. Xu and J. R. Lombardi, J. Phys. Chem. C, 2008, 112, 20095–20098 CAS.
- Y. Zhang, A. H. Yuwono, J. Li and J. Wang, Micropor. Mesopor. Mat., 2008, 110, 242–249 CrossRef CAS.
- L. Yang, X. Jiang, W. Ruan, J. Yang, B. Zhao, W. Xu and J. R. Lombardi, J. Phys. Chem. C, 2009, 113, 16226–16231 CAS.
- A. Musumeci, D. Gosztola, T. Schiller, N. M. Dimitrijevic, V. Mujica, D. Martin and T. Rajh, J. Am. Chem. Soc., 2009, 131, 6040–6041 CrossRef CAS PubMed.
- L. Yang, X. Jiang, W. Ruan, B. Zhao, W. Xu and J. R. Lombardi, J. Raman Spectrosc., 2009, 40, 2004–2008 CrossRef CAS.
- D. Maznichenko, K. Venkatakrishnan and B. Tan, J. Phys. Chem. C, 2013, 117, 578–583 CAS.
- X. Zhang, Z. Yu, W. Ji, H. Sui, Q. Cong, X. Wang and B. Zhao, J. Phys. Chem. C, 2015, 119, 22439–22444 CAS.
- K. Colwell, Potentially hazardous nanoparticles found in powdered baby formula, http://www.foe.org/news/news-releases/2016-05-potentially-hazardous-nanoparticles-found-in-powdered-baby-formula, accessed 17.05, 2016.
- H. Guo, Z. Zhang, B. Xing, A. Mukherjee, C. Musante, J. C. White and L. He, Environ. Sci. Technol., 2015, 49, 4317–4324 CrossRef CAS PubMed.
- T. Yang, Z. Zhang, B. Zhao, R. Hou, A. Kinchla, J. M. Clark and L. He, Anal. Chem., 2016, 88, 5243–5250 CrossRef CAS PubMed.
- R. A. French, A. R. Jacobson, B. Kim, S. L. Isley, R. L. Penn and P. C. Baveye, Environ. Sci. Technol., 2009, 43, 1354–1359 CrossRef CAS PubMed.
- U. S. Environmental Protection Agency, Field Portable X-ray Fluorescence for the Determination of Elemental Concentrations in Soil and Sediment, 1998, Method 6200 Search PubMed.
- C. Schmitt Pauly, A.-C. Genix, J. G. Alauzun, G. Guerrero, M.-S. Appavou, J. Pérez, J. Oberdisse and P. H. Mutin, Langmuir, 2015, 31, 10966–10974 CrossRef CAS PubMed.
- Y. Ding, W. Zhao, H. Hua and B. Ma, Green Chem., 2008, 10, 910–913 RSC.
- E. G. Ankudey, H. F. Olivo and T. L. Peeples, Green Chem., 2006, 8, 923–926 RSC.
- P. G. Jessop, Green Chem., 2011, 13, 1391–1398 RSC.
- C. Capello, U. Fischer and K. Hungerbuhler, Green Chem., 2007, 9, 927–934 RSC.
- N. Bordenave, B. R. Hamaker and M. G. Ferruzzi, Food Funct., 2014, 5, 18–34 CAS.
Footnote |
| † Electronic supplementary information (ESI) available. See DOI: 10.1039/c7ra02520c |
| This journal is © The Royal Society of Chemistry 2017 |


