DOI:
10.1039/C7RA01616F
(Paper)
RSC Adv., 2017,
7, 21389-21397
Preparation of a Pt/TiO2/cotton fiber composite catalyst with low air resistance for efficient formaldehyde oxidation at room temperature†
Received
8th February 2017
, Accepted 10th April 2017
First published on 18th April 2017
Abstract
For the first time, nano TiO2 was coated on the surface of cotton fiber by a dip-coating method, and then Pt nanoparticles (NPs) were deposited onto the surface of the TiO2/cotton fiber (TC) to obtain a Pt/TiO2/cotton fiber composite (PTC) catalyst by a combined method involving the impregnation of the TiO2/cotton fiber with the Pt precursor and NaBH4-reduction. The prepared PTC sample was used for oxidative decomposition of formaldehyde (HCHO) at room temperature and the effect of Pt loading on catalytic performance was investigated. The results show that the PTC catalyst has much lower air resistance than the powder-like sample, which is of great importance for its actual application, and it can efficiently catalyze oxidation of HCHO into CO2 and H2O. The optimum Pt loading was 0.75 wt%. The PTC catalyst also exhibited good catalytic stability in recycling experiments. The TiO2 coating in the PTC catalysts plays an important role in obtaining a high catalytic activity and a good stability. In situ diffuse reflectance infrared Fourier transformation spectroscopy (DRIFTS) results showed that formate, CO and dioxymethylene (DOM) species are the main intermediate species, and a mechanism for HCHO catalytic oxidation over the PTC catalyst was proposed. This work may promote the actual application of high-performance catalysts for indoor air purification and related catalytic processes due to the merits of low air resistance, light mass, flexible properties, good efficiency of the PTC catalyst, and low cost, as well as cotton being an abundant raw material.
1. Introduction
Because human beings spend most of their time indoors, the quality of indoor air is vital to human health. Formaldehyde (HCHO) is a major indoor pollutant and may cause many health problems, such as eye and skin irritation, nasal tumors, and nasopharyngeal cancer and so on, when people are exposed to air containing-HCHO for a long time.1–3 To purify indoor air, many strategies, including adsorption,4–8 photocatalytic oxidation,9,10 plasma technology,11 thermal catalytic oxidation12–20 and so on, have been adopted to eliminate HCHO in the air. Among them, thermal catalytic oxidation of HCHO into CO2 and H2O at ambient temperature has attracted much attention due to its merits of being environmentally friendly and energy saving.2,12–17 For the catalytic oxidation of HCHO at room temperature, metal oxides (such as MnO2![[thin space (1/6-em)]](https://www.rsc.org/images/entities/char_2009.gif) 21–23) and supported noble metal catalysts have been widely investigated by many groups.12,14–18,24–27 Zhang et al.25 for the first time discovered that HCHO could be catalytically oxidized into CO2 and H2O on the supported noble metal (Pt, Rh, Pd and Au) catalysts at ambient temperature. Huang et al.15,28 developed an impregnation and NaBH4 reduction approach to prepare supported noble metal catalysts (Pt/TiO2, Pd/TiO2) which could efficiently oxidize HCHO into CO2 and H2O at room temperature. Our previous work also showed that HCHO could be completely decomposed into CO2 and H2O over supported Pt catalysts by an impregnation and NaOH-assisted NaBH4 reduction combined method.24,29,30 In the aforementioned catalysts, the supported Pt catalyst revealed better catalytic activity for HCHO oxidation than other catalysts at room temperature. However, most of metal oxide and supported noble metal catalysts were synthesized in powder form, which makes many problems in practical applications, such as bringing the possibility of high air resistance, needing to be pressed into tablets or attached to other big-block supports in use. In order to overcome the drawbacks, we attempted to use the inorganic TiO2 nanofiber by electrospinning31 and honeycomb ceramics (HC)32 as supports to prepare the supported Pt/TiO2 and Pt/HC catalysts. But, the brittle property for the former and the big mass for the latter hinder their actual applications in air purifier. Therefore, it is highly desired to develop a robust, flexible and light-mass, low-air-resistance and highly-efficient catalyst for air purifier. The organic and inorganic composite catalyst may be a good choice and has received much attention in the field of photocatalytic self-cleaning and antibacterial in recent years.33–38
21–23) and supported noble metal catalysts have been widely investigated by many groups.12,14–18,24–27 Zhang et al.25 for the first time discovered that HCHO could be catalytically oxidized into CO2 and H2O on the supported noble metal (Pt, Rh, Pd and Au) catalysts at ambient temperature. Huang et al.15,28 developed an impregnation and NaBH4 reduction approach to prepare supported noble metal catalysts (Pt/TiO2, Pd/TiO2) which could efficiently oxidize HCHO into CO2 and H2O at room temperature. Our previous work also showed that HCHO could be completely decomposed into CO2 and H2O over supported Pt catalysts by an impregnation and NaOH-assisted NaBH4 reduction combined method.24,29,30 In the aforementioned catalysts, the supported Pt catalyst revealed better catalytic activity for HCHO oxidation than other catalysts at room temperature. However, most of metal oxide and supported noble metal catalysts were synthesized in powder form, which makes many problems in practical applications, such as bringing the possibility of high air resistance, needing to be pressed into tablets or attached to other big-block supports in use. In order to overcome the drawbacks, we attempted to use the inorganic TiO2 nanofiber by electrospinning31 and honeycomb ceramics (HC)32 as supports to prepare the supported Pt/TiO2 and Pt/HC catalysts. But, the brittle property for the former and the big mass for the latter hinder their actual applications in air purifier. Therefore, it is highly desired to develop a robust, flexible and light-mass, low-air-resistance and highly-efficient catalyst for air purifier. The organic and inorganic composite catalyst may be a good choice and has received much attention in the field of photocatalytic self-cleaning and antibacterial in recent years.33–38
However, up to date, few attempts have been made to develop such organic and inorganic composite catalyst for room-temperature catalytic oxidation of HCHO in indoor air. Here, we for the first time report the preparation of the Pt/TiO2/cotton fiber composite catalysts and their use for catalytic oxidation of HCHO in air at room temperature. The obtained PTC catalysts show low air resistance, good catalytic performance and stability.
2. Experimental
All reagents used in this work were purchased with analytical grade and directly used without further purification.
2.1 Preparation of TiO2 nanosol
Titania nanosol was synthesized by a hydrolysis method at room temperature using titanium(IV) butoxide (Sinopharm Chemical Reagent Co., Ltd) as the precursor. In a typical procedure, 10 mL of titanium(IV) butoxide was dissolved in 25 mL of ethanol. The resulted solution was added dropwise to 200 mL of 0.04 M nitric acid solution under stirring at room temperature and kept stirring for 6 days to form the uniform and stable TiO2 nanosol.
2.2 Coating TiO2 on the surface of cotton fiber
The commercial absorbent cotton was used as the support because of its low cost, abundant raw material, light mass, and flexible properties. The coating process of TiO2 on the surface of cotton fiber was as follows: the absorbent cotton was firstly immersed in TiO2 nanosol for 5 min, and then taken out and pressed between two pieces of filter paper to remove the excess of liquid. The resulted product was dried in an oven at 60 °C for 5 min and then at 115 °C for 30 min. Finally, the obtained sample was rinsed twice (each for 5 min) with the deionized water and dried at 60 °C overnight to obtain the TiO2/cotton fiber composite, which denoted as TC.
2.3 Preparation of Pt/TiO2/cotton fiber composite catalyst
In a typical synthesis, the obtained TC in above process was immersed in 10 mL of chloroplatinic acid aqueous solution, and kept shaking for 30 min. After that, the mixture (2.5 mL) of NaOH (0.5 M) and NaBH4 (0.1 M) solutions was added into the above solution quickly and kept shaking for 10 min. Finally, the resulted product was separated from the solution and then dried at 60 °C overnight. The nominal weight of Pt to support was 0.1, 0.25, 0.5, 0.75, 1 wt%, respectively. The corresponding samples are denoted as PTC0.1, PTC0.25, PTC0.5, PTC0.75, and PTC1.0. The real content of Pt determined by inductively coupled plasma atomic emission spectroscopy (ICP-AES) was 0.05, 0.14, 0.25, 0.36, and 0.46 wt% for the PTC0.1, PTC0.25, PTC0.5, PTC0.75, and PTC1.0 samples, respectively (shown in Table 1).
Table 1 The basic parameters for the as-synthesized samples
| Samples |
SBET (m2 g−1) |
Vpore (cm3 g−1) |
dpore (nm) |
Pt wt% by ICP-AES |
| Cotton |
26.5 |
0.020 |
3.0 |
— |
| TC |
16.4 |
0.018 |
4.51 |
— |
| PC0.5 |
3.6 |
0.009 |
10.2 |
0.25 |
| PTC0.1 |
18.4 |
0.021 |
4.61 |
0.05 |
| PTC0.25 |
17.5 |
0.020 |
4.63 |
0.14 |
| PTC0.5 |
10.7 |
0.015 |
5.82 |
0.25 |
| PTC0.75 |
7.2 |
0.012 |
6.12 |
0.36 |
| PTC1.0 |
4.9 |
0.008 |
7.14 |
0.46 |
For comparison, the 0.5 wt% Pt/cotton catalyst was also prepared using cotton as support directly, which is denoted as PC0.5. The real content of Pt was 0.25 wt% for the PC0.5 sample.
2.4 Characterization
The crystal phase composition of the samples was analyzed by a D8 X-ray diffractometer (Bruker) with Cu Kα radiation at a scan rate (2θ) of 0.05° s−1. Transmission electron microscopy (TEM) and high-resolution transmission electron microscopy (HRTEM) images were obtained on a Tecnai G2 F20 microscope at an accelerating voltage of 200 kV. X-ray photoelectron spectroscopy (XPS) studies were performed on VG ESCALAB250xi with X-ray monochromatisation. The C 1s peak at 284.6 eV of the surface adventitious carbon was used as a reference for all binding energies (BE). The Brunauer–Emmett–Teller (BET) surface area (SBET) of the samples was acquired from nitrogen adsorption data recorded on a Micromeritics ASAP 3020 nitrogen adsorption apparatus (USA). All the samples were degassed at 120 °C before nitrogen adsorption measurements. The BET surface area was calculated from the adsorption data by a multipoint method in the relative pressure range of P/P0 = 0.05–0.3. The pore size distributions were determined using adsorption isotherms by the Barrett–Joyner–Halenda (BJH) method, and supposing a cylindrical pore model. The single point nitrogen adsorption total pore volume at the relative pressure of P/P0 = 0.99 was used to determine the pore volume and average pore size.
In situ diffuse reflectance infrared Fourier transformations spectroscopy measurement was carried out on a Thermo Fisher 6700 instrument. The catalyst was pretreated at 120 °C for 2 h under a gas flow of dried air in situ cell reactor. After that, the reactant gas mixture (80 ppm of HCHO + O2) was introduced into the DRIFTS cell at room temperature by a mass flow controller with a flow rate of 30 mL min−1. All spectra were obtained after subtracting the background. Scans were collected from 4000 to 650 cm−1 with a resolution of 4 cm−1.
2.5 Air resistance experiment
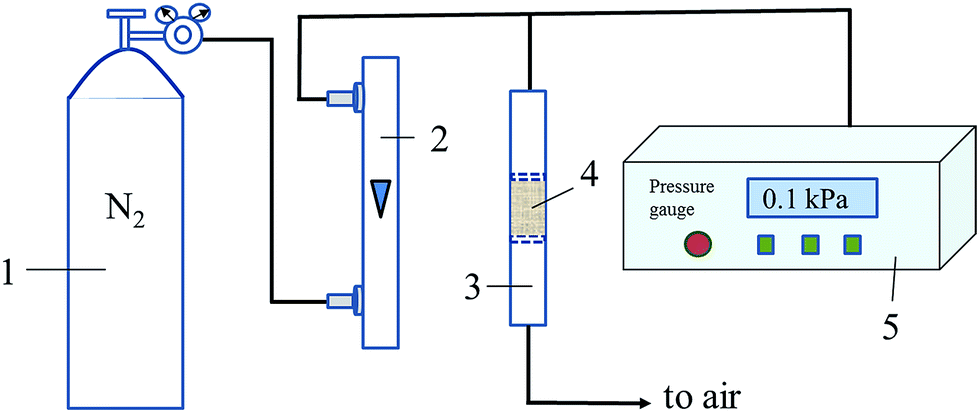
Air resistance experiment was carried out in a home-made setup, as shown in Fig. 1. The PTC or TC sample (18 mg) was loaded and kept tight (volume: 0.31 cm3) in a tube (inner diameter: 6 mm) with its outlet connected to air and its inlet connected with a precision digital pressure gauge (DP-AF, Sanli Electronics). The pressure gauge can detect and reveal the pressure difference between the pressure in the pipe before inlet of tube and the atmospheric pressure outside. N2 flow (120 mL min−1) was introduced into the tube with sample inside. The readings on the pressure gauge are used to evaluate the magnitude of air resistance of the samples. The bigger reading on the pressure gauge will be when the higher air resistance of the sample is. As a comparison, the powder-like Pt/TiO2 (P25, Degussa) sample (prepared in the same way with literature24) with the same volume or the same mass with PTC was used for air resistance test in the same way, and the corresponding measured pressure differences are presented as Δpvolume and Δpmass, respectively.
 |
| | Fig. 1 Schematic diagram for measuring air resistance of the samples. (Here, (1) N2 cylinder; (2) rotor flowmeter; (3) sample tube; (4) sample; (5) precision digital pressure gauge). | |
2.6 Catalytic activity evaluation
The HCHO catalytic oxidation test was performed under a dark condition at 20 °C and 50–60% relative humidity in the same way as it is reported in our previous work.24,29 0.3 g of catalyst was used to evaluate the catalytic activity of the prepared samples and HCHO initial concentration was kept about 150 ppm. A Photoacoustic IR Multigas Monitor (INNOVA air Tech Instruments Model 1412) was used to on-line monitor the HCHO and CO2 concentrations. The time for each set of experiment was fixed to be 60 min. The HCHO concentration decrease and CO2 concentration increase (ΔCO2, which is the difference of CO2 concentration at t reaction time and at initial time, ppm) were used to evaluate the catalytic performance.
3. Results and discussion
3.1 Results of air resistance measurement
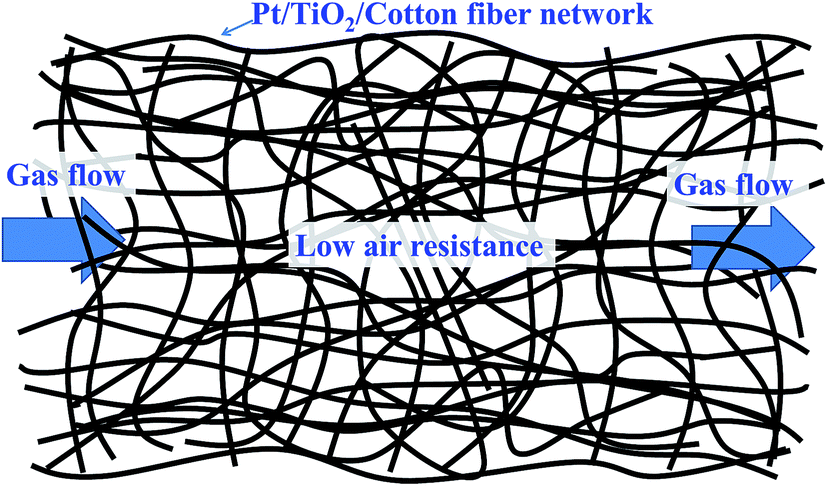
The results of air resistance experiment for the as-prepared samples are shown in Table 2. When the PC and PTC sample were loaded in the tube, the pressure differences are 0.15 and 0.11 kPa, respectively. However, when the powder-like Pt/TiO2 sample was loaded in the tube, the pressure differences are 8.88 and 30.75 kPa for the powder-like Pt/TiO2 sample with the same mass and the same volume as PTC, respectively, indicating that much lower air resistance for the TC and PTC samples and much higher air resistance for the powder-like Pt/TiO2 sample. The much lower air resistance for the PTC sample (similar to TC) is due to the large number of macropores existing among the cotton fibers and facilitating gas flow through (see Fig. 2), which is of great importance for the application of the catalyst in air purifier.
Table 2 Results of air resistance experiment for the as-synthesized samples
| Samples |
Δpvolume (kPa) |
Δpmass (kPa) |
| TC |
0.15 |
|
| PTC1.0 |
0.11 |
|
| Pt/TiO2 |
30.75 |
8.88 |
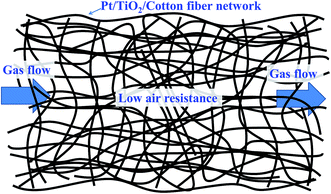 |
| | Fig. 2 Schematic diagram for gas flow through porous Pt/TiO2/cotton fiber network. | |
3.2 Phase structures, morphology and element composition
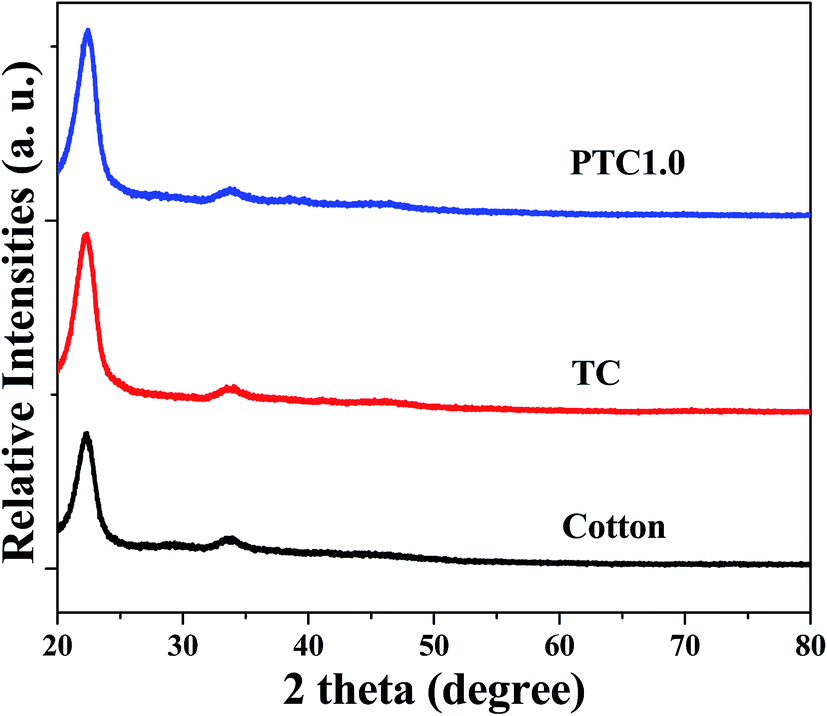
The phase structures of cotton before and after coating TiO2 as well as depositing Pt NPs on its surface were investigated by X-ray diffraction (XRD) with the diffraction angle (2θ) in the range 20–80 °C. The XRD patterns of the cotton, PC and PTC1.0 samples are shown in Fig. 3. From the Fig. 3, it reveals that two peaks located at ca. 23° and 34° belong to the typical characteristic peaks of cellulose fibers.33,34 No TiO2 peaks (such as: most intensive peak located at 25.3° for anatase and 28.4° for rutile, respectively) can be observed for the TC and PTC1.0 samples, indicating that most of TiO2 on the surface of cotton are amorphous, which is mainly due to the hydrolysis process taking place under the room temperature. At the same time, no Pt characteristic peaks also can be observed in the XRD pattern of the PTC1.0 sample, which may be due to the low content, small size and good dispersion of Pt NPs.24,29
 |
| | Fig. 3 XRD patterns of the cotton, PC and PTC1.0 samples. | |
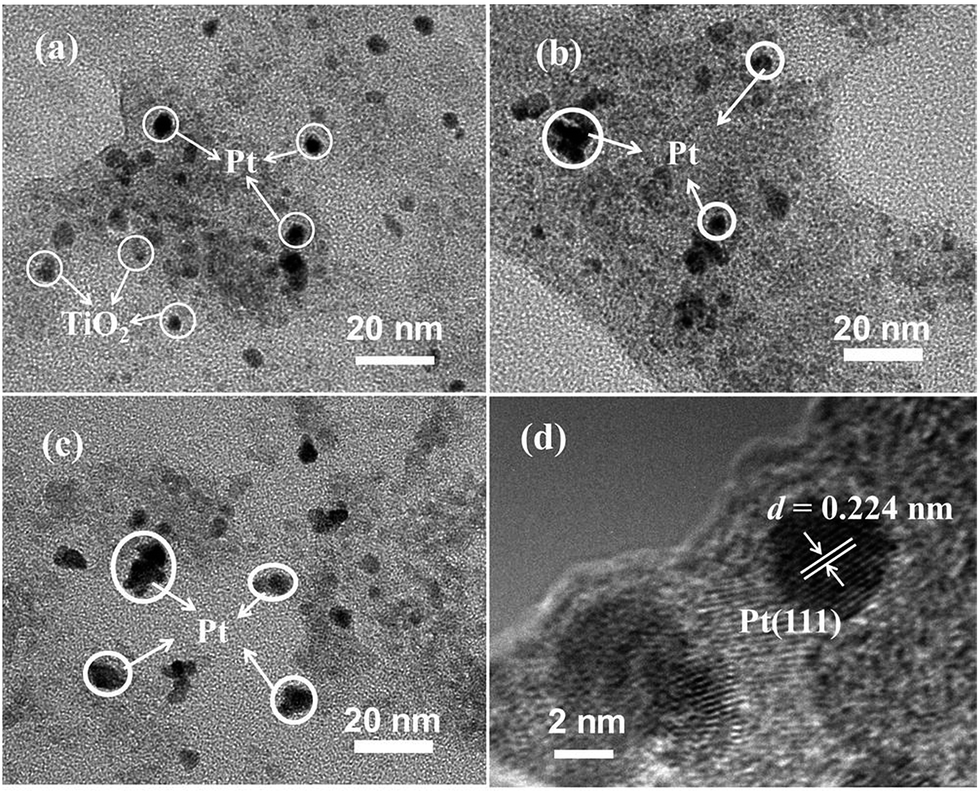
The typical surface morphology of cotton before and after coating TiO2 as well as depositing Pt NPs was observed by FESEM, as shown in Fig. 4. Fig. 4a and b show the typical morphology of crude cotton, indicating the surface of crude cotton is rather rough. After deposition TiO2, the TiO2 coating can be clearly observed and the surface of cotton becomes smooth (shown in Fig. 4c and d), indicating very small TiO2 NPs was formed in the sol by the hydrolysis method. Further depositing Pt NPs, the surface of TC doesn't show an obvious change (see Fig. 4e and f). The morphology and particle size of TiO2 and Pt NPs were further observed by TEM (see Fig. 5a–c) and HRTEM images (see Fig. 5d). Fig. 5a shows the typical TEM image of the PTC0.25 sample, which indicates that the sizes of TiO2 and Pt (black dots) are about 2–6 nm and 3–7 nm, respectively. The results confirm the analysis of FESEM images. With increasing the Pt loading, the size of Pt NPs increases slightly from about 3–7 nm of PTC0.25 to 5–15 nm for the PTC1.0 sample. The HRTEM image of the PTC0.25 sample (Fig. 5d) reveals that the lattice spacing of 0.224 nm can be seen, which is consistent with the lattice spacing of (111) planes of metallic Pt.24,29 And the Pt particle size is about 4 nm.
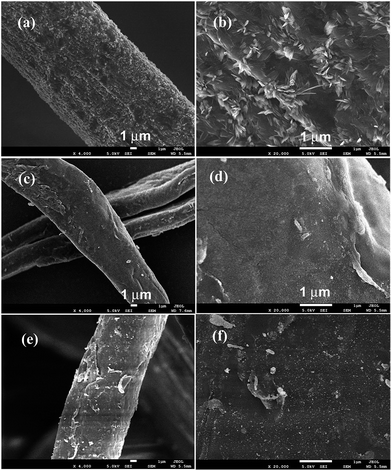 |
| | Fig. 4 Typical SEM images of the cotton fiber (a, b), TC (c, d) and PTC1.0 (e, f) samples. | |
 |
| | Fig. 5 Typical TEM images of the PTC0.25 (a), PTC0.5 (b) and PTC1.0 (c) samples, and HRTEM image (d) of the PTC0.25 sample. | |
3.3 Nitrogen adsorption
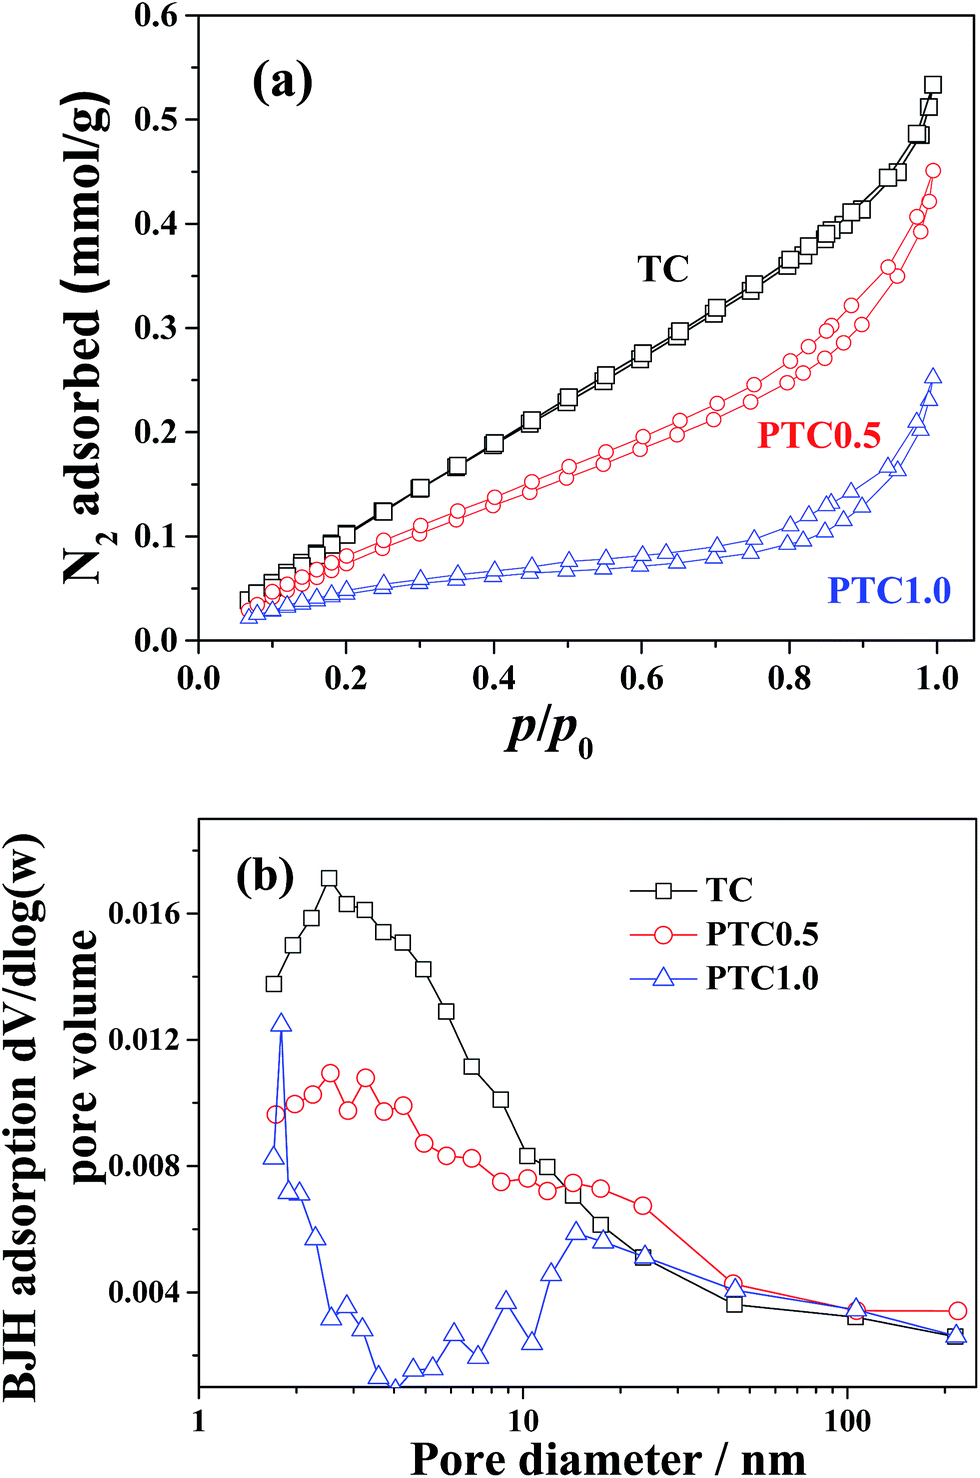
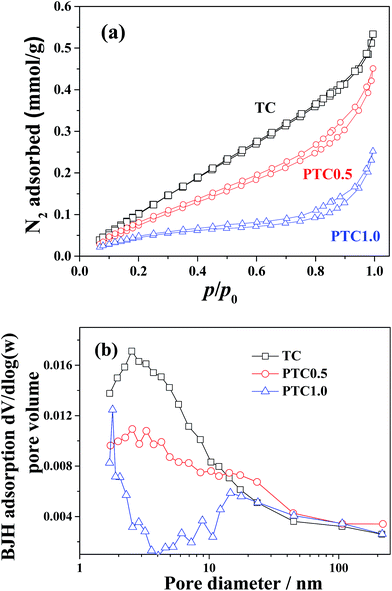
The N2 adsorption–desorption isotherms and corresponding pore size distribution curves of the TC, PTC0.5 and PTC1.0 samples were plotted in Fig. 6. The N2 adsorption–desorption isotherms (shown in Fig. 6a) of the above three samples are of type IV according to the classification of IUPAC (International Union of Pure and Applied Chemistry),39 suggesting the existence of mesopores. With increasing the Pt content from 0 wt% to 1.0 wt%, the isotherms of the PC, PTC0.5 and PTC1.0 samples go downwards obviously, indicating an obvious decrease of the specific surface area for above three samples with the increase of Pt content. Also, the hysteresis loops for the three samples are like H3 type for at a high relative pressure range between 0.4 and 1.0, which also suggests the existence of mesoporous pore. The pore-size distribution curves (shown in Fig. 6b) obtained from the adsorption branch of the isotherms further reveal the existence of mesopores. A wide pore size distribution (2–100 nm) is found for the TC, PTC0.5 and PTC1.0 samples with smaller mesopores (peak pore at about 2–3 nm) and larger mesopores (peak pore at around 16–18 nm). The BET surface area (SBET), pore volume (Vpore) and pore size (dpore) of the cotton, TC, PC0.5 and PTC samples are listed in Table 1, showing a totally decreasing tendency of the specific surface areas and pore volume as well as a slightly increasing average pore sizes for the PTC samples with increasing the Pt content. Two reasons possibly lead to the decreasing specific surface areas for the PTC samples with increasing the Pt content: one is the larger density of Pt than TiO2 and cotton; another is a partial coverage of TC's surface by the Pt NPs and Na+ from the raw materials (NaBH4 and NaOH).24 Also, compared with cotton, a significant decrease for the surface area and pore volume of PC0.5 can be observed. The surface area of PC0.5 decreased to 3.6 m2 g−1 from 26.5 m2 g−1 of cotton due to the similar reasons. However, the PTC0.5 sample obtained after depositing TiO2 coating can maintain a relative high surface area (10.7 m2 g−1). It is worthy mentioned that the high surface area of catalyst is beneficial to the catalytic process.
 |
| | Fig. 6 Nitrogen adsorption–desorption isotherms (a) and the corresponding pore-size distribution curves (b) for the TC, PTC0.5 and PTC1.0 samples, respectively. | |
3.4 XPS analysis
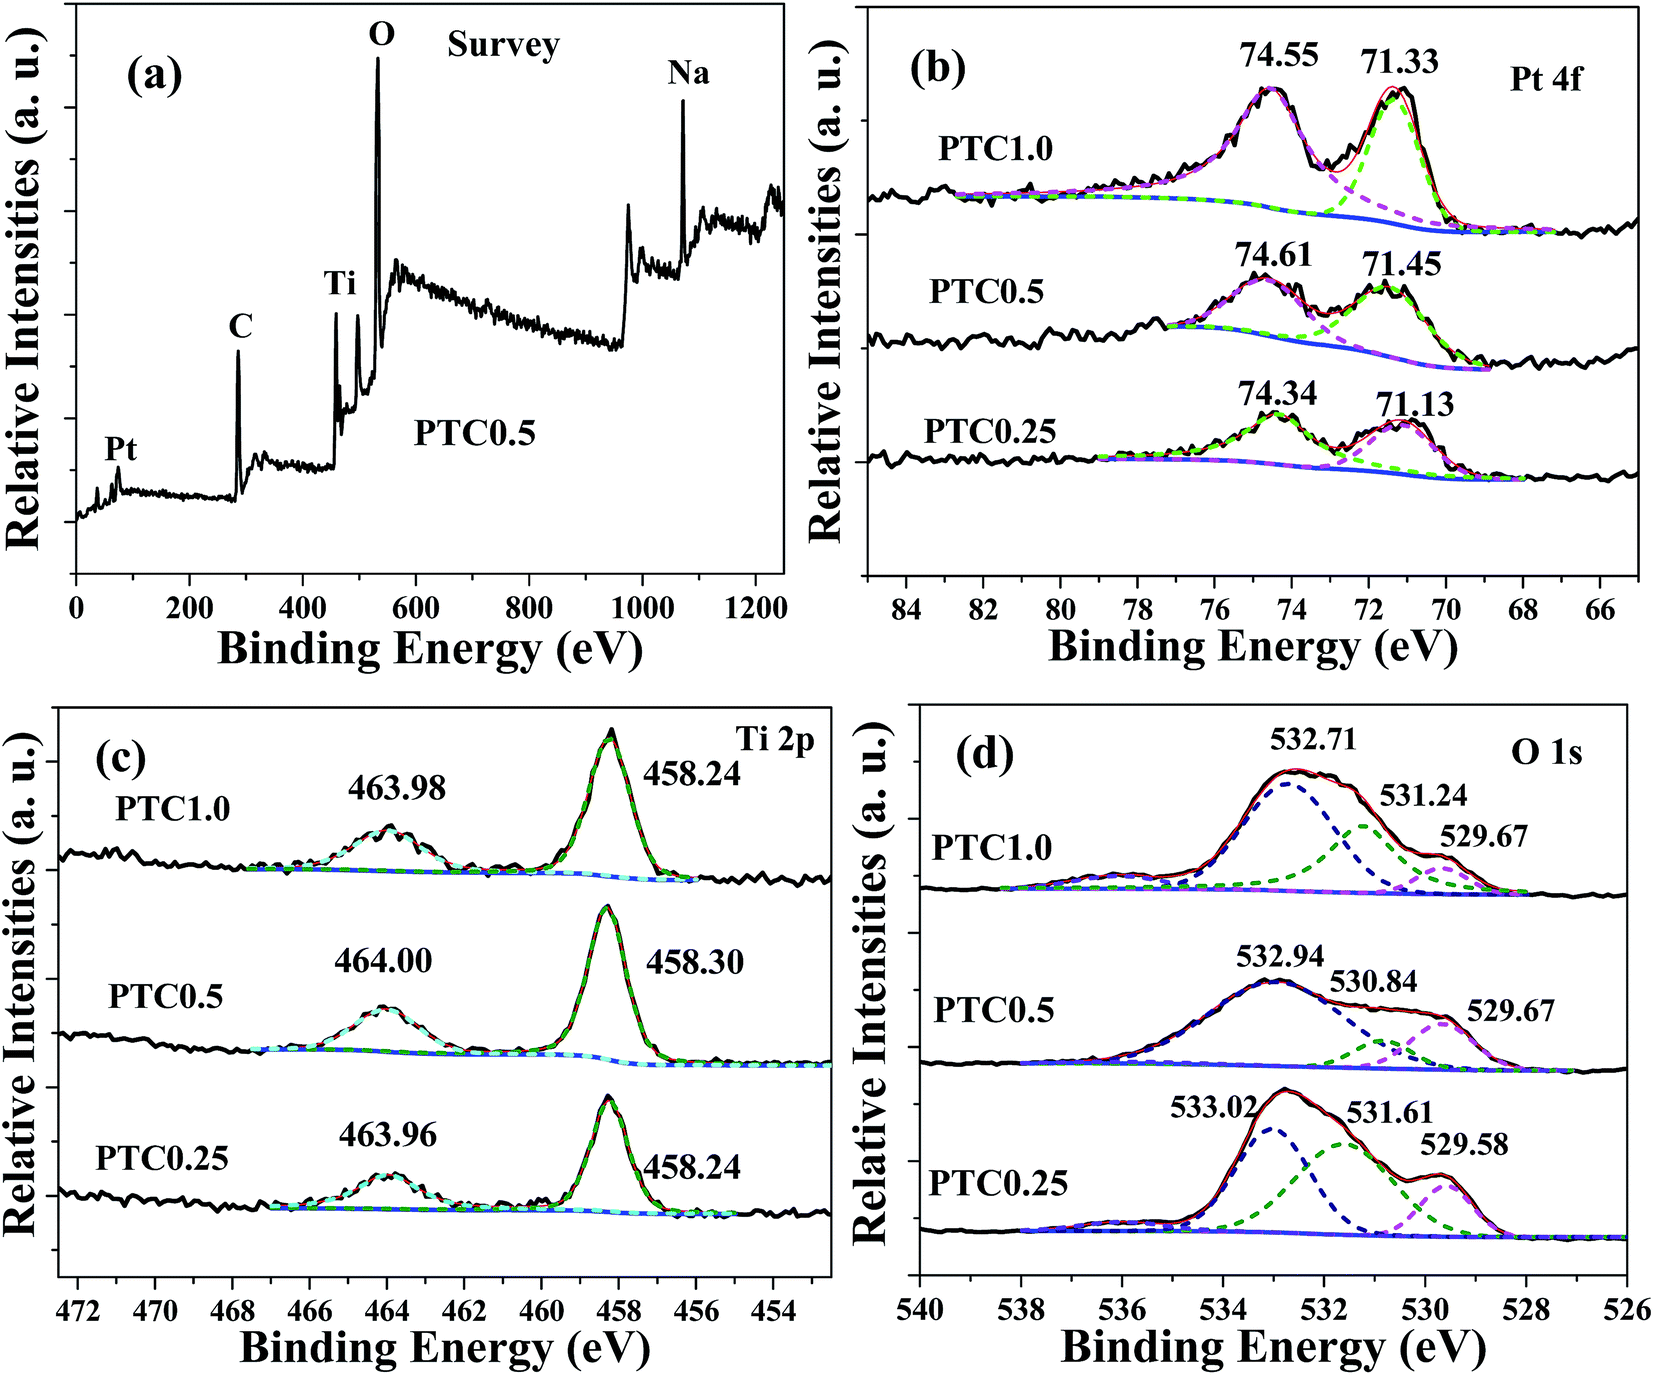
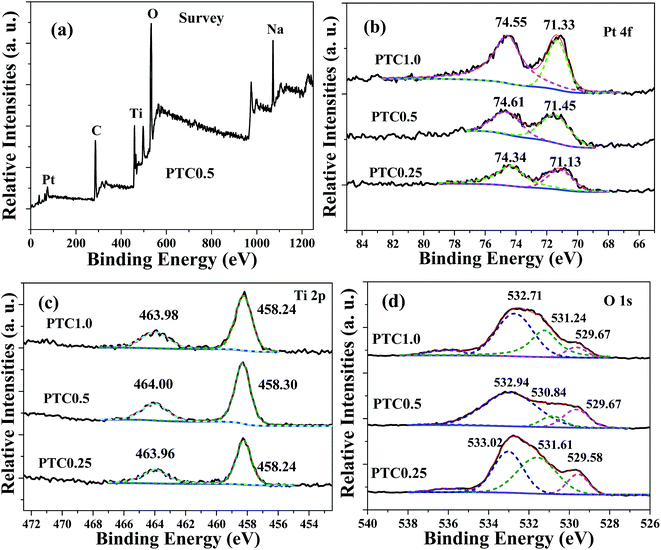
X-ray photoelectron spectroscopy (XPS) was used to analyze the chemical status of elements in the samples. The XPS survey spectrum (shown in Fig. 7a) of the PTC0.5 sample shows the presence of Pt, C, Ti, O and Na elements, further confirming the existence of TiO2 coating on the surface of cotton and Pt NPs deposited on the surface of TC. Among them, sodium element comes from the residual Na+ due to using NaOH and NaBH4 as the reactants. The high-resolution Pt 4f spectra of the PTC0.25, PTC0.5 and PTC1.0 samples are shown in Fig. 7b. The two peaks located at 71.13–71.45 eV and 74.34–74.61 eV can be attributed to Pt 4f7/2 and Pt 4f5/2 of metallic Pt, respectively.24,28 The intensities of Pt 4f peaks increase with the Pt loading. Fig. 7c reveals the high-resolution XPS spectra of Ti 2p for the PTC0.25, PTC0.5 and PTC1.0 samples. The observed two peaks at ca. 463.96–464.00 and 458.24–458.30 eV belong to Ti 2p1/2 and Ti 2p3/2 of Ti4+ in TiO2, respectively. The high-resolution XPS spectra of O 1s for the PTC0.25, PTC0.5 and PTC1.0 samples are shown in Fig. 7d, the fitting peaks located at 532.71–533.02 eV, 530.84–531.61 eV and 529.58–529.67 eV can be observed. The two components at 532.71–533.02 eV and 530.84–531.61 eV can be assigned to the oxygen species (O 1s) of organic O in cotton and the oxygen of the surface hydroxyl (OH) groups,34 respectively. The peak located at 529.58–529.67 eV corresponds to the O 1s core level of the O2− anions in the TiO2.24,34
 |
| | Fig. 7 Survey spectrum of the PTC0.5 sample (a), and high-resolution XPS spectra for Pt 4f (b), Ti 2p (c) and O 1s (d) of the PTC0.25, PTC0.5 and PTC1.0 samples. | |
3.5 Evaluation of catalytic activity
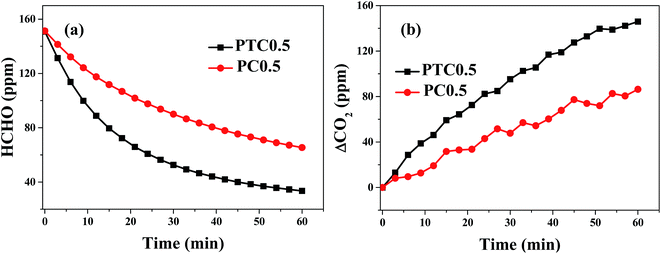
A comparison of catalytic activity for the PTC0.5 and PC0.5 catalysts are shown in Fig. 8. Formaldehyde concentration/ΔCO2 as a function of reaction time are shown in Fig. 8a and b, which show that the declined rate of HCHO concentration and the improved rate of CO2 concentration over PTC0.5 is higher than those over PC0.5, indicating PTC0.5 is more active than PC0.5 towards HCHO oxidation.
 |
| | Fig. 8 Changes in formaldehyde concentration (a) and ΔCO2 (the difference between CO2 concentration at t reaction time and initial time, ppm) (b) as a function of reaction time for the PC0.5 and PTC0.5 samples. | |
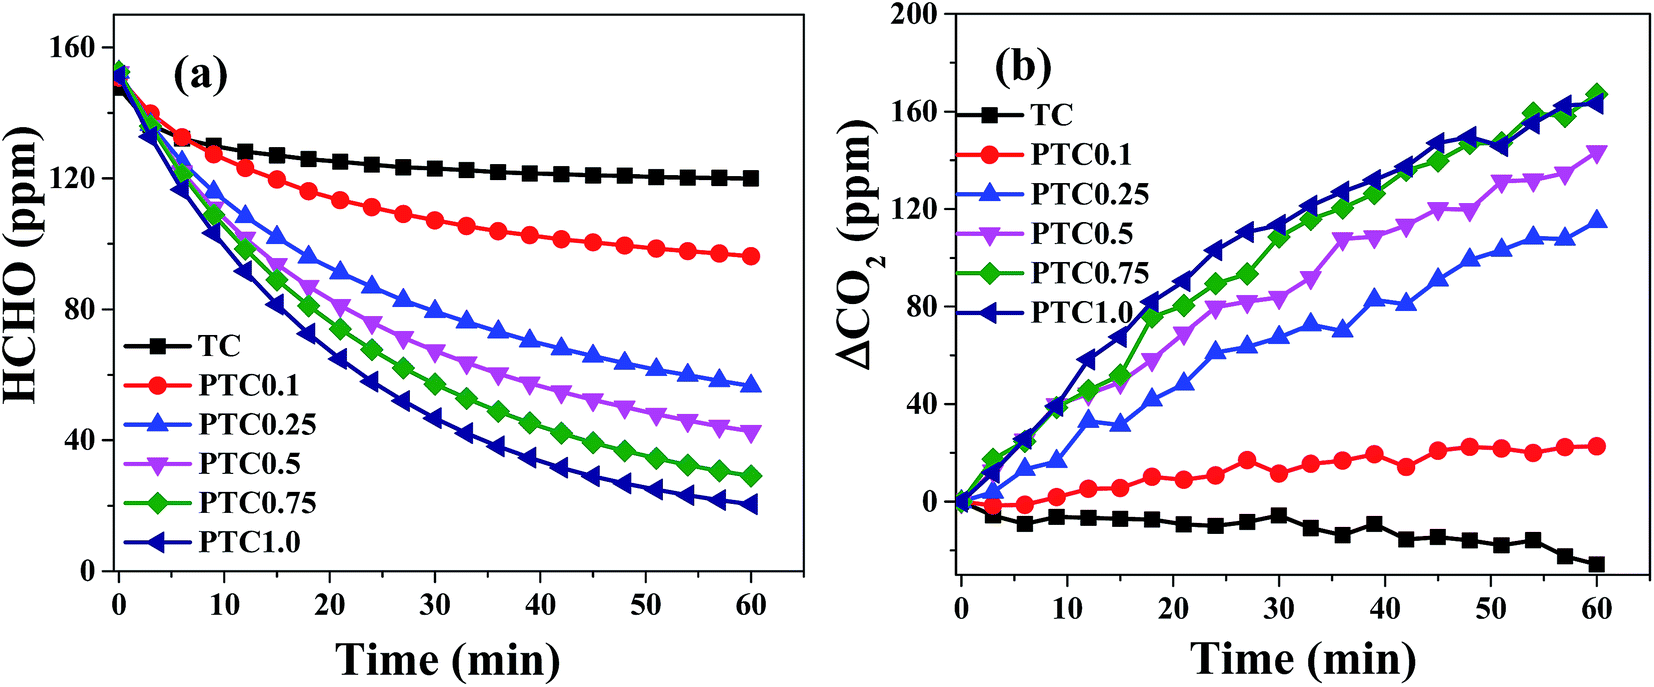
The catalytic activity of the synthesized samples with different Pt content for HCHO oxidation was investigated (shown in Fig. 9). Fig. 9a and b show formaldehyde concentration/ΔCO2 as a function of reaction time for the samples with different Pt content. For TC without Pt depositing, the concentration of HCHO and CO2 decreases slightly with time, indicating the reduced HCHO was not oxidized into CO2 but mainly adsorbed on the surface of TC. After depositing Pt on TC, the concentration of HCHO decreases and the corresponding CO2 concentration increases, indicating that HCHO can react with O2 to form CO2 and H2O at different reaction rate over the PTC catalysts with different Pt content. In the range of 0.10–0.75 wt% of Pt content, the declined rate of HCHO concentration and the improved rate of CO2 concentration raise with increasing Pt content, indicating the increasing rate of HCHO oxidation with the Pt loading. When the Pt content further increases to 1 wt%, no obvious increase of HCHO oxidation activity is found. From the results of TEM images, the Pt particle size is slightly increases with the Pt content, indicating the number of Pt NPs and surface active Pt atoms generally increases with Pt loading in the range of 0.1–0.75 wt%. But further increasing the Pt loading to 1.0 wt%, the number of surface active Pt atoms may not have obvious increase due to the growth and aggregation of Pt NPs. At the same time, the BET surface areas of the PTC samples generally decrease with Pt loading. Therefore, combined with the results of TEM images and BET analysis, the catalytic activity increases with Pt content in the range of 0.1–0.75 wt% and no obvious increase of catalytic activity was observed when Pt content increasing to 1.0 wt%. Thus, 0.75 wt% is the optimal Pt content in view of both activity and cost.
 |
| | Fig. 9 Changes in formaldehyde concentration (a) and ΔCO2 (b) as a function of reaction time for the PTC samples with different Pt content. | |
Compared with our previous results,31 the rates of the HCHO concentration decrease (96 ppm in 1 h) and the corresponding CO2 concentration increase (115 ppm in 1 h) for the PTC0.25 sample (0.14 wt% real Pt content) is slightly less than those (125 ppm increase for HCHO, 181 ppm decrease for CO2 in 1 h) for the powder-like Pt/P25 sample (0.15 wt% real Pt content) prepared in similar way in literature,31 indicating the former is slightly less active than the latter. However, the air resistance for the PTC sample is much lower than that of the powder-like Pt/P25 sample, therefore, the PTC sample is more suitable for the direct application in air purifier.
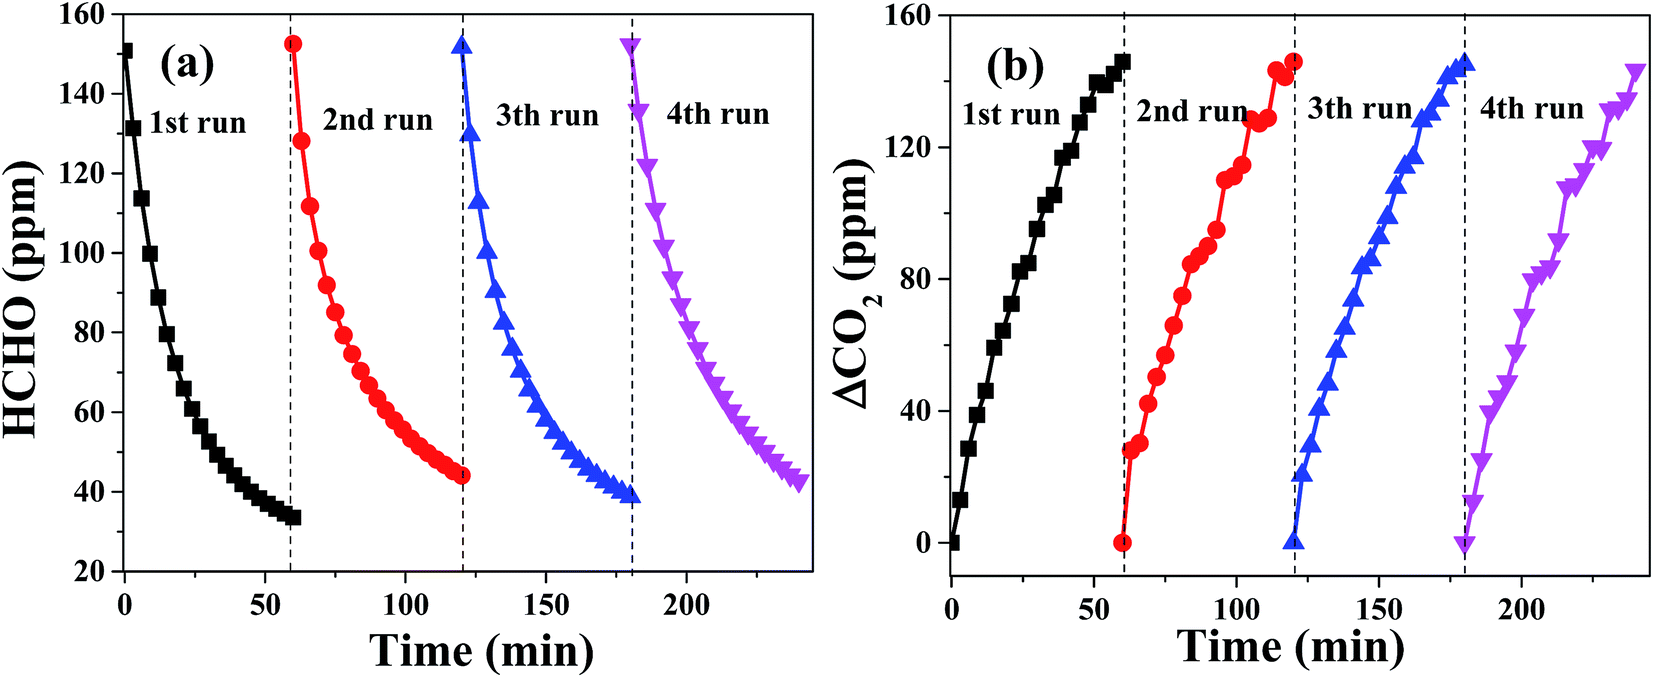
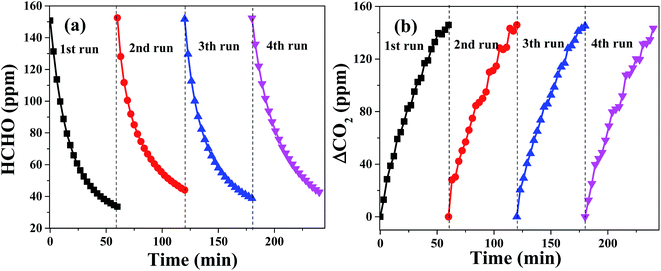
The stability of catalysts and their catalytic activity are also significant for their actual applications. For the purpose of evaluating the stability of PTC in oxidation of HCHO, the HCHO oxidation reaction over PTC0.5 was performed for four times in cycling experiments and the results are revealed in Fig. 10. It can be seen from it that the consuming rate of HCHO (see Fig. 10a) and the generation rate of CO2 (see Fig. 10b) over PTC0.5 in 4 repeated tests keep almost unchanged in contrast with those showed in the first-cycle, suggesting that the PTC0.5 sample exhibits a stable and good catalytic performance. Also, the stability of catalytic activity for the PC0.5 sample is also shown in Fig. S1,† which shows that an obvious declined catalytic activity was observed for PC0.5 in repeated test (see), implying the poor stability of catalytic activity of PC0.5.
 |
| | Fig. 10 Changes in formaldehyde concentration (a) and ΔCO2 (b) as a function of reaction time for the PTC0.5 sample in four repeated tests. | |
Why the PTC0.5 sample showed not only a higher catalytic activity but also a better stability compared with the PC0.5 sample? One of reasons is that the deposition of TiO2 helps the PTC0.5 catalyst to have a relative high surface area (the surface areas are 3.6 and 10.7 m2 g−1 for PC0.5 and PTC0.5, respectively. See Table 1). The second reason is that, more importantly, the TiO2 coating also benefits the activation of O2 due to the formation of oxygen vacancies at the metal-support interface of Pt/TiO2 (ref. 28) and the adsorption of HCHO.24 Therefore, the TiO2 coating in PTC catalysts plays an important role in obtaining a high catalytic activity and a good stability.
3.6 In situ DRIFTS analysis
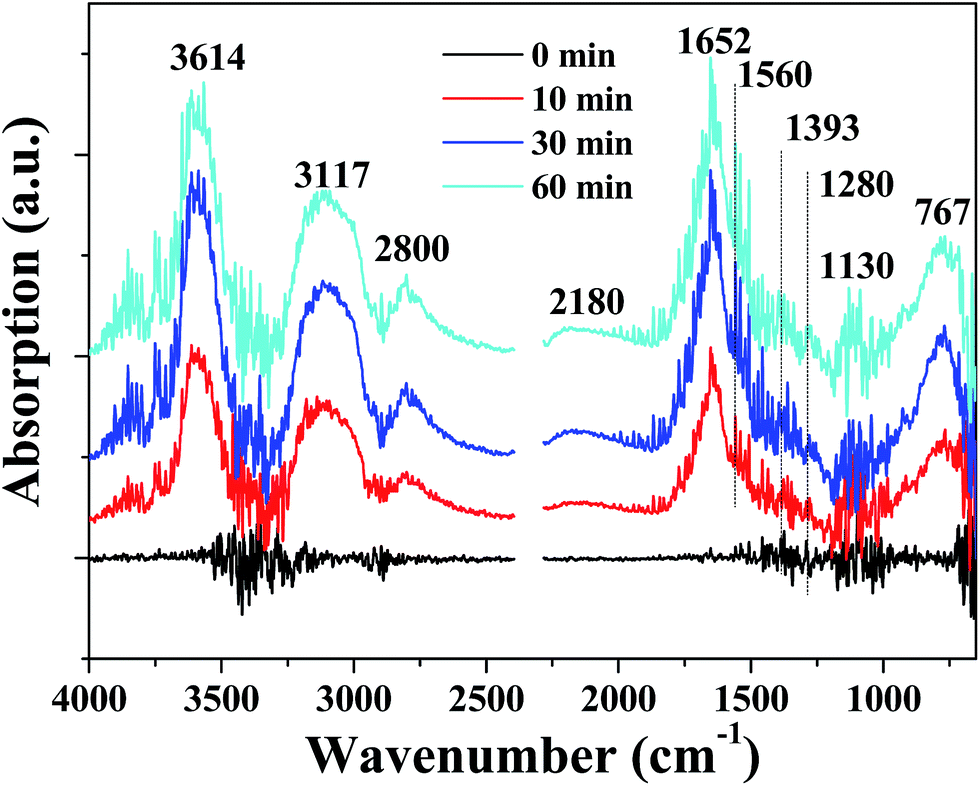
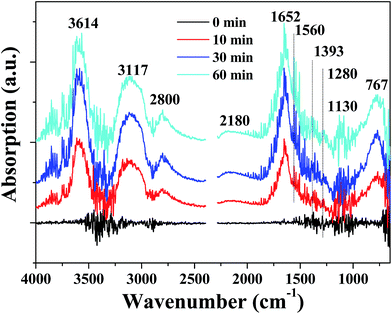
In order to detect the intermediate species in catalytic oxidation of formaldehyde, in situ DRIFTS spectra were acquired when the PTC catalyst was exposed to mixture of HCHO + O2 at room temperature, and the results are revealed in Fig. 11. The bands located at 3614, 3117, 2800, 2180, 1652, 1560, 1393, 1280, 1130 and 767 cm−1 emerged after the PTC catalyst contacted with the mixture of HCHO + O2. And the bands intensified gradually with the contact time in the first 30 min and then maintained a constant level after ca. 30 min. The peaks located at 1652 and 1560 cm−1 are attributed to the asymmetric stretching (vas) of COO of formic acid,26,40,41 and the band at 1393 and 1280 cm−1 are ascribed to the symmetric stretching (vs) of COO of formate species.26,42 The band located at 2800 cm−1 belongs to CH stretching of formate species.27,42 The presence of about 767 cm−1 band further confirms the existence of formate species.43 Furthermore, the presence of peaks at 3614 and 3117 cm−1 are attributed to the OH group of formate species and OH groups of water formed during the HCHO oxidation process,27,42 respectively. A very weak band appearing at 2180 and 1130 cm−1 are ascribed to linear CO adsorbed on Pt44,45 and DOM species,46–48 respectively. The results suggest the partial oxidation of formaldehyde into DOM and further reaction with surface active O species to form formate species. No characteristic peaks related to HCHO were observed, suggesting that the complete decomposition reaction of HCHO took place on the surface of PTC, which also showed that the PTC catalyst exhibited a good catalytic activity. The results of in situ DRIFTS reveal that formic species, CO and DOM are the main intermediate species and water is one of products during the HCHO oxidation, respectively.
 |
| | Fig. 11 In situ DRIFTS spectra of the PTC0.5 catalyst under a flow of HCHO/O2 at room temperature and different reaction time. | |
3.7 Catalytic mechanism analysis
Based on the results of in situ DRIFTS measurement and the previous reports,24,26,44,45,49 the schematic mechanism diagram for HCHO catalytic oxidation decomposition over PTC can be illustrated in Fig. 12. In step I, reactant molecules (HCHO and O2) are firstly adsorbed onto the surface of PTC. Among them, HCHO molecules are adsorbed on the surface of catalyst (such as weakly bonding with H of OH groups on the surface of catalysts), which results in the positive charging of C atom of HCHO molecule. However, O2 molecule are adsorbed on the surface of Pt NPs by chemical dissociation to form adsorbed active O atom species.32,50 Then, adsorbed HCHO is attacked by adsorbed active O atom to form DOM species (step II) and further change into adsorbed formate species owing to the charge redistribution and molecular rearrangement (step III and IV). After that, the surface formate species lose one water molecule (H2O) (step V) and the remaining adsorbed CO on the surface of Pt are further oxidized into the product of CO2 molecule with another active O atom (step VI). In the last two steps, the product of adsorbed nonpolar CO2 molecules can't be observed by in situ DRIFTS technique due to the extremely weak adsorption and fast desorption from the surface of catalysts. However, the product of adsorbed polar H2O molecules can be observed by in situ DRIFTS technique due to relative strong adsorption on the surface of catalysts.
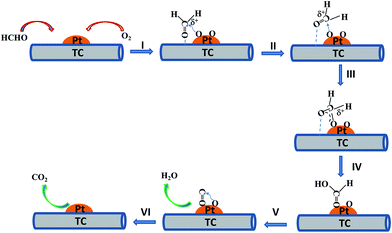 |
| | Fig. 12 Schematic mechanism diagram for HCHO oxidative decomposition over the PTC catalyst. | |
4. Conclusions
The Pt/TiO2/cotton fiber composite catalyst was prepared by an impregnation of TiO2/cotton fiber with Pt precursor and NaBH4-reduction combined method, and HCHO can be efficiently catalytically decomposed into CO2 and H2O over the PTC catalyst at room temperature. The optimum Pt loading is 0.75 wt%. The PTC catalyst also exhibited good catalytic stability in recycled experiments and much lower air resistance than the powder-like sample, which is vital for its actual application. And the TiO2 coating in PTC catalysts plays an important role in obtaining a high catalytic activity and a good stability. The formate, CO and DOM species are the main intermediate species in the catalytic oxidation of HCHO, which can be further oxidized into CO2 and H2O. In view of the merits of low cost and abundant raw materials for cotton, low air resistance, light mass, flexible properties and good efficiency for the PTC catalyst, this work may promote the practical application of high-performance catalysts for indoor air purification and related catalytic processes. Note that one of drawbacks of this kind of catalytic composite materials is that they are not suitable for the high-temperature reaction considering their organic supports. And more work will be done on improving the real Pt loading in catalysts in future work.
Acknowledgements
This work was supported by the Natural Science Foundation of China (51572074), Young and Middle-aged Project in Hubei Province Department of Education (Q20121403), Project from Jiangsu Key Laboratory of Atmospheric Environment Monitoring and Pollution Control of Nanjing University of Information Science and Technology, Jiangsu Province Innovation Platform for Superiority Subject of Environmental Science and Engineering (KHK1207).
References
- T. Salthammer, S. Mentese and R. Marutzky, Chem. Rev., 2010, 110, 2536–2572 CrossRef CAS PubMed.
- L. Nie, J. Yu, M. Jaroniec and F. F. Tao, Catal. Sci. Technol., 2016, 6, 3649–3669 CAS.
- J. J. Collins, R. Ness, R. W. Tyl, N. Krivanek, N. A. Esmen and T. A. Hall, Regul. Toxicol. Pharmacol., 2001, 34, 17–34 CrossRef CAS PubMed.
- J. Ye, X. Zhu, B. Cheng, J. Yu and C. Jiang, Environ. Sci. Technol. Lett., 2017, 4, 20–25 CrossRef CAS.
- Z. Xu, J. Yu and W. Xiao, Chem.–Eur. J., 2013, 19, 9592–9598 CrossRef CAS PubMed.
- Y. Le, D. Guo, B. Cheng and J. Yu, Appl. Surf. Sci., 2013, 274, 110–116 CrossRef CAS.
- Z. Xu, J. Yu, J. Low and M. Jaroniec, ACS Appl. Mater. Interfaces, 2014, 6, 2111–2117 CAS.
- P. Zhou, X. Zhu, J. Yu and W. Xiao, ACS Appl. Mater. Interfaces, 2013, 3, 8165–8172 Search PubMed.
- R. C. W. Lama, M. K. H. Leung, D. Y. C. Leung, L. L. P. Vrijmoedb, W. C. Yamc and S. P. Ng, Sol. Energy Mater. Sol. Cells, 2007, 91, 54–61 CrossRef.
- J. Yu, S. Wang, J. Low and W. Xiao, Phys. Chem. Chem. Phys., 2013, 15, 16883–16890 RSC.
- W. Liang, J. Li, J. Li, T. Zhu and Y. Jin, J. Hazard. Mater., 2010, 175, 1090–1095 CrossRef CAS PubMed.
- C. Zhang and H. He, Catal. Today, 2007, 126, 345–350 CrossRef CAS.
- L. Liu, H. Tian, J. He, D. Wang and Q. Yang, J. Environ. Sci., 2012, 24, 1117–1124 CrossRef CAS.
- B. Liu, C. H. Hsieh, W. Wang, C. Huang and C. Huang, Chem. Eng. J., 2013, 232, 434–441 CrossRef CAS.
- H. Huang and D. Y. C. Leung, ACS Catal., 2011, 1, 348–354 CrossRef CAS.
- N. An, W. Zhang, X. Yuan, B. Pan, G. Liu, M. Jia and W. Yan, Chem. Eng. J., 2013, 215–216, 1–6 CrossRef CAS.
- Y. Huang, H. Li, M. S. Balogun, H. Yang, Y. Tong, X. Lu and H. Ji, RSC Adv., 2015, 5, 7729–7733 RSC.
- Z. Yan, Z. Xu, J. Yu and M. Jaroniec, Appl. Catal., B, 2016, 199, 458–465 CrossRef CAS.
- Z. Huang, X. Gu, Q. Cao, P. Hu, J. Hao, J. Li and X. Tang, Angew. Chem., Int. Ed., 2012, 51, 4198–4203 CrossRef CAS PubMed.
- X. Tang, Y. Li, X. Huang, Y. Xu, H. Zhu, J. Wang and W. Shen, Appl. Catal., B, 2006, 62, 265–273 CrossRef CAS.
- Y. Sekine, Atmos. Environ., 2002, 36, 5543–5547 CrossRef CAS.
- J. Wang, D. Li, P. Li, P. Zhang, Q. Xu and J. Yu, RSC Adv., 2015, 5, 100434–100442 RSC.
- J. Wang, J. Li, C. Jiang, P. Zhou, P. Zhang and J. Yu, Appl. Catal., B, 2017, 204, 147–155 CrossRef CAS.
- L. Nie, J. Yu, X. Li, C. Bei, G. Liu and M. Jaroniec, Environ. Sci. Technol., 2013, 47, 2777–2783 CrossRef CAS PubMed.
- C. Zhang, H. He and K. Tanaka, Catal. Commun., 2005, 6, 211–214 CrossRef CAS.
- B. Chen, X. Zhu, M. Crocker, Y. Wang and C. Shi, Catal. Commun., 2013, 42, 93–97 CrossRef CAS.
- B. Chen, C. Shi, M. Crocker, Y. Wang and A. Zhu, Appl. Catal., B, 2013, 132–133, 245–255 CrossRef CAS.
- H. Huang and D. Y. C. Leung, J. Catal., 2011, 280, 60–67 CrossRef CAS.
- L. Nie, A. Meng, J. Yu and M. Jaroniec, Sci. Rep., 2013, 3, 3215–3220 Search PubMed.
- L. Nie, A. Meng, F. Teng and B. Cheng, RSC Adv., 2015, 5, 83997–84003 RSC.
- L. Nie, J. Yu and J. Fu, ChemCatChem, 2014, 6, 1983–1989 CrossRef CAS.
- L. Nie, Y. Zheng and J. Yu, Dalton Trans., 2014, 43, 12935–12942 RSC.
- M. I. Mejia, J. M. Marin, G. Restrepo, C. Pulgarin, E. Mielczarski, J. Mielczarski, Y. Arroyo, J. Lavanchy and J. Kiwi, Appl. Catal., B, 2009, 91, 481–488 CrossRef CAS.
- R. Rahal, T. Pigot, D. Foix and S. Lacombe, Appl. Catal., B, 2011, 104, 361–372 CrossRef CAS.
- M. Yu, Z. Wang, H. Liu, S. Xie, J. Wu, H. Jiang, J. Zhang, L. Li and J. Li, ACS Appl. Mater. Interfaces, 2013, 5, 3697–3703 CAS.
- A. Bacciarelli-Ulacha, E. Rybicki, E. Matyjas-Zgondek, A. Pawlaczyk and M. I. Szynkowska, Ind. Eng. Chem. Res., 2014, 53, 4147–4155 CrossRef CAS.
- O. L. Galkina, A. Sycheva, A. Blagodatskiy, G. Kaptay, V. L. Katanaev, G. A. Seisenbaeva, V. G. Kessler and A. V. Agafonov, Surf. Coat. Technol., 2014, 253, 171–179 CrossRef CAS.
- O. Long, L. Zheng, B. Tan and H. Shu, Appl. Surf. Sci., 2016, 386, 434–441 CrossRef.
- M. Thommes, K. Kaneko, A. V. Neimark, J. P. Olivier, F. Rodriguez-Reinoso, J. Rouquerol and K. S. W. Sing, Pure Appl. Chem., 2015, 87, 1051–1069 CrossRef CAS.
- M. Calatayud, S. E. Collins, M. A. Baltanàs and A. L. Bonivardi, Phys. Chem. Chem. Phys., 2009, 11, 1397–1405 RSC.
- Y. He and H. Ji, Chin. J. Catal., 2010, 31, 171–175 CrossRef CAS.
- Q. Xu, W. Lei, X. Li, X. Qi, J. Yu, G. Liu, J. Wang and P. Zhang, Environ. Sci. Technol., 2014, 48, 9702–9708 CrossRef CAS PubMed.
- C. J. Lavalley, J. Lamotte, G. Busca and V. Lorenzelli, J. Chem. Soc., Chem. Commun., 1985, 1006–1007 RSC.
- C. Zhang, H. He and K. Tanaka, Appl. Catal., B, 2006, 65, 37–43 CrossRef CAS.
- C. Zhang, F. Liu, Y. Zhai, H. Ariga, N. Yi, Y. Liu, K. Asakura, M. Flytzani-Stephanopoulos and H. He, Angew. Chem., Int. Ed., 2012, 51, 9628–9632 CrossRef CAS PubMed.
- Z. Yan, Z. Xu, J. Yu and M. Jaroniec, Environ. Sci. Technol., 2015, 49, 6637–6644 CrossRef CAS PubMed.
- L. Qi, B. Cheng, J. Yu and W. Ho, J. Hazard. Mater., 2016, 301, 522–530 CrossRef CAS PubMed.
- B. Chen, X. Zhu, M. Crocker, Y. Wang and C. Shi, Appl. Catal., B, 2014, 154–155, 73–81 CrossRef CAS.
- X. Zhu, J. Yu, C. Jiang and B. Cheng, J. Ind. Eng. Chem., 2017, 45, 197–205 CrossRef CAS.
- J. Szlachetko, D. Ferri, V. Marchionni, A. Kambolis, O. V. Safonova, C. J. Milne, O. Kröcher, M. Nachtegaal and J. Sá, J. Am. Chem. Soc., 2013, 135, 19071–19074 CrossRef CAS PubMed.
Footnote |
| † Electronic supplementary information (ESI) available. See DOI: 10.1039/c7ra01616f |
|
| This journal is © The Royal Society of Chemistry 2017 |
Click here to see how this site uses Cookies. View our privacy policy here. 
 Open Access Article
 This Open Access Article is licensed under a
  *a,
Jie Wanga and
Jiaguo Yu
*a,
Jie Wanga and
Jiaguo Yu