 Open Access Article
Highly efficient photocatalytic degradation of methylene blue by P2ABSA-modified TiO2 nanocomposite due to the photosensitization synergetic effect of TiO2 and P2ABSA
Chuanxi Yangab,
Wenping Dongc,
Guanwei Cuid,
Yingqiang Zhaod,
Xifeng Shid,
Xinyuan Xiad,
Bo Tang *d and
Weiliang Wang
 *ae
*ae
aCollege of Geography and Environment, Shandong Normal University, Jinan 250014, P. R. China. E-mail: sdqcsdnu@163.com; Fax: +86 531-8618-0017; Fax: +86 531-8618-2550
bCollege of Resources and Environmental Sciences, China Agricultural University, Beijing 100193, P. R. China
cShandong Academy of Environmental Science and Environmental Engineering Co, Ltd, Jinan 250013, P. R. China
dCollege of Chemistry, Chemical Engineering and Materials Science, Collaborative Innovation Center of Functionalized Probes for Chemical Imaging in Universities of Shandong, Key Laboratory of Molecular and Nano Probes, Ministry of Education, Shandong Provincial Key Laboratory of Clean Production of Fine Chemicals, Shandong Normal University, Jinan 250014, P. R. China. E-mail: tangb@sdnu.edu.cn
eInstitute of Environment and Ecology, Shandong Normal University, Jinan 250014, P. R. China
First published on 3rd May 2017
Abstract
To enhance the photocatalytic activity of TiO2, poly-2-aminobenzene sulfonic acid (P2ABSA)-modified TiO2 nanocomposites were successfully synthesized using an in situ oxidative polymerization method. The modified nanocomposites were characterized by scanning electron microscopy, X-ray diffraction, transmission electron microscopy, X-ray photoelectron spectroscopy, UV-vis diffuse reflectance spectroscopy, and a photocurrent test. The photocatalytic degradation of methylene blue was chosen as a model reaction to evaluate the photocatalytic activities of TiO2 and P2ABSA/TiO2 nanocomposites, with results indicating that P2ABSA/TiO2 exhibited the higher activity. The apparent first-order rate constant, kapp, of P/T(2/1) was 0.0138 min−1, which was six times higher than that of TiO2 (0.0021 min−1). Meanwhile, the P2ABSA/TiO2 nanocomposites showed excellent photocatalytic stability, which was dependent on structural stability. A photocatalytic activity enhanced mechanism has been proposed, accounting for the photosensitization effect and synergetic effect of TiO2 with P2ABSA. Mass spectroscopy analysis showed that there were two possible degradation pathways for MB, via degradation of the chromophoric group or the auxochrome group.
1. Introduction
Semiconductor TiO2 is an excellent photocatalyst owing to its good photocatalytic activity and stability.1,2 However, the wide band gap (3.2 eV) of TiO2 limits its visible light utilization, while its low quantum efficiency (<20%) restricts electron–hole separation, which generates reactive oxygen species (ROS) to degrade organic pollutants.3,4 Many approaches, such as metal/nonmetal doping, noble metal deposition, and dye sensitization, have been attempted to enhance the photocatalytic performance of TiO2 by improving its photoresponse and quantum efficiency.5–7Recently, conducting polymers, such as polyaniline (PANI), polythiophene (PTh), poly-o-phenylenediamine (PoPD), and their derivatives, have been reported as promising modifiers for TiO2 photocatalysts.8 The modification of TiO2 with conducting polymers has been explored to extend its visible light response owing to the photosensitization effect between TiO2 and the conducting polymer.9 For example, Pandi Muthirulan et al. reported that PoPD/TiO2 nanocomposites showed high photocatalytic activity in the photodegradation of rhodamine B owing to the photosensitization effect.10 This modification also enhanced the photocatalytic activity owing to the synergetic effect between TiO2 and the conducting polymer. Zhang et al. reported that PANI/TiO2 nanocomposites exhibited excellent photocatalytic performance in the degradations of methylene blue and rhodamine B owing to the synergetic effect between TiO2 and PANI.11
In addition to PANI and PoPD, poly-2-aminobenzene sulfonic acid (P2ABSA) has also been applied to conducting polymer-modified TiO2 to improve its photocatalytic performance.12 As a typical conducting polymer, P2ABSA has attracted considerable attention since its discovery. Taking advantage of its unique electrical, optical, and photoelectric properties, the combination of P2ABSA with TiO2 was expected to induce an interesting charge transfer to enhance the photocatalytic activity of TiO2 under visible light irradiation.13 However, this photocatalytic activity enhanced mechanism has not been studied.14 The photocatalytic process of P2ABSA/TiO2 involves a primary reaction that generates holes and electrons, and a secondary reaction that generates ROS.15 Therefore, successfully establishing a quantitative estimate of the contributions of P2ABSA in these primary and secondary reactions is important.
About 15% of total global dye production is lost during the dyeing process and released in textile effluents.16 The release of those colored waste waters into the ecosystem is a substantial source of non-aesthetic pollution, eutrophication, and perturbation in aquatic life.17 The photocatalytic degradation of methylene blue (MB), a typical conjugated aromatic dye, was chosen as a model reaction to evaluate photocatalyst activities due to the obvious change to blue during photocatalytic degradation.18 Meanwhile, identifying the intermediate products and degradation pathways of MB is also an important part of the photocatalytic activity test and photocatalytic mechanism. The main dispute regarding MB degradation is between degradation of the central aromatic ring, as reported by Ammar Houas, and degradation of the methyl substituent on the ambilateral benzene ring, as reported by Muhammad A. Rauf.19,20 However, many different degradation pathways for MB have also been reported by Zhou Lincheng,21 Ma Junjun,23 and Castro.22 Therefore, it is important to identify the intermediate products and propose possible MB degradation pathways during the photocatalytic reaction process.
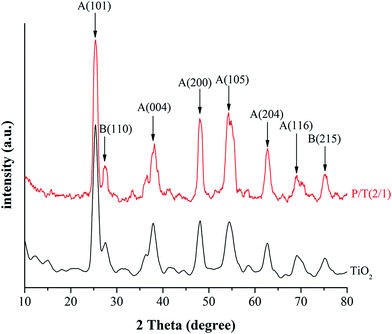
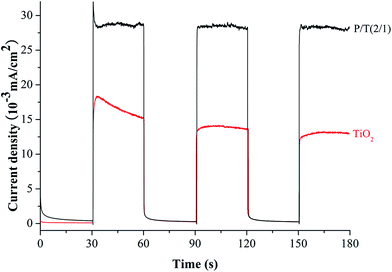
In our studies, P2ABSA/TiO2 nanocomposites were synthesized using an in situ oxidative polymerization method. The modified photocatalysts were characterized by scanning electron microscopy (SEM), X-ray diffraction (XRD), transmission electron microscopy (TEM), X-ray photoelectron spectroscopy (XPS), ultraviolet-visible diffuse reflectance spectroscopy (UV-vis DRS), and a photocurrent test. The results indicated that P2ABSA was present on the TiO2 surface, and did not impact the lattice structure and grain size of TiO2. The presence of P2ABSA enhanced the visible light response and photoelectric performance. The photocatalytic degradation of MB was chosen as a model reaction to evaluate the photocatalytic activities of TiO2 and P2ABSA/TiO2 nanocomposites. The results indicated that the P2ABSA/TiO2 nanocomposites exhibited higher activities. The apparent first-order rate constant, kapp, for a P2ABSA/TiO2 ratio of 2![[thin space (1/6-em)]](https://www.rsc.org/images/entities/char_2009.gif) :
:![[thin space (1/6-em)]](https://www.rsc.org/images/entities/char_2009.gif) 1 was 0.0138 min−1, which was six times higher than that of TiO2 (0.0021 min−1). Meanwhile, the P2ABSA/TiO2 nanocomposites showed excellent photocatalytic stability, which was dependent on the structural stability. A photocatalytic activity enhanced mechanism has been proposed, accounting for the photosensitization effect and synergetic effect of TiO2 with P2ABSA. Mass spectroscopy (MS) analysis showed that there were two possible degradation pathways for MB, via degradation of the chromophoric group or degradation of the auxochrome group.
1 was 0.0138 min−1, which was six times higher than that of TiO2 (0.0021 min−1). Meanwhile, the P2ABSA/TiO2 nanocomposites showed excellent photocatalytic stability, which was dependent on the structural stability. A photocatalytic activity enhanced mechanism has been proposed, accounting for the photosensitization effect and synergetic effect of TiO2 with P2ABSA. Mass spectroscopy (MS) analysis showed that there were two possible degradation pathways for MB, via degradation of the chromophoric group or degradation of the auxochrome group.
2. Experimental
2.1 Reagents and materials
P25 TiO2 with a specific surface area of 57.369 m2 g−1 was purchased from Degussa. 2-Aminobenzene sulfonic acid (2ABSA) was purchased from Beijing J&K Scientific Ltd. Ammonium persulfate (APS) was purchased from Tianjin Kermel Chemical Reagent Co., Ltd. Ethanol was purchased from Tianjin Fuyu Fine Chemical Co., Ltd. Hydrochloric acid was purchased from Sinopharm Chemical Reagent Co., Ltd. Methylene blue (MB) was purchased from Tianjin Guangcheng Chemical Reagent Co., Ltd. All chemicals were of analytical grade and used without further purification. Deionized water was used to prepare all solutions.2.2 Preparation of P2ABSA/TiO2 nanocomposites
A typical synthesis of P2ABSA/TiO2 nanocomposites is described below.24An appropriate amount of 2ABSA was dissolved in hydrochloric acid solution (90 mL, 1.2 mol L−1) followed by the addition of TiO2 (0.512 g). The solution was ultrasonicated for 15 min to ensure uniform mixing. After dissolution, the solution was labeled as A. An appropriate amount of APS was dissolved in hydrochloric acid solution (30 mL, 1.2 mol L−1), and this solution was labeled as B. Solution A was transferred to a 250 mL round-bottom flask and the solution was stirred using a magnetic stirrer. Solution B was transferred to a 100 mL constant-pressure funnel, and then solution A was added dropwise at approximately 1 drop/s with stirring. The reaction was continued for 24 h at 25 °C. The final products were filtered, washed with deionized water and ethanol, and dried at 80 °C for several hours in a vacuum oven. In the experiment, different initial [2ABSA]/[TiO2] molar ratios (from 1![[thin space (1/6-em)]](https://www.rsc.org/images/entities/char_2009.gif) :
:![[thin space (1/6-em)]](https://www.rsc.org/images/entities/char_2009.gif) 6 to 4
6 to 4![[thin space (1/6-em)]](https://www.rsc.org/images/entities/char_2009.gif) :
:![[thin space (1/6-em)]](https://www.rsc.org/images/entities/char_2009.gif) 1) were employed to obtain TiO2 nanocomposites deposited by P2ABSA with an initial [APS]/[2ABSA] molar ratio of 1/1 and HCl concentration of 1.2 mol L−1. These nanocomposites are referred to as P/T(1/6), P/T(1/5), P/T(1/4), P/T(1/2), P/T(1/1), P/T(2/1) P/T(3/1), and P/T(4/1), respectively. To confirm the effect of P2ABAS on the nanocomposites, the P25 TiO2 nanocomposites were treated using the same procedure without the addition of 2ABSA.
1) were employed to obtain TiO2 nanocomposites deposited by P2ABSA with an initial [APS]/[2ABSA] molar ratio of 1/1 and HCl concentration of 1.2 mol L−1. These nanocomposites are referred to as P/T(1/6), P/T(1/5), P/T(1/4), P/T(1/2), P/T(1/1), P/T(2/1) P/T(3/1), and P/T(4/1), respectively. To confirm the effect of P2ABAS on the nanocomposites, the P25 TiO2 nanocomposites were treated using the same procedure without the addition of 2ABSA.
P2ABSA was also prepared via in situ oxidative polymerization using the same procedure as above, but without TiO2 addition.
2.3 Characterization
SEM images were obtained on a JSM-6700F cold field emission scanning electron microscope and used to determine the morphology and aggregation of the photocatalyst.XRD patterns were recorded on a Bruker D8 Advance X-ray diffractometer with Cu Kα radiation (λ = 1.5418 Å).
TEM images were obtained on a JEM-2100 transmission electron microscopy operating at 125 kV and used to determine the grain sizes of TiO2 and P2ABSA/TiO2.
XPS measurements were performed using a Thermo ESCALAB 250Xi system with an Al Kα X-ray source. All binding energies were referenced to the C1s peak at 284.8 eV, which corresponds to surface adventitious carbon.
UV-vis DRS was performed on a UV-2550PC ultraviolet and visible spectrophotometer with BaSO4 as the background, ranging from 200 to 800 nm.
The photocurrent test was performed on a CHI660D VersaSTAT. TiO2 and P2ABSA/TiO2 nanocomposites were deposited as a film on a 1 cm × 1 cm indium-tin-oxide conducting glass to obtain the working electrode. The saturated calomel electrode and a Pt electrode served as the reference and counter electrodes, respectively. The electrolyte was 0.1 mol L−1 NaClO4 solution.
2.4 Photocatalytic activity test
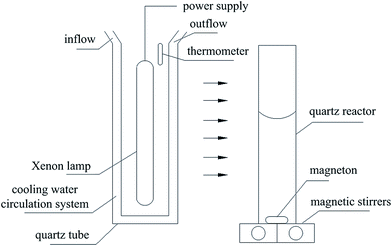
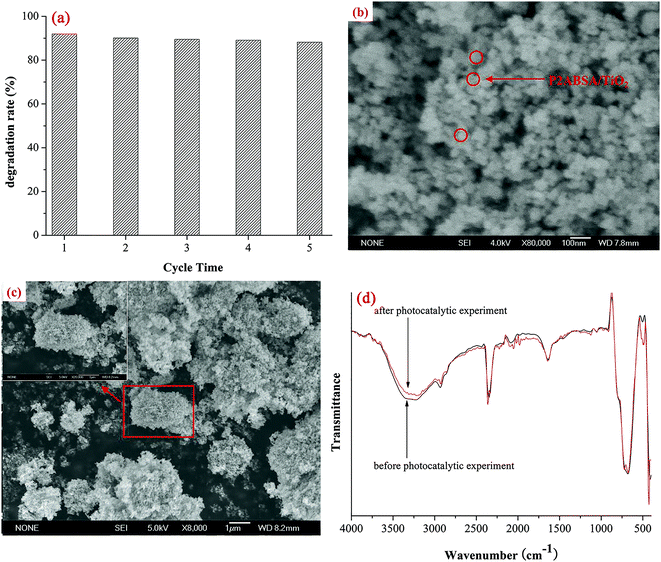
Photocatalytic activities of samples were evaluated based on MB degradation in an aqueous solution under irradiation from a 1000 W xenon lamp (BL-GHX-V photochemical reactions instrument, Fig. 1). Aqueous suspensions of MB (30 mL, 40 mg L−1) were placed in a quartz tube, and TiO2 or P2ABSA/TiO2 nanocomposites (30 mg) were added. Prior to irradiation, the suspensions were magnetically stirred in the dark for 1 h. The suspensions were maintained under constant air-equilibrated conditions before and during illumination. At certain time intervals, 1 mL aliquots were removed and centrifuged to remove any particles. The filtrates were then analyzed by recording variations in the maximum absorption band (664 nm for MB) using the UV-2550PC UV-vis spectrophotometer. This process was repeated five times to investigate the stability of the nanocomposites.3. Results and discussion
3.1 Physicochemical properties of TiO2 and P2ABSA/TiO2 nanocomposites
3.2 Photocatalytic activity and stability
![[thin space (1/6-em)]](https://www.rsc.org/images/entities/char_2009.gif) :
:![[thin space (1/6-em)]](https://www.rsc.org/images/entities/char_2009.gif) 6 to 4
6 to 4![[thin space (1/6-em)]](https://www.rsc.org/images/entities/char_2009.gif) :
:![[thin space (1/6-em)]](https://www.rsc.org/images/entities/char_2009.gif) 1.
1.
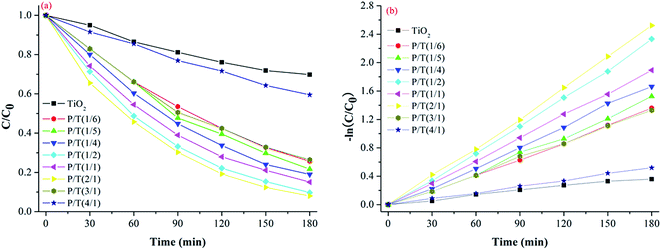 | ||
| Fig. 7 (a) Photocatalytic degradation and (b) apparent first-order linear transforms, −ln(C/C0), of MB in the presence of TiO2 and P/T(2/1) nanocomposites. | ||
| Photocatalysts | −ln(C/C0) = kappt | kapp (min−1) | R2 |
|---|---|---|---|
| TiO2 | −ln(C/C0) = 0.0021t | 0.0021 | 0.9851 |
| P/T(1/6) | −ln(C/C0) = 0.0073t | 0.0073 | 0.9963 |
| P/T(1/5) | −ln(C/C0) = 0.0081t | 0.0081 | 0.9917 |
| P/T(1/4) | −ln(C/C0) = 0.0092t | 0.0092 | 0.9964 |
| P/T(1/2) | −ln(C/C0) = 0.0126t | 0.0126 | 0.9980 |
| P/T(1/1) | −ln(C/C0) = 0.0105t | 0.0105 | 0.9995 |
| P/T(2/1) | −ln(C/C0) = 0.0138t | 0.0138 | 0.9987 |
| P/T(3/1) | −ln(C/C0) = 0.0073t | 0.0073 | 0.9979 |
| P/T(4/1) | −ln(C/C0) = 0.0029t | 0.0029 | 0.9976 |
The initial [2ABSA]/[TiO2] molar ratios clearly had a significant influence on the activity of P2ABSA/TiO2 nanocomposites in the degradation of MB, and the optimal initial [2ABSA]/[TiO2] molar ratio was 2![[thin space (1/6-em)]](https://www.rsc.org/images/entities/char_2009.gif) :
:![[thin space (1/6-em)]](https://www.rsc.org/images/entities/char_2009.gif) 1. The photocatalytic activity of P2ABSA/TiO2 nanocomposites with different initial [2ABSA]/[TiO2] molar ratios was influenced by the thickness of P2ABSA on the TiO2 surface.33 When the molar ratio of 2ABSA to TiO2 was low, increasing the molar ratio increased the thickness of deposited P2ABSA on the TiO2 surface, such that the produced electron–hole pairs accumulated under irradiation, enhancing the photocatalytic performance. However, as the molar ratio of 2ABSA to TiO2 continued increasing, the thickness of deposited P2ABSA on the TiO2 surface became too thick to influence the transmission of the produced electrons, resulting in the photocatalytic performance of P2ABSA/TiO2 nanocomposites decreasing.
1. The photocatalytic activity of P2ABSA/TiO2 nanocomposites with different initial [2ABSA]/[TiO2] molar ratios was influenced by the thickness of P2ABSA on the TiO2 surface.33 When the molar ratio of 2ABSA to TiO2 was low, increasing the molar ratio increased the thickness of deposited P2ABSA on the TiO2 surface, such that the produced electron–hole pairs accumulated under irradiation, enhancing the photocatalytic performance. However, as the molar ratio of 2ABSA to TiO2 continued increasing, the thickness of deposited P2ABSA on the TiO2 surface became too thick to influence the transmission of the produced electrons, resulting in the photocatalytic performance of P2ABSA/TiO2 nanocomposites decreasing.
3.3 Photocatalytic activity enhanced mechanism
Although the photocatalytic activity of the photocatalyst was influenced by many factors, two key factors were identified from the photocatalytic mechanism. In the primary reaction process, TiO2 is excited under light irradiation to generate electron–hole pairs. In the secondary reaction process, ROS are produced to degrade the organic pollutant. Therefore, the two key factors in the photocatalytic activity were solar absorption and charge separation.For P2ABSA/TiO2, as P2ABSA is a photosensitizer, based on its narrow band gap, P2ABSA-modified TiO2 inserts the energy level of P2ABSA into the energy level of TiO2, enhancing its response to visible light. However, the synergetic effect resulting from the good match between the energy levels of TiO2 and P2ABSA causes P2ABSA/TiO2 to hinder the recombination of holes and electrons to generate more ROS to degrade MB. Therefore, the mechanism for enhanced photocatalytic activity is based on photosensitization and synergetic effects.
| F(R)E = A(E − Eg)n/2 | (1) |
| (F(R)E)1/2 = A(E − Eg) | (2) |
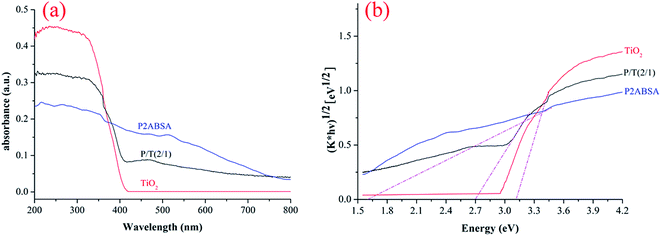
In eqn (2), (F(R)E)1/2 has a linear relationship with E. The n value for the samples was determined to be 4, indicating that the optical transitions of the crystal were indirectly forbidden.35,36 Fig. 5b shows the optical band gaps (Eg) of TiO2, P2ABSA, and P2ABSA/TiO2. The band gap energies for TiO2, P2ABSA, and P2ABSA/TiO2 were determined to be 3.11, 1.61, and 2.70 eV, respectively, indicating that P2ABSA-modified TiO2 was a better photocatalyst than unmodified TiO2 owing to P2ABSA acting as a photosensitizer.
The π–π* absorption of P2ABSA is low because the benzene rings are conjugated through an imine linkage and the sulfonyl group is electron-withdrawing. The experimental absorption spectrum for P2ABSA indicated a band gap of 1.61 eV, which was interpreted as excitation to the polaron band. P2ABSA is an efficient electron donor and hole transporter upon light excitation. In the P2ABSA and TiO2 combined system, the response to light ranged from 398 nm (UV) to 459 nm (visible light). Therefore, because of the photosensitization effect of P2ABSA, the P2ABSA/TiO2 nanocomposites exhibited stronger responses to visible light, and the photocatalytic activity of P2ABSA-modified TiO2 was enhanced by the improved response to visible light.
The synergetic factor (f) was then calculated using the apparent first-order kinetic expression:39
 | (3) |
 | (4) |
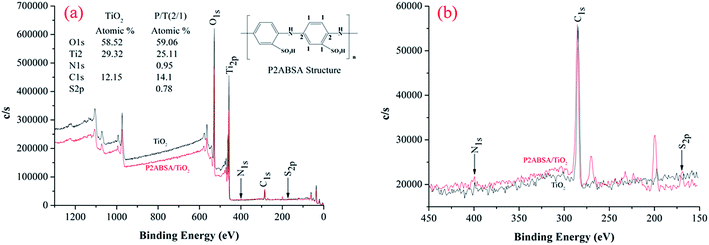
Based on the mass of TiO2 being much greater than that of P2ABSA (XPS results in Fig. 4a and b), and P2ABSA being used as a modifier with no obvious photocatalytic activity (kC ≈ 0), f was calculated as follows:
 | (5) |
Based on the apparent first-order kinetic constants for MB degradation in Table 1, the synergetic factors of the P2ABSA/TiO2 nanocomposites were 3.48 for P/T(1/6), 3.86 for P/T(1/5), 4.38 for P/T(1/4), 6 for P/T(1/2), 5 for P/T(1/1), 6.57 for P/T(2/1), 3.48 for P/T(3/1), and 1.38 for P/T(4/1). Therefore, the photocatalytic activities of P2ABSA-modified TiO2 were enhanced by increased ROS generation.
3.4 Intermediate products and degradation pathways of MB
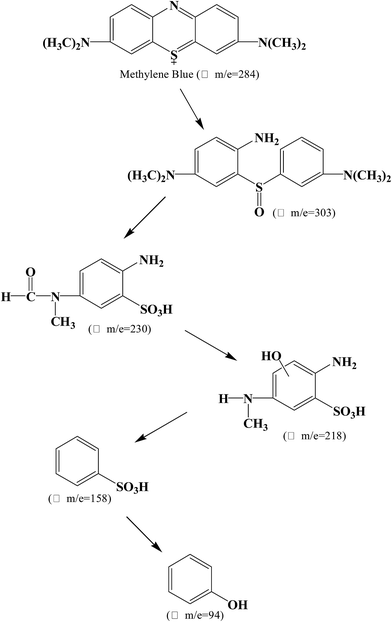
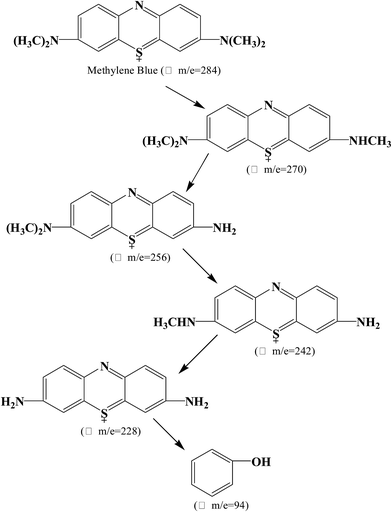
Using UHR-TOF-MS (Bruker Daltonic Inc., USA), the intermediate products of MB degradation were identified. MB exhibits one main band in the visible region with a maximum absorption at 664 nm and a small shoulder at 610 nm owing to the dye dimer. Furthermore, two bands were present in the ultraviolet region at 246 nm and 292 nm. The color of MB is dependent on its chromophoric (N–S conjugated system on central aromatic heterocycle) and auxochrome groups (N-containing groups with lone pair electrons on benzene ring).40 During the photocatalytic process, the removal of MB includes not only adsorption, but also degradation using the P2ABSA-modified TiO2 nanocomposites. Based on the coloring mechanism, decolorizing mechanism, and the intermediate products, we proposed two possible photocatalytic degradation pathways for MB.![[double bond, length as m-dash]](https://www.rsc.org/images/entities/char_e001.gif) C) is converted to a sulfoxide (C–S(
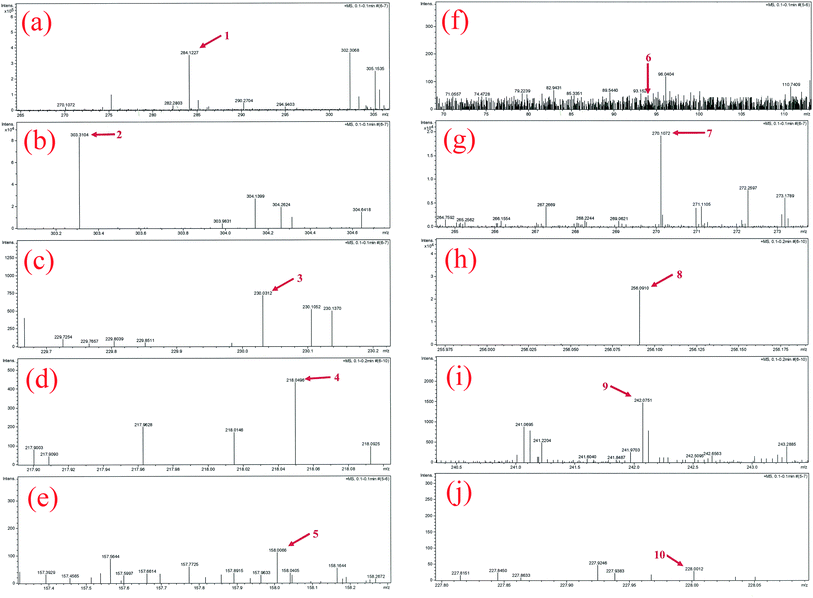
C) is converted to a sulfoxide (C–S(![[double bond, length as m-dash]](https://www.rsc.org/images/entities/char_e001.gif) O)–C), and the central aromatic heterocycle opens. Electrophilic attack by ˙OH at the free doublet of the S heteroatom changes its oxidation from −2 to 0. However, the conversion from C–S+˙C to C–S(˙O)–C requires conservation of the double bond conjugation, which induces opening of the central aromatic ring containing both heteroatoms (S and N). The H atoms necessary for C–H and N–H bond formation may originate from proton reduction caused by photogenerated electrons. The intermediate products of MB degradation included 2-amino-5-(N-methyl formamide)benzene sulfonic acid (m/z = 230), 2-amino-5-(methyl amino)-hydroxybenzene sulfonic acid (m/z = 218), benzenesulfonic acid (m/z = 158), and phenol (m/z = 94). Degradation of the chromophoric group is shown in Fig. 9.
O)–C), and the central aromatic heterocycle opens. Electrophilic attack by ˙OH at the free doublet of the S heteroatom changes its oxidation from −2 to 0. However, the conversion from C–S+˙C to C–S(˙O)–C requires conservation of the double bond conjugation, which induces opening of the central aromatic ring containing both heteroatoms (S and N). The H atoms necessary for C–H and N–H bond formation may originate from proton reduction caused by photogenerated electrons. The intermediate products of MB degradation included 2-amino-5-(N-methyl formamide)benzene sulfonic acid (m/z = 230), 2-amino-5-(methyl amino)-hydroxybenzene sulfonic acid (m/z = 218), benzenesulfonic acid (m/z = 158), and phenol (m/z = 94). Degradation of the chromophoric group is shown in Fig. 9.
All the intermediate products formed during MB photocatalytic degradation were identified from mass spectra, as shown in Fig. 11.
3.5 Photocatalytic mechanism of P2ABSA/TiO2 nanocomposites
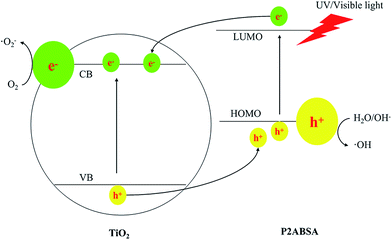
The basic mechanism of P2ABSA/TiO2 nanocomposites was well established. TiO2 nanocomposites are irradiated with UV light to generate electron–hole pairs, which can react with water to yield hydroxyl and superoxide radicals, which oxidize and mineralize the organic molecules. However, the band gap of TiO2 is 3.11 eV, meaning that only UV light can excite the TiO2 nanocomposites to generate electron–hole pairs. One solution to overcome this shortcoming was to use a dye with a narrow band gap as a sensitizer to enhance the response of TiO2 to visible light. P2ABSA has a band gap of 1.61 eV, which is narrower than that of TiO2 (3.2 eV), showing strong absorption in the region of visible light. Therefore, P2ABSA can function as a photosensitizer for TiO2.When P2ABSA/TiO2 nanocomposites are illuminated under visible light, both TiO2 and P2ABSA absorb photons at their interface, where charge separation then occurs. This happens because the CB of TiO2 and the LUMO of P2ABSA are well matched for charge transfer. Electrons generated by conducting P2ABSA can be transferred to the conduction band of TiO2, enhancing charge separation and promoting the photocatalytic ability of the photocatalyst.
The synergetic effect between P2ABSA and TiO2 on the photocatalytic degradation of MB clearly existed in all the P2ABSA/TiO2 nanocomposites. An optimum synergetic effect was found in P/T(2/1). The effect of P2ABSA on the activity of the nanocomposites can be explained by its action as photosensitizer (Scheme 1). Doped P2ABSA semiconductive material can absorb visible light irradiation and transfer photogenerated electrons into the CB of TiO2. Simultaneously, a positively charged hole can be formed by the electron, transferring from the VB of TiO2 to the HOMO of P2ABSA. This electron transfer between P2ABSA and the TiO2 semiconductor, and the enhanced photocatalytic activity of the composites, have been experimentally observed in other systems.41,42 The free electrons reacted with O2 to produce superoxide radicals (˙O2−), and the holes (h+) reacted with OH− and H2O to produce hydroxyl radicals (˙OH), which are responsible for MB degradation.43
The photocatalytic mechanism of P2ABSA/TiO2 nanocomposites can be expressed as follows:
| P2ABSA/TiO2 + hv → P2ABSA+/TiO2 + e− | (6) |
| e− + O2 → ˙O2− | (7) |
| P2ABSA+/TiO2 → P2ABSA/TiO2 + h+ | (8) |
| h+ + H2O/OH− → ˙OH | (9) |
| MB + ROS → CO2 + H2O | (10) |
4. Conclusions
In this study, P2ABSA/TiO2 nanocomposites were synthesized using an in situ oxidative polymerization method. The modified photocatalysts were characterized by SEM, XRD, TEM, XPS, UV-vis DRS, and a photocurrent test. The results indicated that P2ABSA was present on the TiO2 surface and did not impact the lattice structure and grain size of TiO2. The presence of P2ABSA enhanced the visible light response and photoelectric performance. The photocatalytic degradation of MB was chosen as a model reaction to evaluate the photocatalytic activities of TiO2 and P2ABSA/TiO2 nanocomposites, with results indicating that P2ABSA/TiO2 nanocomposites exhibited the higher activity. The apparent first-order rate constant, kapp, of P/T(2/1) was 0.0138 min−1, which was six times higher than that of TiO2 (0.0021 min−1). Meanwhile, the P2ABSA/TiO2 nanocomposites showed excellent photocatalytic stability, which was dependent on the structural stability. A photocatalytic activity enhanced mechanism has been proposed, accounting for the photosensitization effect and synergetic effect of TiO2 with P2ABSA. Based on the analysis of mass spectra, two possible degradation pathways for MB degradation were identified, via the chromophoric group or the auxochrome group. Our results provide valuable insight into the design of polymer-modified semiconductors with excellent performance and provide a foundation for future industrial applications.Acknowledgements
This work was supported by the 973 Program (2013CB 933800), the National Natural Science Foundation of China (41672340, 21507074, 21405096, 21301110), and Shandong Provincial Natural Science Foundation, China (BS2014NJ008).References
- A. Fujishima and K. Honda, Nature, 1972, 238, 37–38 CrossRef CAS PubMed.
- K. Nakata and A. Fujishima, J. Photochem. Photobiol., C, 2012, 13, 169–189 CrossRef CAS.
- M. Pelaez, N. T. Nolan, S. C. Pillai, M. K. Seery, P. Falaras, A. G. Kontos, P. S. M. Dunlop, J. W. J. Hamilton, J. A. Byrne, K. O'Shea, M. H. Entezari and D. D. Dionysiou, Appl. Catal., B, 2012, 125, 331–349 CrossRef CAS.
- W. Zhang, B. P. Jia, Q. Z. Wang and D. Dionysiou, J. Nanopart. Res., 2015, 17, 1–12 CrossRef CAS.
- X. F. Shi, N. Li, K. Zhao, G. W. Cui, Y. Q. Zhao, M. Y. Ma, K. H. Xu, P. Li, Y. B. Dong and B. Tang, Appl. Catal., B, 2013, 136, 334–340 CrossRef.
- D. H. Kuo, W. T. Hsu and Y. Y. Yang, Appl. Catal., B, 2016, 184, 191–200 CrossRef CAS.
- H. Park, Y. Park, W. Kim and W. Choi, J. Photochem. Photobiol., C, 2013, 15, 1–20 CrossRef CAS.
- K. R. Reddy, M. Hassan and V. G. Gomes, Appl. Catal., A, 2015, 489, 1–16 CrossRef CAS.
- S. Seema, M. Hari and K. S. Pramod, Appl. Catal., A, 2013, 462–463, 178–195 Search PubMed.
- P. Muthirulan, C. K. N. Devi and M. M. Sundaram, J. Environ. Chem. Eng., 2013, 1, 620–627 CrossRef CAS.
- H. Zhang, R. L. Zong, J. C. Zhao and Y. F. Zhu, Environ. Sci. Technol., 2008, 42, 3803–3807 CrossRef CAS PubMed.
- Z. Y. Zhu, F. L. Wang, F. M. Wang and L. L. Xi, J. Electroanal. Chem., 2013, 708, 13–19 CrossRef CAS.
- Y. W. Hu, T. Yang, X. X. Wang and K. Jiao, Chem.–Eur. J., 2010, 16, 1992–1999 CrossRef CAS PubMed.
- Y. B. Liu, G. Q. Zhu, J. Z. Gao, R. L. Zhu, M. Hojamberdiev, C. H. Wang, X. M. Wei and P. Liu, Appl. Catal., B, 2017, 205, 421–432 CrossRef CAS.
- X. F. Shi, X. Y. Xia, G. W. Cui, N. Deng, Y. Q. Zhao, L. H. Zhuo and B. Tang, Appl. Catal., B, 2015, 163, 123–128 CrossRef CAS.
- H. Lachheb, E. Puzenat, A. Houas, M. Ksibi, E. Elaloui, C. Guillard and J. M. Herrmann, Appl. Catal., B, 2002, 39, 75–90 CrossRef CAS.
- J. F. Luan, X. P. Hao, S. R. Zheng, G. Y. Luan and X. S. Wu, J. Mater. Sci., 2006, 41, 8001–8012 CrossRef CAS.
- Y. H. Zhang, Z. R. Tang, X. Z. Fu and Y. J. Xu, ACS Nano, 2010, 4, 7303–7314 CrossRef CAS PubMed.
- A. Houas, H. Lachheb, M. Ksibi, E. Elaloui, C. Guillard and J. M. Herrmann, Appl. Catal., B, 2001, 31, 145–157 CrossRef CAS.
- M. A. Rauf, M. A. Meetani, A. Khaleel and A. Ahmed, Chem. Eng. J., 2010, 157, 373–378 CrossRef CAS.
- L. C. Zhou, J. J. Ma, H. Zhang, Y. M. Shao and Y. F. Li, Appl. Surf. Sci., 2015, 324, 490–498 CrossRef CAS.
- C. S. Castro, M. C. Guerreiro, L. C. A. Oliveira, M. Goncalves, A. S. Anastacio and M. Nazzarro, Appl. Catal., A, 2009, 367, 53–58 CrossRef CAS.
- J. J. Ma, L. C. Zhou, W. F. Dan, H. Zhang, Y. M. Shao, C. Bao and L. Y. Jing, J. Colloid Interface Sci., 2015, 446, 298–306 CrossRef CAS PubMed.
- M. Radoičić, Z. Šaponjić, I. A. Janković, G. Ćirić-Marjanović, S. P. Ahrenkiel and M. I. Čomor, Appl. Catal., B, 2013, 136, 133–139 CrossRef.
- X. Y. Li, D. S. Wang, G. X. Cheng, Q. Z. Luo, J. An and Y. Wang, Appl. Catal., B, 2008, 81, 267–273 CrossRef CAS.
- Y. M. Lin, D. Z. Li, J. H. Hu, G. C. Xiao, J. X. Wang, W. J. Li and X. Z. Fu, J. Phys. Chem. C, 2012, 116, 5764–5772 CAS.
- Z. Zhao, X. Y. Zhang, G. Q. Zhang, Z. Y. Liu, D. Qu, X. Miao, P. Y. Feng and Z. C. Sun, Nano Res., 2015, 8, 4061–4071 CrossRef CAS.
- D. S. Wang, J. Zhang, Q. Z. Luo, X. Y. Li, Y. D. Duan and J. An, J. Hazard. Mater., 2009, 169, 546–550 CrossRef CAS PubMed.
- D. S. Wang, Y. H. Wang, X. Y. Li, Q. Z. Luo, J. An and J. X. Yue, Catal. Commun., 2008, 9, 1162–1166 CrossRef CAS.
- G. Z. Liao, S. Chen, X. Quan, Y. B. Zhang and H. M. Zhao, Appl. Catal., B, 2011, 102, 126–131 CrossRef CAS.
- G. Z. Liao, S. Chen, X. Quan, H. Chen and Y. B. Zhang, Environ. Sci. Technol., 2010, 44, 3481–3485 CrossRef CAS PubMed.
- Y. F. Zhu and Y. Dan, Sol. Energy Mater. Sol. Cells, 2010, 94, 1658–1664 CrossRef CAS.
- C. X. Yang, M. Zhang, W. P. Dong, G. W. Cui, Z. M. Ren and W. L. Wang, PLoS One, 2017, 12, e0174104 Search PubMed.
- W. J. Li, D. Z. Li, Z. X. Chen, H. J. Huang, M. Sun, Y. H. He and X. Z. Fu, J. Phys. Chem. C, 2008, 112, 14943–14947 CAS.
- S. Debnath, N. Ballav, H. Nyoni, A. Maity and K. Pillay, Appl. Catal., B, 2015, 163, 330–342 CrossRef CAS.
- S. Razak, M. A. Nawi and K. Haitham, Appl. Surf. Sci., 2014, 319, 90–98 CrossRef CAS.
- M. A. Salem, A. F. Al-Ghonemiy and A. B. Zaki, Appl. Catal., B, 2009, 91, 59–66 CrossRef CAS.
- P. Zhou, J. G. Yu and M. Jaroniec, Adv. Mater., 2014, 26, 4920–4935 CrossRef CAS PubMed.
- A. P. Jia, G. S. Hu, L. Meng, Y. L. Xie, J. Q. Lu and M. F. Luo, J. Catal., 2012, 289, 199–209 CrossRef CAS.
- M. A. Sanromán, M. Pazos, M. T. Ricart and C. Cameselle, Chemosphere, 2004, 57, 233–239 CrossRef PubMed.
- H. C. Liang and X. Z. Li, Appl. Catal., B, 2009, 86, 8–17 CrossRef CAS.
- W. Li, Y. Tian, C. H. Zhao, Q. Y. Zhang and W. C. Geng, Chem. Eng. J., 2016, 303, 282–291 CrossRef CAS.
- X. Ma and X. Y. Ni, J. Mater. Sci.: Mater. Electron., 2015, 26, 1129–1135 CrossRef CAS.
| This journal is © The Royal Society of Chemistry 2017 |

