 Open Access Article
Creative Commons Attribution 3.0 Unported Licence
Corrosion inhibition of C-steel in acidic media from fruiting bodies of Melia azedarach L extract and a synergistic Ni2+ additive
A. I. Ali *a and
Y. Sh. Mahrousb
aChemistry Department, Faculty of Science, Benha University, Benha 13512, Egypt. E-mail: drasmaa.ali10@yahoo.com; asmaa.ali@fsci.bu.edu.eg
bCentral Metallurgical Research and Development Institute (CMRDI), Tebbin, PO Box 87, Helwan, Cairo 11421, Egypt. E-mail: mrous11@yahoo.com
First published on 3rd May 2017
Abstract
The inhibiting ability of the fruiting bodies of Melia azedarach Linn extract (FB-MAL) and its synergistic effect with nickel ions (Ni2+) on the corrosion of carbon (C)-steel in hydrochloric acid were investigated using gravimetric measurements, potentiodynamic polarization, and electrochemical impedance spectroscopy (EIS). The FB-MAL inhibited C-steel corrosion in acidic media up to 76.5%. Combining the FB-MAL with Ni2+ enhanced the adsorption capability of FB-MAL, greatly and consequently increased its inhibitive effect. Potentiodynamic polarization studies revealed that FB-MAL and FB-MAL + 100 ppm Ni2+ behave as mixed-type inhibitors. The EIS spectra showed that the charge transfer controls the corrosion process. The studied system obeys the Langmuir adsorption isotherm. The kinetic parameters were computed and are discussed later in this paper. The formation of the protective film was confirmed using Fourier transform-infrared spectroscopy, UV-Visible spectroscopy and scanning electron microscopy.
1. Introduction
Iron or carbon (C)-steel alloys are widely used in many acidic industrial applications such as oil recovery, refining crude oil, and petrochemical processes. Such industries require many processes, e.g., acid pickling, industrial cleaning, and acid descaling to be performed at regular intervals to improve the efficiency of the industrial process. Hydrochloric acid, phosphoric acid and/or sulfuric acids are widely preferred because of their regular aggressiveness as well as their special chemical properties.1Corrosion is a ubiquitous problem that continues to be of great relevance in a wide range of industrial applications and products. It results in the degradation and eventual failure of components and systems both in the processing and manufacturing industries and in the service life of many components.
One of the most challenging and difficult tasks for industry is the protection of metals from corrosion. Corrosion damage can be prevented by using various methods such as upgrading materials used, blending of production fluids, process control and chemical inhibition.2 Among these methods, the use of corrosion inhibitors is preferred as it prevents destruction or degradation of metal surfaces in corrosive media. The use of corrosion inhibitors is the most economical and practical method for reducing corrosive attack on metals. Corrosion inhibitors are either synthetic or natural chemicals, which when added in small amounts to an environment, decrease the rate of attack by the environment on the metals. However, in some cases the inhibitors used do not efficiently stop the corrosion. Increase in the effectiveness of a corrosion inhibitor can be accomplished using synergism. Synergism is when the combined effect of substances is greater than their individual effects. The synergistic effect is demonstrated in the presence of a secondary species, which can be a halide or a cation, depending on the type of the original inhibitor. Halide synergism3 occurs because of the increased surface coverage achieved by the ion-pair interactions between the cationic organic inhibitor and the halide anion.
However, cations which have been used for synergism such as tin (Sn2+) or copper (Cu2+) mixed with a synthetic cationic gemini surfactant4 to form a complex between the cations and the surfactant, have been shown to enhance the protection of the metal against corrosion.
A number of synthetic compounds1,4 are known to be good corrosion inhibitors for metals. Nevertheless, the popularity and use of synthetic compounds as a corrosion inhibitor has diminished because of the strict environmental regulations and toxic effects of these compounds on human and animal life. Consequently, there exists a need to develop a new class of corrosion inhibitors with low toxicity, eco-friendliness and good efficiency.
The exploration of natural products as corrosion inhibitors is becoming the subject of extensive investigation, principally because of the low cost and eco-friendliness of these products. Plant extracts can be composed of several natural compounds which have corrosion inhibiting abilities. The yield of these compounds as well as the corrosion inhibition ability varies widely depending on the part of the plant5 used and its location. The extracts from the leaves, seeds, heartwood, bark, roots and fruits of plants have been reported to inhibit metallic corrosion in acidic media.5 Many plant extracts have been used as effective corrosion inhibitors of iron and steel in acidic media. Examples of these plants are: Artemisia mesatlantica,6 Murraya koenigii leaf,7 strawberry fruit,8 Medicago sativa,9 Morinda tinctoria leaves,10 Santolina chamaecyparissus,11 Spirogyra algae12 and Melia azedarach Linn (MAL) seeds.13 Most green corrosion inhibitors are obtained from methanol, ethanol, aqueous, acid, or formaldehyde extracts of plant materials.14
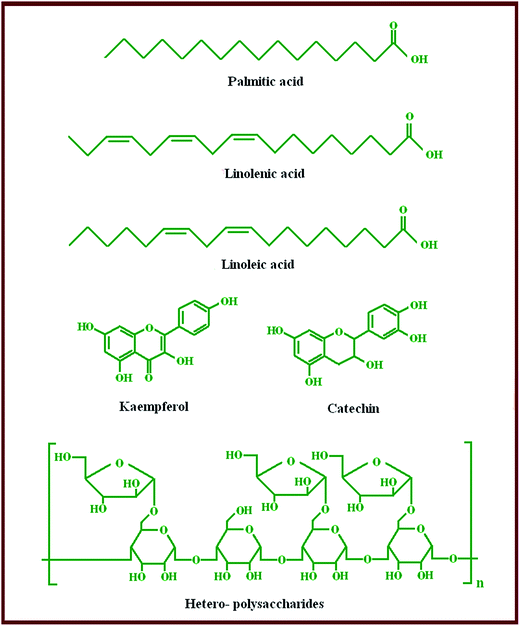
Melia azedarach Linn is a botanical species belonging to the family Meliaceae and it grows in many places around the world.15 The phytochemical of the fruiting bodies of MAL (FB-MAL) contains active ingredients such as tannins and low molecular weight polyphenolic compounds. The major low molecular weight polyphenols identified are catechin and kaempferol which are flavonoids.15 FB-MAL also contains water-soluble hetero-polysaccharides.16 Furthermore, it contains oils such as palmitic, linolenic and linoleic acids.17
Contributing to the current interest on environmentally friendly corrosion inhibitors, the present study aims to broaden the application of plant extracts for metallic corrosion inhibition by investigating the inhibitive properties of aqueous FB-MAL on C-steel corrosion in 2 M HCl and to study the synergistic effect of FB-MAL + 100 ppm of nickel (Ni2+). The degree of protection of FB-MAL, with and without 100 ppm of Ni2+, against the corrosion of C-steel as well as the information about the mechanism of the inhibition process were determined using different techniques: potentiodynamic polarization, electrochemical impedance spectroscopy (EIS), gravimetric measurements, UV-Visible (UV-Vis) spectroscopy, Fourier transform-infrared (FT-IR) spectroscopy and scanning electron microscopy (SEM).
2. Experimental details
2.1 Materials
![[thin space (1/6-em)]](https://www.rsc.org/images/entities/char_2009.gif) 000 ppm in 100 mL of bi-distilled water. The desired concentrations of 50 ppm, 100 ppm, 200 ppm, 400 ppm, and 600 ppm were prepared by appropriate dilution and used for the corrosion inhibition activity tests. The co-inhibitor employed was 100 ppm of nickel chloride hexahydrate (NiCl2·6H2O) which was prepared from an AR grade reagent.
000 ppm in 100 mL of bi-distilled water. The desired concentrations of 50 ppm, 100 ppm, 200 ppm, 400 ppm, and 600 ppm were prepared by appropriate dilution and used for the corrosion inhibition activity tests. The co-inhibitor employed was 100 ppm of nickel chloride hexahydrate (NiCl2·6H2O) which was prepared from an AR grade reagent.2.2 Methods
The corrosion rate was calculated in milligrams per square centimeter per hour (mg cm−2 h−1) using the following equation:
 | (1) |
The inhibition efficiencies (IE) were evaluated using to eqn (2), where CR0W and CRW are the corrosion rates without and with the inhibitor, respectively.
 | (2) |
The degree of surface coverage of the inhibitor molecules at the metal surface were determined from IE(W) using the following equation:
 | (3) |
The IE and fractions of surface coverage (θ) were evaluated from following equations:
 | (4) |
 | (5) |
EIS experiments were conducted using a computer controlled Princeton Applied Research PARSTAT 4000 teamed with the VersaStudio software package for calculation of corrosion parameters such as charge transfer resistance (Rct) and some parameters related to double layer capacitance (Cdl) values. EIS studies were carried out at a potential amplitude of 10 mV, peak to peak (AC signal) in the frequency ranging from 100 kHz to 0.1 Hz.
The IE of FB-MAL and FB-MAL + 100 ppm Ni2+ treated C-steel alloy were computed using the following equation:
 | (6) |
2.3 Scanning electron microscopy (SEM)
The surface morphology of C-steel specimens immersed in 2 M HCl, 2 M HCl + 600 ppm FB-MAL, and 2 M HCl + 600 ppm FB-MAL + 100 ppm Ni2+, respectively, were studied using a FEI Quanta FEC 250 SEM microscope. The specimens were immersed in the test solutions for 6 h before analysis at 303 K. SEM images of the C-steel coupons were compared using different experimental conditions.2.4 UV-Visible spectroscopy
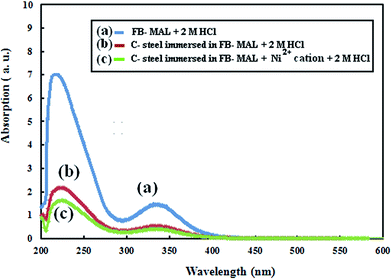
The adsorption behavior of the organic compounds of FB-MAL at the C-steel surface with and without 100 ppm Ni2+ were confirmed using UV-Vis spectroscopy. The analyses were performed on Jasco V-530 UV-Vis spectrophotometer within the range 200 nm to 1300 nm using a 10 mm matched silica cell. A 50 ppm FB-MAL solution in 2 M HCl as a control was analyzed before and after the weight loss tests (with and without 100 ppm of Ni2+). The test spectra obtained were compared with the control to investigate its adsorptive nature.2.5 FT-IR spectroscopy
The nature of the surface film formed at the C-steel electrode in 2 M HCl solution in the presence of FB-MAL with and without 100 ppm Ni2+ cations were examined by collecting the layers produced after the weight loss test by scratching the C-steel coupons, washing them carefully with bi-distilled water and then analyzing them using FT-IR spectroscopy.3. Results and discussion
3.1 FT-IR spectroscopy of FB-MAL
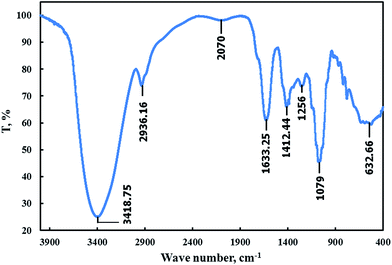
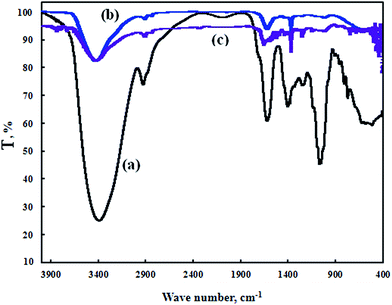
Fig. 1 shows the FT-IR spectra for FB-MAL. It can be seen from the figure, that –OH stretching bands of alcohol or phenol can be assigned at 3418.75 cm−1. The band at 2936 cm−1 is related to the –C–H aromatic stretching frequency. The –C![[double bond, length as m-dash]](https://www.rsc.org/images/entities/char_e001.gif) C– vibrations in aromatic rings or alkenes are assigned at 1633 cm−1. The assigned band at 1412.44 cm−1 corresponds to the –CH2 bending frequency. Vibration of the aromatic ring appears at 1256 cm−1. The band that appeared at 1079 cm−1 is associated with –C–O stretching vibration. A series of absorption bands below 1000 cm−1 are ascribed to aliphatic and aromatic C–H group vibrations. Therefore, it was concluded that, FB-MAL contains aromatic rings and different oxygenated functional groups, which meet the standard specification of inhibitors. Fig. 2 shows the chemical composition of the major constituents of extract tested15–17 which agrees with the FT-IR results.
C– vibrations in aromatic rings or alkenes are assigned at 1633 cm−1. The assigned band at 1412.44 cm−1 corresponds to the –CH2 bending frequency. Vibration of the aromatic ring appears at 1256 cm−1. The band that appeared at 1079 cm−1 is associated with –C–O stretching vibration. A series of absorption bands below 1000 cm−1 are ascribed to aliphatic and aromatic C–H group vibrations. Therefore, it was concluded that, FB-MAL contains aromatic rings and different oxygenated functional groups, which meet the standard specification of inhibitors. Fig. 2 shows the chemical composition of the major constituents of extract tested15–17 which agrees with the FT-IR results.
3.2 Gravimetric measurements
| Ccation (ppm) | FB-MAL concentration (ppm) | Corrosion rate (mg cm−2 h−1) | Surface coverage (θ) | IE (%) |
|---|---|---|---|---|
| 0 | 0 | 3.500 ± 0.13 | — | — |
| 50 | 2.800 ± 0.92 | 0.200 | 20.00 ± 1.54 | |
| 200 | 1.954 ± 0.72 | 0.442 | 44.00 ± 1.09 | |
| 400 | 1.297 ± 0.62 | 0.629 | 62.95 ± 0.91 | |
| 600 | 0.821 ± 0.52 | 0.765 | 76.56 ± 0.91 | |
| 100 ppm Ni2+ | 50 | 2.040 ± 0.85 | 0.417 | 41.68 ± 1.23 |
| 200 | 1.330 ± 0.79 | 0.620 | 62.01 ± 1.17 | |
| 400 | 0.706 ± 0.78 | 0.798 | 79.83 ± 1.22 | |
| 600 | 0.250 ± 0.52 | 0.929 | 92.86 ± 0.80 |
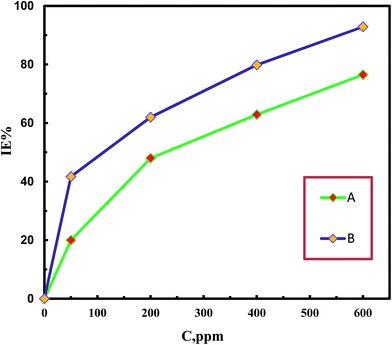
The corrosion rate values, degree of surface coverage (θ), and the IE in 2 M HCl contain different concentrations of FB-MAL with and without 100 ppm Ni2+ at 303 K are listed in Table 1. It is seen from the results in Table 1 that increasing the FB-MAL concentration decreases the corrosion rate of C-steel, consequently increasing both θ and IE. This behavior could be related to the increase in adsorption of FB-MAL molecules at the metal/solution interface with increasing concentration. The results in Table 1 also show that addition of 100 ppm Ni2+ to different concentrations of FB-MAL in a corrosive media effectively decreases the C-steel corrosion rate. These results indicate that this synergistic system can effectively be adsorbed at the low C-steel surface forming a protective layer, which prevents diffusion of the corrosive medium and hindering its destructive effect. The effect of FB-MAL at different concentrations on the IE (%) of C-steel immersed in 2 M HCl with and without 100 ppm Ni2+ are shown in Fig. 3. In the absence of the metal cation, the IE shows a small inhibitive effect even with an increased concentration of the FB-MAL. The maximum IE of 76.5% was attained using 600 ppm of the extract, and further increase in the concentration did not cause any significant change in the inhibitor performance. This finding was attributed to several factors: (1) the saturation state of the molecules adsorbed at the C-steel surface, and (2) steric effects operating between these adsorbed particles. However, at all concentrations of FB-MAL studied, the presence of 100 ppm of Ni2+ enhanced the inhibition performance of the extract because of the increased surface coverage given by FB-MAL and Ni2+. These results suggest that there is a synergistic effect between FB-MAL molecules and Ni2+ ions. The inhibition efficiency was raised to approximately 93% by addition of 100 ppm of Ni2+ ions to aggressive media containing 600 ppm of FB-MAL.
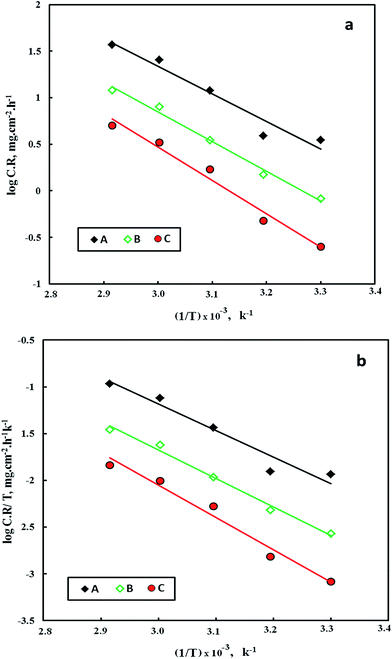 | ||
| Fig. 4 Arrhenius (a) and alternative Arrhenius (b) plots for C-steel in: 2 M HCl (A), 2 M HCl + 600 ppm FB-MAL (B), 2 M HCl + 600 ppm FB-MAL + 100 ppm Ni2+ (C). | ||
The synchronous presence of 100 ppm of Ni2+ with 600 ppm FB-MAL in the corrosive media effectively retarded the corrosion rate of C-steel (compared to 600 ppm FB-MAL alone) as a result of a protective film formed at the metal surface.
The dependence of the corrosion rate on temperature can be expressed using Arrhenius equation:18
 | (7) |
The apparent activation energies (Ea) for the corrosion process were calculated using the plots in Fig. 4a and are given in Table 2. It is obvious that the presence of FB-MAL or FB-MAL in synergy with Ni2+ increases the apparent Ea compared to the blank value. This result is generally interpreted as a strong adsorption of different inhibitors at the C-steel surface.3,20
The thermodynamic parameters for corrosion of C-steel in free 2 M HCl solution, and that containing 600 ppm of FB-MAL in both with and without 100 ppm Ni2+ were calculated from the slopes and intercepts of lines in Fig. 4b using the following equation:20
 | (8) |
The values of ΔS* and ΔH* were calculated and are given in Table 2. The data in Table 2 revealed that the inhibited solutions showed high values of ΔH* compared to that obtained for the uninhibited one indicating a higher protection efficiency.20 The adsorption process leads to a rise in the enthalpy of activation through the increase in the energy barrier for the dissolution reaction, thus, slowing the dissolution of C-steel in the presence of inhibitors. The positive values of ΔH* reflect the endothermic nature of the dissolution of the tested alloy in the corrosive media. The low negative values of the entropy of activation in the presence of the inhibitors compared to the free acid solution, suggest that there is an increase in randomness which occurred while moving from reactants to the activated complex.20
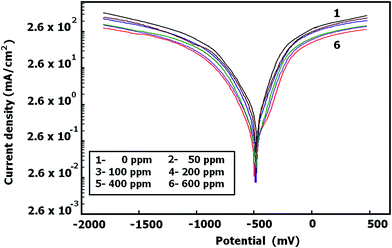
3.3 Potentiodynamic polarization
Measurements of potentiodynamic polarization were also carried out for C-steel in 2 M HCl solution containing different concentrations of FB-MAL in the presence of 100 ppm of Ni2+ (not shown). The values of the electrochemical kinetic parameters: corrosion potential (Ecorr), corrosion current density (icorr) and Tafel slope constants (βa and βc), were determined using the well known Tafel extrapolation method, and the results are summarized as a function of inhibitor concentration in Table 3. It is clear that in the systems tested, that increasing inhibitor concentration decreases icorr, βa, and βc whereas Ecorr does not change significantly. This indicates that the inhibitors tested behave as mixed type inhibitor, where they are adsorbed at the alloy surface and then impeded the electrochemical reaction by merely blocking the reaction sites of the alloy surface without affecting the anodic and cathodic reaction (this does not change the mechanism of iron dissolution and hydrogen evolution reactions).
| System | CMAL (ppm) | Ecorr (mV) | icorr (mA cm−2) | βa (mV dec−1) | βc (mV dec−1) | IE (%) | Sθ |
|---|---|---|---|---|---|---|---|
| 2 M HCl | 0 | −480 | 1.35 | 174 | −228 | — | — |
| 2 M HCl + 100 ppm Ni2+ | 0 | −464 | 0.66 | 149 | −209 | 51.11 | — |
| 2 M HCl | 50 | −437 | 1.02 | 140 | −209 | 24.44 | — |
| 100 | −452 | 0.883 | 130 | −185 | 34.59 | — | |
| 200 | −437 | 0.630 | 101 | −164 | 53.33 | — | |
| 400 | −458 | 0.350 | 107 | −143 | 74.07 | — | |
| 600 | −465 | 0.338 | 100 | −140 | 74.96 | — | |
| 2 M HCl + 100 ppm Ni2+ | 50 | −438 | 0.430 | 100 | −170 | 68.14 | 1.16 |
| 100 | −440 | 0.38 | 98 | −174 | 71.85 | 1.14 | |
| 200 | −451 | 0.24 | 100 | −155 | 82.22 | 1.28 | |
| 400 | −430 | 0.17 | 97 | −189 | 87.41 | 1.03 | |
| 600 | −427 | 0.093 | 83 | −160 | 93.11 | 1.74 |
Table 3 shows that the presence of 100 ppm of Ni2+ gives a slight increase of the corrosion inhibition of C-steel alloy in free HCl. This result can be attributed to the inorganic cathodic inhibitor nature of the Ni2+ cations because of its alkalinity.21–24 The corrosion inhibition by Ni2+ may be because its adsorption at the cathodic reaction sites helps to form a compact and adherent film that restricts the diffusion of reducible species, thus decreasing the main cathodic reaction21 demonstrated by the following equation:
| 2H+ + 2e → H2↑ | (I) |
Therefore, the corrosion reaction is hindered because of the blocking of the reaction path of the iron dissolution.
It is obvious from results in Table 3 that the presence of 100 ppm of Ni2+ at different concentrations of FB-MAL causes a marked decrease in the corrosion rate (icorr) (compared to FB-MAL alone), consequently, the IE increases significantly. These results indicate that the addition of 100 ppm of Ni2+ at different concentrations of FB-MAL increases the surface coverage by the different adsorbed molecules of FB-MAL and consequently decreases the reaction rate. This result means that FB-MAL acts efficiently as a corrosion inhibitor for C-steel protection in the presence of 100 ppm of Ni2+ because of the synergistic effect.
This interaction can be increased by synergism. The synergism parameter (Sθ) is defined as:3,25
 | (9) |
Sθ approaches unity when no interaction takes place between the inhibitor molecules and the cation tested. At Sθ > 1, a synergistic effect is obtained which is a result of co-operative adsorption. For Sθ < 1, antagonistic behavior prevails because of competitive adsorption.3 Table 3 shows the Sθ estimated for C-steel in 2 M HCl solution containing 100 ppm of Ni2+ and different concentrations of FB-MAL. The Sθ values were found to be more than unity, suggesting a co-operative adsorption of Ni2+ with the FB-MAL. These results indicate that the FB-MAL can act as an effective inhibitor for C-steel in a 2 M HCl solution even at a low concentration in the presence of 100 ppm Ni2+ because of the synergistic effect.
| Org(sol) + nH2O(ads) → Org(ads) + nH2O(sol) | (II) |
The interaction between the metal and the inhibitor molecules can be described by different adsorption isotherms.26,27 From the experimental results, it was found that a correlation between surface coverage (θ) and the concentration (C) of inhibitors in the aggressive media was represented by the Langmuir adsorption isotherm according to the following equation:
 | (10) |
 | (11) |
 is the standard free energy of adsorption and Csolvent is the concentration of water in solution which has the value 1.106 mg L−1. The θ values were computed from potentiodynamic plots at 303 K (by using eqn (5)).
Plotting Cinh/θ versus Cinh resulted in straight lines as shown in Fig. 6, where both the linear correlation coefficient (R2) and the slopes are very close to unity, indicating that the adsorption of the FB-MAL and Ni2+ FB-MAL species at the C-steel surface obey the Langmuir adsorption isotherm in the 2 M HCl solution. According to the Langmuir adsorption isotherm, the inhibitor molecules tested have a typical adsorption site at the metal/solution interface with no interaction with the other molecules adsorbed.28
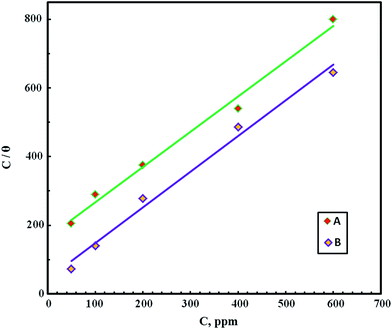 | ||
| Fig. 6 Langmuir adsorption isotherm for FB-MAL concentrations (A), FB-MAL concentrations + 100 ppm of Ni2+ (B). | ||
The adsorption equilibrium constant (Kads) for both FB-MAL, FB-MAL + 100 ppm Ni2+, can be calculated using the reciprocal of the intercept of the Cinh/θ − Cinh curve. The values of Kads for FB-MAL, and FB-MAL + 100 ppm Ni2+ were 0.006 and 0.023 M−1, respectively. The value of Kads for FB-MAL + 100 ppm Ni2+ was greater than that for FB-MAL alone. This result can be interpreted as the adsorption of FB-MAL in presence of Ni2+ was more efficient because of the increasing capability of adsorption at the metal surface and thus, the inhibition efficiency was improved.3,29 Kads is related to  according to eqn (11). The calculated values of
  obtained for FB-MAL, and FB-MAL + 100 ppm Ni2+ were −21.7, and −24.94 kJ mol−1, respectively, indicating that the adsorption mechanism of the inhibitors at the C-steel in 2 M HCl solution involved electrostatic adsorption.8,12 The calculated values of
  , indicated that both physisorption (major contributor) and chemisorption (minor contributor) of the inhibitors occur at the metal surface. It is obvious that the calculated
  values in the presence of Ni2+ with FB-MAL were more negative than that in its absence. This suggests that there is the formation of a strong adsorbed film in the presence of Ni2+ with FB-MAL at the C-steel surface.
3.4 Electrochemical impedance spectroscopy (EIS)
Fig. 7a–c shows the Nyquist (a), Bode (b) and Bode phase (c) plots obtained for C-steel sample in 2 M HCl solution containing different concentrations of FB-MAL. Measurements of EIS were also conducted for C-steel in 2 M HCl solution containing 600 ppm of FB-MAL in presence of 100 ppm of Ni2+ (results not shown). Inspection of Fig. 7a reveals that the Nyquist plot of C-steel in 2 M HCl containing different concentrations of FB-MAL does not give the typical semicircle which is according to EIS theory. The variation from ideal semicircle is assigned to the frequency dispersion, the inhomogeneities of the C-steel surface and the mass transport resistance.30 The depressed Nyquist plot referring to C-steel corrosion in 2 M HCl solution is predominately determined by a charge transfer process.30 The diameter of the semicircles (or the value of charge transfer resistance, Rct) of C-steel specimens in the Nyquist plot was considerably increased with increasing concentrations of FB-MAL (Fig. 7a). The increase of the semicircle diameter in the Nyquist plot revealed that the FB-MAL shows good efficiency in corrosion control of C-steel, which could be associated with the significant adsorption of FB-MAL components at the C-steel surface in the pickling solution.31–33 An increase in charge transfer resistance could increase the tendency of the current to pass through the capacitor in the circuit leading to the capacitive behavior of the electrode/electrolyte system.31 Similar behavior of the Nyquist plot was obtained when 600 ppm of FB-MAL + 100 ppm of Ni2+ were used.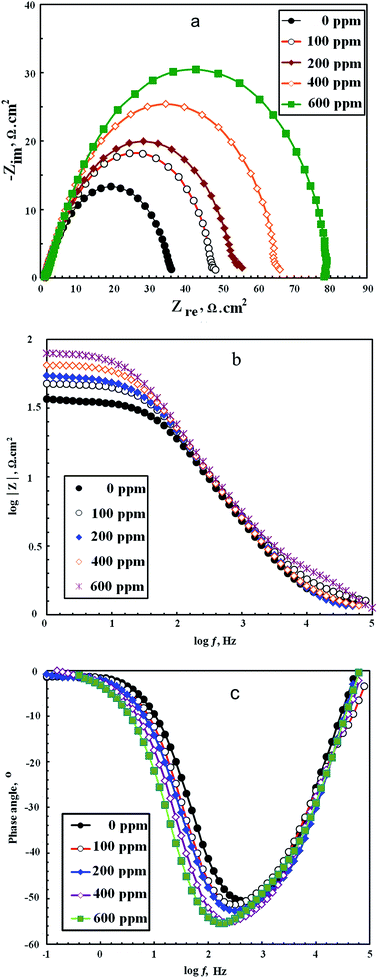 | ||
| Fig. 7 Nyquist (a) Bode (b) and Bode phase (c) plots of a C-steel electrode in 2 M HCl solution with and without different concentrations of FB-MAL. | ||
The experimental α value, which determined the alloy surface irregularity, were calculated from the slope of the linear region of log(f) versus log|Z| plots (Fig. 7b) and results given in Table 4. Theoretically, the value of α should be equal to −1 for an ideal capacitor. It was found that the α-values for C-steel in the corrosive media studied (with and without inhibitors) were less than 1. This result was attributed to the corrosion of the steel in 2 M HCl solution leading to coarseness of the metal surface, and thus, heterogeneity of the C-steel surface was attained. It can be seen from Table 4, that the presence of FB-MAL or 600 ppm of FB-MAL + 100 ppm Ni2+, both in 2 M HCl solution increased the α-value from −0.57 to −0.95, thus indicating the decrease of heterogeneity of the metal surface as a result of adsorption of the two inhibitors studied. Fig. 7c shows that increasing the concentration of FB-MAL in 2 M HCl results in more negative values of phase angle indicating that the inhibitive behavior occurred because more of the FB-MAL molecules adsorbed at the C-steel surface forming a FB-MAL complex which was able to protect the surface of C-steel from corrosion and thus giving rise to a low corrosion rate. It is seen from the Nyquist and Bode plots, one semicircle and a single peak, respectively. These results indicated the existence of one time constant in the electrochemical process related to the electrical double layer formed at the C-steel surface-solution interface.
| CMAL (ppm) | Ccation (ppm) | Rs (Ω cm2) | Rct (Ω cm2) | Q (sα Ω−1 cm−2) | fmax (Hz) | α | IE (%) |
|---|---|---|---|---|---|---|---|
| 0 | 0 | 1.68 | 34.85 | 0.027 | 63.10 | −0.57 | — |
| 100 | 0 | 1.50 | 45.70 | 0.021 | 50.11 | −0.60 | 23.74 |
| 200 | 0 | 1.64 | 52.00 | 0.018 | 39.80 | −0.61 | 32.98 |
| 400 | 0 | 1.90 | 64.10 | 0.015 | 25.12 | −0.63 | 45.63 |
| 600 | 0 | 1.66 | 77.00 | 0.013 | 19.95 | −0.64 | 54.74 |
| 600 | 100 ppm Ni2+ | 1.02 | 245.11 | 5.9 × 10⁻⁵ | 12.00 | −0.95 | 85.78 |
Nyquist plots simulate Randles' model because the experimental data agree with it as shown in Fig. 8. Rs denotes the solution resistance, Rct is the Nyquist plot diameter which is expressed by the charge transfer resistance and CPE is the constant phase element which replaces the capacitance of the electrical double layer (Cdl).30
The impedance of the CPE is expressed by the following equation:33,34
| ZCPE = Q−1(Jω)−α, | (12) |
Table 4 shows the corrosion parameters obtained from EIS plots. Inspection of Table 4 reveals that the values of Rct are increased with increase in the FB-MAL concentration and this occurs as a result of adsorption of the inhibitor molecules at the C-steel surface forming a protective layer which can isolate the metal surface from the aggressive media, and consequently, the IEEIS increased with increasing FB-MAL concentration. However, the presence of 100 ppm of Ni2+ with 600 ppm of FB-MAL increases the Rct sufficiently and consequently there is an efficient increase in IEEIS. Also it can be seen from the results in Table 4 that the Qdl values decreased with increasing FB-MAL concentration and this may be because of the increment of electrical double layer thickness because of the adsorbed molecules of the extract on metal surface and replacement of water molecules by FB-MAL molecules. However, the presence of 600 ppm FB-MAL + 100 ppm of Ni2+ in the corrosive solution decreases Qdl sufficiently. The increase of the “α” parameter with increasing concentration of the extract could be related to the adsorption of inhibitor molecules at the metal surface which lead to less heterogeneity of the C-steel surface. At 600 ppm of FB-MAL with and without 100 ppm of Ni2+, the “α” value changed from −0.64 to −0.95, indicating an efficient reduction of surface heterogeneity in presence of Ni2+. This behavior secures the synergistic effect of Ni2+ with FB-MAL molecules because of the formation of a protective film or complex from the acidic solution at the metal/solution interface.34
3.5 Inhibition mechanism
FB-MAL is an oxygen-containing organic compound (see Section 3.1), which contains lone-pair electrons and π-electrons. The FB-MAL constituents exist either as neutral molecules or protonated molecules in HCl solution as follows:| FB-MAL + xH+ ↔ [FB-MALHx]x+ | (III) |
In addition, the potential of zero charge (Eq = 0) for iron in HCl is −590 mV versus SCE. In the present case, Ecorr equals −480 mV versus SCE of C-steel in 2 M HCl solution. Consequently, the C-steel surface carries a positive charge because of the Ecorr − Eq = 0 > 0.35,36 Therefore, FB-MAL may be adsorbed at the C-steel/acid solution interface by one or more of the following ways:
(i) The protonated organic compounds of FB-MAL may be adsorbed through its electrostatic interactions with the positively charged metal surface by using chloride ions attached to the metal surface as a negative bridge. Afterwards the donor–acceptor interaction is achieved between the oxygen atom or π-electrons of FB-MAL constituents and the vacant d-orbital of the surface iron atoms (or may be linked with the freshly generated Fe2+ ions at the steel surface) forming metal inhibitor complexes as follows:
| Fe → Fe2+ + 2e− | (IV) |
| [FB-MALHx]x+ + Fe2+ → [FB-MALHx-Fe](2+x)+ | (V) |
(ii) The neutral organic compounds of FB-MAL may be adsorbed at the metal surface via the chemisorption mechanism, involving the displacement of water molecules from the metal surface, where the FB-MAL molecules can be adsorbed at the metal surface on the basis of donor–acceptor interactions between π-electrons and/or oxygen and vacant d-orbitals of Fe.6 Interaction between unshared electron pairs of oxygen or π-electrons of the aromatic ring of FB-MAL molecules and vacant d-orbital of surface iron atoms is as follows:
| Fe·H2Oads + FB-MAL → Fe·FB-MALads + H2O | (VI) |
(iii) In this present research, the presence of 100 ppm of Ni2+ in inhibited solutions increase the surface coverage of the C-steel. These results can be explained because of Ni2+, which as a transition element has a vacant orbit (3d). However, on the other side FB-MAL contains oxygen atoms with a lone pair of electrons and π-electrons of the aromatic rings. When the extract and Ni2+ were mixed, the new complex Ni2+ FB-MAL was easily produced. This complex plays an important role in the enhancement of the protection of C-steel against corrosion.4 Stabilization of adsorbed Ni2+ with FB-MAL lead to greater surface coverage at the C-steel surface and thereby greater inhibition efficiency. The complex is able to be adsorbed at the steel surface because of van der Waals forces which form a denser and more tightly protective film, which drastically decreases the steel surface corrosion. Furthermore, FB-MAL, molecules may work as a bridge for the approaching Ni2+ to reach the C-steel surface from the aggressive media. Consequently, Ni2+ and the FB-MAL molecules exhibit a strong synergistic inhibition effect for C-steel in 2 M HCl.
The proposed mechanism was confirmed as described in the next sections.
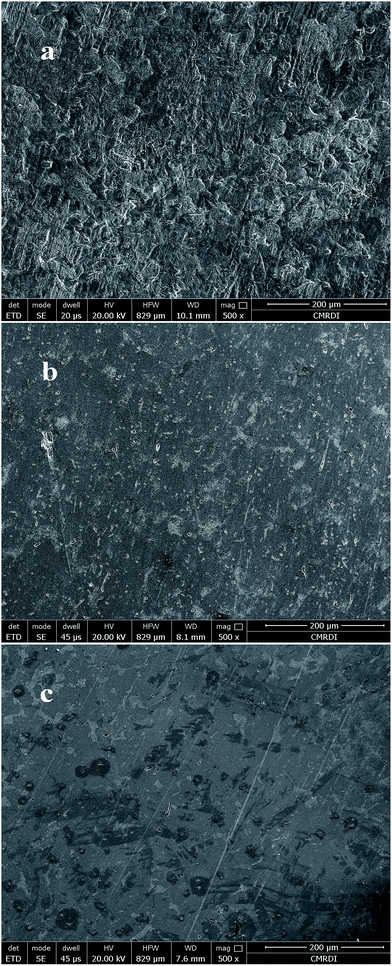 | ||
| Fig. 9 SEM images of C-steel immersed in 2 M HCl (a) free, (b) containing 600 ppm of FB-MAL, (c) containing 600 ppm of FB-MAL + 100 ppm Ni2+. | ||
The morphology in Fig. 9a shows a rough surface, which characterizes the uniform corrosion of C-steel in acid solution. In the presence of FB-MAL, Fig. 9b, a slightly smooth surface can be observed because of the formation of the green inhibitor's protective film on the metal surface. However, the presence of 100 ppm Ni2+ together with the FB-MAL efficiently enhances the surface smoothness of the C-steel surface (Fig. 9c). This finding may confirm the synergism between the Ni2+ and the FB-MAL molecules for improving the efficiency of inhibition for the C-steel.
![[double bond, length as m-dash]](https://www.rsc.org/images/entities/char_e001.gif) C– vibrations in the aromatic ring, alkenes and/or –C
C– vibrations in the aromatic ring, alkenes and/or –C![[double bond, length as m-dash]](https://www.rsc.org/images/entities/char_e001.gif) O– (ref. 37 and 38) at 1633 cm−1 became a poor absorption peak and changed to weak absorption bands at 1670 and 1635 cm−1 with and without 100 ppm Ni2+, respectively. Also the sharp peak at 1412 cm−1 for the FB-MAL estimated to be the –CH2 bending frequency, was converted to poor absorption peaks at 1384 cm−1 for the two inhibitor systems studied. The band appearing at 1256 cm−1 for the FB-MAL which corresponds to the vibrations of the aromatic ring had nearly disappeared after the weight loss tests. The band of FB-MAL at 1079 cm−1 which was assigned to the –C–O stretching vibration (alcohol/ester) became negligible in the scratched samples as shown in Fig. 10. The current changes in absorption bands show the adsorption of different components of the FB-MAL at the C-steel surface with and without Ni2+.
O– (ref. 37 and 38) at 1633 cm−1 became a poor absorption peak and changed to weak absorption bands at 1670 and 1635 cm−1 with and without 100 ppm Ni2+, respectively. Also the sharp peak at 1412 cm−1 for the FB-MAL estimated to be the –CH2 bending frequency, was converted to poor absorption peaks at 1384 cm−1 for the two inhibitor systems studied. The band appearing at 1256 cm−1 for the FB-MAL which corresponds to the vibrations of the aromatic ring had nearly disappeared after the weight loss tests. The band of FB-MAL at 1079 cm−1 which was assigned to the –C–O stretching vibration (alcohol/ester) became negligible in the scratched samples as shown in Fig. 10. The current changes in absorption bands show the adsorption of different components of the FB-MAL at the C-steel surface with and without Ni2+.
4. Conclusions
This research has led to the following conclusions:(1) FB-MAL acts as a good, eco-friendly green inhibitor for the corrosion control of C-steel in 2 M HCl solution.
(2) FB-MAL acts as a mixed inhibitor by inhibiting both cathodic and anodic reactions and the adsorption of FB-MAL at the surface of C-steel follows Langmuir adsorption isotherm.
(3) The inhibitive performance of the novel FB-MAL is improved by a combination of different concentrations of FB-MAL with 100 ppm of Ni2+.
(4) The IE obtained from the weight loss, potentiodynamic, and EIS measurements, were all in good agreement.
(5) Results from SEM, FT-IR and UV-Vis spectroscopy show that, the addition of inhibitors to aggressive solutions results in the formation of a protective film at the C-steel surface.
Acknowledgements
The authors wish to thank all the staff members at the Chemistry Department, Benha University, and the Central Metallurgical R&D Institute, Egypt for their guidance. The authors are greatly thankful to Cairo Oil Refining Company for petroleum refining, and for providing the C-steel coupons.References
- G. Moretti, F. Guidi and F. Fabris, Corros. Sci., 2013, 76, 206–218 CrossRef CAS.
- M. S. Al-Otaibi, A. M. Al-Mayouf, M. Khan, A. A. Mousa, S. A. Al-Mazroa and H. Z. Alkhathlan, Arabian J. Chem., 2014, 7, 340 CrossRef CAS.
- A. Khamis, M. M. Saleh and M. I. Awad, Corros. Sci., 2013, 66, 343–349 CrossRef CAS.
- M. A. Hegazy and S. A. El-Tabei, J. Surfactants Deterg., 2013, 16, 221–232 CrossRef CAS.
- D. Kesavan, M. Gopiraman and N. Sulochana, Chem. Sci. Rev. Lett., 2012, 1, 1 CAS.
- K. Boumhara, M. Tabyaoui, C. Jama and F. Bentiss, J. Ind. Eng. Chem., 2015, 29, 146–155 CrossRef CAS.
- K. S. Beenakumari, Green Chem. Lett. Rev., 2011, 4(2), 117–120 CrossRef CAS.
- A. Saviour Umoren, B. Ime Obot and M. Zuhair Gasem, Ionics, 2015, 21, 1171–1186 CrossRef.
- A. Torresa Rodríguez, M. G. Cisnerosb Valladares and J. G. Rodríguez González, Green Chem. Lett. Rev., 2016, 9(3), 143–155 CrossRef.
- K. Krishnaveni, J. Ravichandran and A. Selvaraj, Ionics, 2014, 20, 115–126 CrossRef CAS.
- M. Shabani-Nooshabadi and M. S. Ghandchi, Metall. Mater. Trans. A, 2015, 46, 5139 CrossRef CAS.
- D. Kumar Verma and F. Khan, Green Chem. Lett. Rev., 2016, 9(1), 52–60 CrossRef.
- A. Y. El-Etre and A. I. Ali, Chin. J. Chem. Eng., 2017, 25, 373–380 CrossRef.
- T. Balakrishnan, S. Sathiyanarayanan and S. Mayavan, ACS Appl. Mater. Interfaces, 2015, 7, 19781 CAS.
- G. Chiffelle Italo, F. Huerta Amanda and R. Lizana Diego, Chilean Journal of Agricultural Research, 2009, 69, 138 Search PubMed.
- L. He, N. Yin, J. W. Cheng, X. Q. Wu, J. X. Jiang and X. L. Song, Fitoterapia, 2009, 80, 399 CrossRef CAS PubMed.
- A. Hadjiakhoondi, H. Vatandoostb, M. Khanavia, H. Reza Sadeghipour-Roodsaric, M. Vosoughid, M. Kazemia and M. R. Abaib, Iran. J. Pharm. Sci., 2006, 2(2), 97–102 Search PubMed.
- M. A. Amin, H. Shokry and E. M. Mabrouk, Corrosion, 2012, 68(8), 699–712 CrossRef CAS.
- M. Abdallah, E. M. Kamar, A. Y. El-Etre and S. Eid, Prot. Met. Phys. Chem. Surf., 2016, 52(1), 140–148 CrossRef CAS.
- M. Salah Tawfik, RSC Adv., 2015, 5, 104535–104550 RSC.
- M. M. R. Ali, C. M. Mustafa and M. Habib, J. Sci. Res., 2009, 1(1), 82–91 CAS.
- E. C. Potter, Electrochemist Principle and Applications, Britain, 1976 Search PubMed.
- R. S. Thornhill, Ind. Eng. Chem., 1945, 37(8), 706–708 CrossRef CAS.
- K. J. Vetter, Electrochemical Kinetics, Academic Press, New York, 1962 Search PubMed.
- Science Data Book, ed. R. M. Tennet, Oliver and Boyd, Edinburgh, 1978, vol. 56, p. 478 Search PubMed.
- M. Hosseini, S. F. L. Mertens and M. R. Arshadi, Corros. Sci., 2003, 45, 1473 CrossRef CAS.
- H. B. Rudresh and S. M. Mayanna, J. Electrochem. Soc., 1977, 124, 340 CrossRef CAS.
- A. J. Bard and L. R. Faulkner, Electrochemical Methods, John Wiley & Sons, New York, 1980, p. 517 Search PubMed.
- A. S. Fouda, H. Tawfik, N. M. Abdallah and A. M. Ahmd, Int. J. Electrochem. Sci., 2013, 8, 3390–3405 CAS.
- S. Ramazan, Corros. Sci., 2010, 52, 3321–3330 CrossRef.
- N. A. Negma, N. G. Kandile, E. A. Badr and M. A. Mohammed, Corros. Sci., 2012, 65, 94 CrossRef.
- A. Doner and G. N. Kardas, Corros. Sci., 2011, 53, 4223 CrossRef CAS.
- R. Solmaz, E. Altunbas and G. Kardas, Mater. Chem. Phys., 2011, 125, 796 CrossRef CAS.
- R. Solmaz, G. Kardas, M. Culha, B. Yazıcı and M. Erbil, Electrochim. Acta, 2008, 53, 5941–5952 CrossRef CAS.
- F. Suedile, F. Robert, C. Roos and M. Lebrini, Electrochim. Acta, 2014, 133, 631–638 CrossRef CAS.
- R. Solmaz, Corros. Sci., 2014, 79, 169 CrossRef CAS.
- W. Kemp, Organic Spectroscopy, Palgrave, New York, 3rd edn, 2009, pp. 58–88 Search PubMed.
- T. Ramde, S. Rossi and C. Zanella, Appl. Surf. Sci., 2014, 307, 209–216 CrossRef CAS.
- M. Badertscher, P. Bühlmann and E. Pretsch, Structure Determination of Organic Compounds, Springer, Fourth, Revised and Enlarged Edition, 2009 Search PubMed.
- R. Parthik, P. Muthukrishnan, C. Shen-Ming, B. Jeyaprabha and P. Prakash, Int. J. Electrochem. Sci., 2015, 10, 3707–3725 Search PubMed.
| This journal is © The Royal Society of Chemistry 2017 |

