
 Open Access Article
 This Open Access Article is licensed under a Creative Commons Attribution-Non Commercial 3.0 Unported Licence
Synthesis and characterization of near-infrared-emitting CdHgTe/CdS/ZnS quantum dots capped by N-acetyl-L-cysteine for in vitro and in vivo imaging†
Xijing Liu a,
Peijiang Zhou*a,
Hongju Zhanb,
Hongyu Liua,
Jianwei Zhanga and
Yanan Zhaoc
a,
Peijiang Zhou*a,
Hongju Zhanb,
Hongyu Liua,
Jianwei Zhanga and
Yanan Zhaoc
aSchool of Resource and Environmental Science, Hubei Biomass-Resource Chemistry and Environmental Biotechnology Key Laboratory, Wuhan University, Wuhan 430079, China. E-mail: 2013102050031@whu.edu.cn; zhoupj@whu.edu.cn
bJingchu University of Technology, Jingmen 448000, China
cDepartment of Biomedical Engineering, School of Basic Medical Sciences, Wuhan University, Wuhan 430071, China
First published on 9th June 2017
Abstract
In this article, highly photoluminescent near-infrared (NIR)-emitting quantum dots (QDs) were directly synthesized in water by a fast, inexpensive and facile method. Unlike the conventional technique, biocompatible N-acetyl-L-cysteine (NAC) capped CdHgTe/CdS core/shell QDs were successfully synthesized through a one-pot sequential growth of the core and shell in a controlled manner. An additional ZnS shell was deposited around the outer layer of CdHgTe/CdS QDs to render the core/shell/shell QDs less sensitive to environmental changes and less toxic to living bodies. The experimental results from high resolution transmission electron microscopy and X-ray powder diffraction indicated the as-prepared QDs have a very small diameter and good monodispersity. Furthermore, the CdHgTe/CdS/ZnS core/shell/shell QDs were successfully applied for in vitro imaging, and the results demonstrated that the biocompatible NIR QDs exhibited highly spectrally and spatially resolved imaging. Moreover, the NAC capped QDs were directly used for in vivo tumor targeting of nude mice by passive targeting. The tumor was identified distinctly by the ultra-small QDs within only 2 h of blood circulation. Through the leakiness of the tumor vasculature, the QDs showed excellent accumulation in the tumor region for as long as 4 h. The results of acute toxicity tests showed that the biocompatible NIR QDs caused negligible harmful effects to the nude mice at experimental dosages, indicating that the high fluorescence probes can be highly effective in long-term diagnostics and therapy in in vivo observation.
Introduction
Synthesis, characterization and surface modification of quantum dots (QDs) and their applications to cell and animal biology have evolved in the past two decades.1,2 In contrast to traditional organic molecules, QDs possess unique optical properties such as high photoluminescence quantum yields (PLQYs), photobleaching stability and simultaneous detection of multiple signals.3–5 QDs emitting in the near-infrared (NIR) range (700–900 nm) are particularly useful in cellular labelling, deep-tissue imaging and tumor targeting. In this spectral window, Rayleigh scattering decreases with increasing wavelength, and the absorption by major biological tissues is markedly smaller compared with that of shortwave emitting QDs.6 More importantly, NIR QDs can penetrate tissue deeply and prevent autofluorescence from endogenous fluorophores, and thus can provide satisfactory signal-to-noise ratio and high sensitivity.7–9However, the preparation of high-quality NIR-emitting QDs has been an elusive topic in recent decades, despite the synthesis of various kinds of NIR-emitting QDs, such as CdTe,10 CdTe/CdSe11,12 and CdHgTe13–15 in organic solvents or aqueous solutions. By optimizing the synthesis procedure, CdTe QDs can emit NIR light, but the PLQYs are very low (usually less than 15%).10 For type II core/shell QDs, holes and the electrons are spatially separated in differently generated regions of the core/shell structure. Therefore, type II QDs could give a longer wavelength by increasing the shell thickness and core size. However, CdTe/CdSe QDs with high fluorescence are prepared in the organic phase. Using highly flammable and toxic dimethylcadmium limits the applicability of these QDs as biomaterials. Different amounts of Hg2+ ions were added into the CdTe QDs to shift their optical properties from the visible to NIR.13–15 Hg2+ reacted with the preformed CdTe nanoparticles, which changed the surface physicochemical properties of CdTe and abated the PLQYs.13–15 Hg2+ and Cd2+ have nearly identical ionic radii, and the parent lattice constants of CdTe and HgTe differ by only 0.3%.15 The main difference between Hg2+ and Cd2+ is attributed to the Hg chalcogenides have zero band gap. Therefore, Hg-based QDs exhibit higher reactivity and lower stability.15 In this case, the principle in forming an excellent CdHgTe ternary alloy system is to modify the internal structure by controlling the degree of uniform nucleation and subsequently passivating the surface of the Hg-based core with multiple shells.
CdHgTe QDs were grown at low temperature to prevent surface disorder of the crystal nuclei, exhibiting a high degree of crystallinity and high PLQYs.15 By contrast, a relatively high temperature was required for ligand decomposition for CdS shell structure formation.16 Therefore, a facile method to synthesize high PLQYs CdHgTe/CdS core/shell (CS) QDs within merely 20 min was demonstrated.17 Notably, the use of programmed heating process to integrate two correlative processes (the nucleation period and the epitaxial growth stage) is the key to successfully prepare excellent CdHgTe/CdS QDs.17 To further improve the PLQYs and reduce the toxicity of the as-prepared CdHgTe/CdS QDs, we epitaxially over coated an additional ZnS shell on the outer layer to form the CdHgTe/CdS/ZnS core/shell/shell CSS structure. However, in biomedical applications, QDs should possess excellent biocompatibility and low toxicity. These properties not only depend on their composition and particle size but also depend on their surface coating. To the best of our knowledge, 3-mercaptopropionic acid (MPA) is the most commonly used stabilizer for the synthesis of NIR QDs. However, MPA is a type of carcinogen, and the generated reactive oxygen species (ROS) is considered as one of the most important contributors to the QDs cytotoxicity.18–20 ROS are generated through photo-irradiation and from surface oxide and induces severe toxicity to cells by damaging cellular proteins, lipids, and DNA.18–20. Thus, we substituted MPA with NAC as the ideal stabilizer. When the cells were co-treated with NAC, the cytotoxicity was partially reversed. The biocompatibility ligand provide bioactivity and anti-oxidant activity property by acting as a direct scavenger of free radicals.21 Moreover, one of the key determinants of biodistribution and clearance of QDs is the surface charge.22 As a precursor of intracellular cysteine and glutathione, the thiol NAC is readily deacetylated in cells.21 Thus, the neutral NIR-emitting QDs displayed marked fluorescent signals for tumor monitoring than the QDs capped traditional ligands.2,10 In addition, the deacetylate process prolonged the half-life in blood, indicating high accumulation of the QDs in the tumor region for as long as 4 h.10,21–24 In this case, these water-dispersible, low toxicity, high PLQYs NIR-emitting QDs would be promising biomedical labels for tumor monitoring, tracking of metastasis and studying the effects of various therapeutics on cancer.
Experimental section
Materials and device
Cadmium chloride hemipentahydrate (CdCl2·2.5H2O, 99%), mercury chloride (HgCl2, 99%), N-acetyl-L-cysteine (NAC, 99%), tellurium powder (Te, 99.9%), potassium borohydride (KBH4, 99%), zinc acetate dehydrate (Zn(Ac)2·2H2O, 98%), sodium sulfide (Na2S, 99%), bovine serum albumin (BSA, 99%), phosphate buffer saline (PBS, pH = 7.2), Dulbecco's modified Eagle's medium (DMEM), 3-(4,5-dimethylthialzol-2-yl)-2,5-diphenyltetrazolium bromide (MTT), reagent grade ethanol and isopropanol were purchased from Sigma Aldrich. All the synthesis of QDs was carried out on a microwave digestion/extraction system, which was made by Milestone of Italy. The system operates at 2450 MHz frequency and works at 0–1600 W power. Exclusive Teflon® inner vessels with a volume of 50 mL are also equipped to provide security in the high-temperature (300 °C) or high-pressure (10 MPa) reaction.Synthesis of CdHgTe/CdS and CdHgTe/CdS/ZnS QDs
In a typical procedure, the CdTe precursor solution was obtained by adding pure NaHTe solution to N2-saturated CdCl2 solution at pH 8.5 in the presence of NAC. The concentration of the precursors was 1.25 mM with reference to the concentration of Cd2+, whereas the molar ratio of Cd2+/NAC/HTe− was fixed at 1![[thin space (1/6-em)]](https://www.rsc.org/images/entities/char_2009.gif) :1.9:0.2. The reaction between cadmium ions and NaHTe took place immediately after injection of 2 mL as-prepared NaHTe solution and changed the solution from colorless to orange. Hg2+ aqueous solution was prepared by N2-saturated aqueous solution of HgCl2, different amounts of Hg2+ aqueous solution were added into the CdTe precursor solution to form CdHgTe/CdS precursors. Typically, 0.3394 g HgCl2 were add to 100 mL of degassed water. In this experiments, CdHg(2%)Te/CdS, CdHg(5%)Te/CdS, CdHg(10%)Te/CdS, CdHg(15%)Te/CdS and CdHg(20%)Te/CdS precursor solution was prepared by added 0.2 mL, 0.5 mL, 1 mL, 1.5 mL and 2.0 mL of Hg2+ aqueous solution into 100 mL CdTe precursor solution, respectively. The color of the solution turned to dark brown or black depending on the amounts of Hg2+ aqueous solution.
:1.9:0.2. The reaction between cadmium ions and NaHTe took place immediately after injection of 2 mL as-prepared NaHTe solution and changed the solution from colorless to orange. Hg2+ aqueous solution was prepared by N2-saturated aqueous solution of HgCl2, different amounts of Hg2+ aqueous solution were added into the CdTe precursor solution to form CdHgTe/CdS precursors. Typically, 0.3394 g HgCl2 were add to 100 mL of degassed water. In this experiments, CdHg(2%)Te/CdS, CdHg(5%)Te/CdS, CdHg(10%)Te/CdS, CdHg(15%)Te/CdS and CdHg(20%)Te/CdS precursor solution was prepared by added 0.2 mL, 0.5 mL, 1 mL, 1.5 mL and 2.0 mL of Hg2+ aqueous solution into 100 mL CdTe precursor solution, respectively. The color of the solution turned to dark brown or black depending on the amounts of Hg2+ aqueous solution.
Formation and growth of the CdHgTe/CdS core–shell QDs were prepared by prompt heat control, the resultant CdHgTe/CdS precursor solution (20 mL) was transferred to the Teflon inner vessel and placed inside the microwave digestion furnace to heat by microwave irradiation located by program process the time and temperature. The temperature and time of the first process were 80 °C and 60 s, respectively. Then, the optimum temperature and time in our investigations is 120 °C and 20 min for second program process. The time between first process and second process was only 2 s. This program could design through computer of the microwave digestion/extraction system. After cooling to room temperature naturally, the prepared CdHgTe/CdS QDs solution was purified by addition of twice the volume of 2-propanol followed by centrifugation at 12000 rpm for 10 min and redispersion in ultrapure water to use in subsequent steps.
The CdHgTe/CdS/ZnS precursor solution was prepared by adding CdHgTe/CdS QDs core solution to a N2-saturated solution containing 1.25 mM Zn(OAc)2, 2.0 mM NAC and 2.0 mM Na2S. The pH was adjusted to 8.5 using 1.0 M NaOH solution and stirred for 5 min. The CdHgTe/CdS/ZnS precursor solution (20 mL) was transferred to a Teflon inner vessel to heat by microwave irradiation at 90 °C for 30 min. Various sizes of high PLQYs CdHgTe/CdS/ZnS QDs were obtained. The purification manipulations were identical to those CdHgTe/CdS QDs. The solid powder samples were obtained through freeze-drying the condensed QDs solution in a freeze drier (Christ Alpha 1-2 LD, Germany).
Characterization
The room-temperature PLQYs of the as-prepared QDs were estimated using rhodamine B (PLQY = 99%) and CY7 (PLQY = 28%) in ethanol which were freshly prepared with aim to reduce the measurement error, respectively.10 UV-vis absorption spectra were obtained using a Shimadzu UV-1601 Spectrophotometer in a 1 cm path length quartz cuvette. Fluorescence spectra were recorded on a FS 5-NIR fluorescence spectrophotometer. All optical measurements were carried out at room temperature under ambient conditions. X-ray diffraction (XRD) patterns were gained using a Bruker-Axs D8 advanced diffractometer with Cu Kα radiation. X-ray photoelectron spectroscopy (XPS) measurements were performed with a Kratos XSAM-800 apparatus using a monochromic Mg Kα source at 1253.6 eV. Transmission Electron Microscopy (TEM) and High Resolution Transmission Electronic microscopy (HRTEM) images were obtained on a JEOL model JEM 2100 with an acceleration voltage of 200 kV. The samples were prepared by drop-coating the dilute solution onto ultrathin carbon film-supported copper grids and evaporating excessive solvent. Fluorescence intensity decay curves were measured on FL 900 single-photon counting system (Edinburgh instrument). The excitation wavelength is 440 nm. The recorded decay curves were fitted with a multiexponential function deconvoluted with the system response.Stability experiments in intracellular environment
5000 Hela cells were fixed with 1 mL 75% ethanol and washed with PBS three times. Next, the cells were incubated in 1% BSA solution in PBS for 30 min at 37 °C and then in 20 μL CdHg(10%)Te/CdS/ZnS QDs (0.8 mM) for 20 min at 37 °C. After that, the cells were carefully washed with PBS three times to remove the unbound QDs. For fluorescein isothiocyanate (FITC), all manipulation was identical to those mentioned above, apart from the dose (40 μL) and concentration (16 mM) of FITC. The fixed cells stained with CdHg(10%)Te/CdS/ZnS QDs or FITC were continuously irradiated by UV excitation, respectively. The fluorescent imaging of the stained Hela cells was conducted on an Olympus IX71 inverted fluorescence microscope (Olympus Optical Co.).MTT assay
Hela cells (in DMEM medium) were cultured in 96 well plates and then were incubated up to about 24 h and grown to about 80% confluence before experiments. Then, QDs dissolved in serum-free culture medium and different concentration was added to each well to achieve a final concentration. After incubated for 30 min or 24 h, the stained cells were rinsed with PBS three times, followed by adding 20 μL stock MTT (5 mg mL−1). The cells were incubated at 37 °C for 4 h, then the supernatant was abandoned and 150 μL of DMSO was added to dissolve the purple formazan crystals and the plates were shaken for 10 min. Absorbance was measured at 490 nm using a UV-Vis spectrophotometer. Cells incubated in the absence of QDs were used as a control.Live Hela cells imaging
Hela cells were propagated in Dulbecco's Modified Eagle's Medium (DMEM) supplemented with fetal blood serum (FBS, 10%). Then the cultured cells were trypsinized and resuspended in DMEM medium at a concentration of about 5 × 10⁵ per mL. After 24 h of incubation at 37 °C in a humidified atmosphere with 5% CO2, the cells were rinsed with PBS three times, then serum-free DMEM medium containing 300 μg mL−1 CdHg(10%)Te/CdS/ZnS QDs were added and incubated for 1 h and 24 h, respectively. The stained cells were carefully rinsed three times with PBS to remove the unbound QDs before observation. The fluorescent imaging of the stained Hela cells was conducted on an Olympus IX71 inverted fluorescence microscope (Olympus Optical Co.).In vivo toxicity evaluation
Nude mice (6–7 weeks old) were randomized into test group and control group. All mice acclimated to the animal facility for at least 72 h prior to experimentation. Then CdHg(10%)Te/CdS/ZnS QDs diluted with saline buffer were intravenously injected into the tail vein of the mice, the concentration of probes was 5 mg mL−1 and the dose was 20 mg kg−1. The control group were injected normal saline under the same condition. After 14 days monitored, blood and tissues were harvested at 0, 3, 7, 10 and 14 days after injection of the CdHg(10%)Te/CdS/ZnS QDs (20 mg kg−1). Hematological data were analyzed by Mindray BC-2800Vet Auto Hematology Analyzer. Biochemical data were analyzed with Fuji Dri-Chem Clinical Chemistry Analyzer FDC 3500. Tissues were fixed in 10% formalin, embedded in paraffin, sectioned, and stained with hematoxylin and eosin. The images were obtained using an Olympus IX71 inverted fluorescence microscope (Olympus Optical Co.).In vivo tumor targeting study
To establish tumor xenografts, 3 × 10⁶ cells/0.1 mL of Hela cells were injected subcutaneously into BALB/c mice, 6–7 weeks old. Two weeks after tumor cell inoculation, subcutaneous tumor mass grew to 0.5 cm in diameter, and the mice were ready for the in vivo imaging study detailed below. Then CdHg(10%)Te/CdS/ZnS QDs (10 mg kg−1) were intravenously injected into the tail vein of the mice, after their were placed under anesthesia by injection of pentobarbital sodium. One mouse was sacrificed under anesthesia after injected QDs for 6 h through exsanguinations treatment. The heart, liver, spleen, lung, kidney and submandibular lymph node were carefully collected and removed for ex vivo images. All the in vivo images were taken with Bruker Xtreme BI in vivo imaging system (USA) with excitation at 455 nm and emission at 700–900 nm.Compliance with ethical standard
BALB/c nude mice obtained from Animal Biosafety Level-III Laboratory at the Animal Experiment Center of Wuhan University. All experiments were performed in accordance with the standards of the National Institutes of Health guide for the care and use of Laboratory animals and were approved by the Institutional Animal Care and Use Committee (IACUC) of the Center for Animal Experiment, Wuhan University (Wuhan, China). All mice acclimated to the animal facility for at least 72 h prior to experimentation. The result of experiments demonstrated that the acute toxicity of these biocompatible QDs in vivo is minimal. The mice were sacrificed under anesthesia by injection of pentobarbital sodium through exsanguinations treatment. The body were disposed legitimately by School of Basic Medical Sciences. We express our gratitude to all the animals which sacrificed for science.Results and discussion
Synthesis of CdHgTe/CdS and CdHgTe/CdS/ZnS QDs with high PLQYs
Fig. 1a displays the normalized ultraviolet photoluminescence (UV-PL) spectra for a series of CdHgTe/CdS QDs with different feed ratios of Cd2+ to Hg2+ under optimum condition. Here, CdHg(2%)Te/CdS, CdHg(5%)Te/CdS, CdHg(10%)Te/CdS, CdHg(15%)Te/CdS and CdHg(20%)Te/CdS represented the samples obtained as the Hg2+ amounts added in the solution were 2%, 5%, 10%, 15% and 20%, respectively, of the amount of Cd2+ in the CdTe precursors solution. No deep trap photoluminescence was observed, and the Stokes shift was narrow, indicating fairly good emissive properties with high PLQYs and narrow full width at half maximum (FWHM). As the molar ratios of Hg2+ to Cd2+ increased gradually, the first absorption peak and PL emission peak of CdHgTe/CdS QDs gradually shifted to longer wavelength. This also means that, the more Hg2+ added initially, the greater the amount of Hg in CdHgTe/CdS QDs.15 CdHgTe/CdS CS QDs with different quality and compositions can be prepared by controlling their nucleation and growth processes through optimization of molar ratio of reactants (Fig. S1a†), reaction temperature (Fig. S1b†), reaction time (Fig. S1c†) and pH value (Fig. S1d†).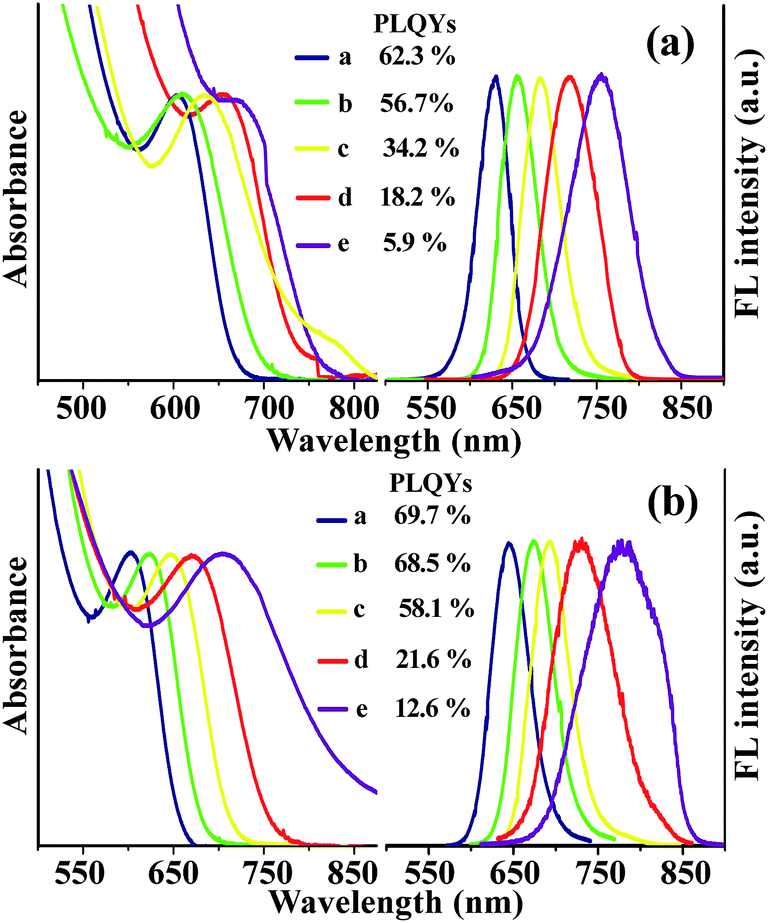 | ||
| Fig. 1 UV-PL spectra of CdHgTe/CdS QDs (a) and CdHgTe/CdS/ZnS QDs (b) with prime PLQYs. (a), (b), (c), (d) and (e) represent the samples prepared when the Hg2+ amounts corresponding to Cd2+-NAC solution were 2%, 5%, 10%, 15% and 20%, respectively. | ||
To further enhance the PLQYs and reduce the toxicity, a ZnS shell was epitaxially overcoated around the outer layer of the CdHgTe/CdS CS QDs to form the CdHgTe/CdS/ZnS CSS QDs. In Fig. 1b, a red-shift was observed for CSS QDs compared to that of CS QDs, indicating the formation of the CSS structure rather than (Cd + Hg)xZn1−xTeyS1−y alloyed structure.25 The PL intensity of CSS QDs was markedly enhanced compared with that of CS QDs, implying that the ZnS shell effectively decreased the number of defects on the surface of the CS QDs.26 If the ZnS shell was grown directly on to the surface of CdHgTe QDs, large lattice mismatch will lead to low PLQYs and broad FWHM.27 So, a CdS shell was placed as the buffer layer between the CdHgTe core and the ZnS shell in this work. It is worth mentioning, the reaction temperature played the most important role in the formation of ZnS shell on the CS QDs (Fig. S2†). As a result, a relatively low temperature (90 °C) was more suitable for the epitaxial growth of ZnS shell with high PLQYs.26–29
Characterization of CdHgTe/CdS QDs and CdHgTe/CdS/ZnS QDs
The morphology of the as-prepared CS QDs and CSS QDs with different Hg contents was studied by transmission electron microscopy (TEM) and high-resolution TEM (HRTEM) and the results were shown in Fig. 2. Owing to the presence of Hg atoms on or near their surface, the crystalline structure of these CdHgTe QDs hardly exhibited regular spherical shapes.14,30 We found that the growth of CdS or ZnS shells around CdHgTe cores not only enhanced the PLQYs but also controlled the structure of the QDs.14,31 In this case, a series of spherical shapes QDs with homogeneous size distributions was obtained. The well-resolved lattice planes in the HRTEM images verified the highly crystalline structures of the QDs. The interfacial layer was not observed between the core and shell, which is consistent with a coherent epitaxial growth mechanism and demonstrates that the shell growth does not disturb the crystalline form of the core.32 As seen from part (a) to (b) in Fig. 2, the diameter of the QDs became obvious larger after the shell's growth. Compared with CdHg(2%)Te/CdS QDs with average size of 2.1 ± 0.4 nm, CdHg(2%)Te/CdS/ZnS QDs had an increased average size of 3.1 ± 0.6 nm, indicating a thickness of 0.5 nm for the ZnS shell. The same phenomenon occurred between CdHg(20%)Te/CdS QDs and CdHg(20%)Te/CdS/ZnS QDs. Furthermore, the size distribution (Fig. S3†) between CdHg(2%)Te/CdS QDs and CdHg(20%)Te/CdS QDs was changed, as is in agreement with the results from the FWHM of the emission peaks (Fig. 1a). Importantly, the measured mean sizes of CdHg(20%)Te/CdS/ZnS QDs was only 4.1 nm, which was markedly smaller than that of CdHgTe QDs (200 nm) prepared by Tang.14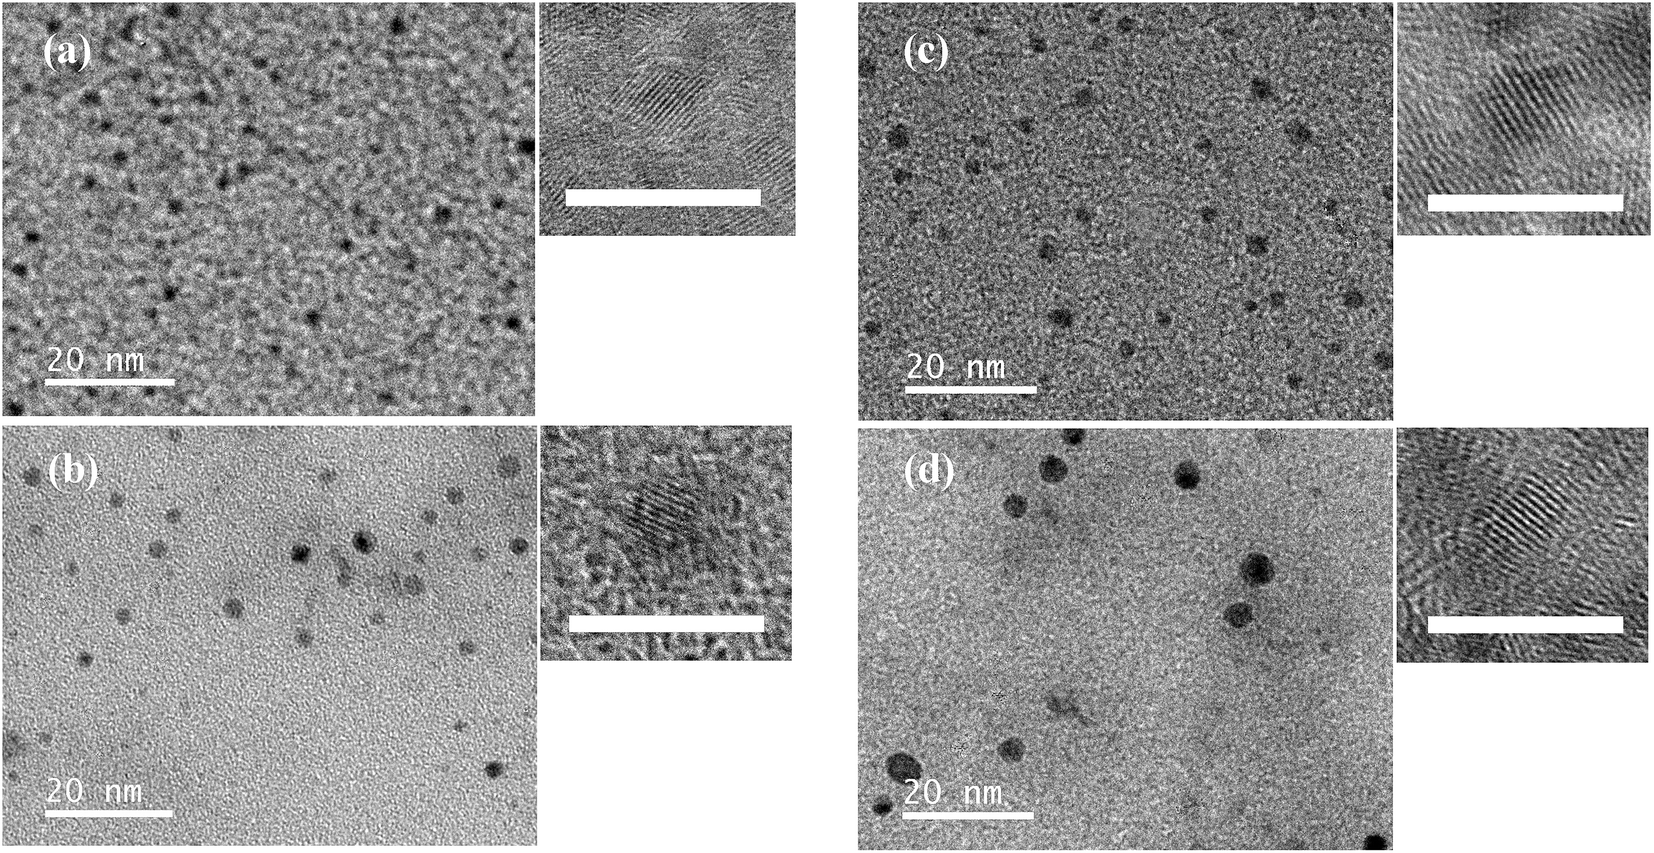 | ||
| Fig. 2 TEM and HRTEM images of CdHg(2%)Te/CdS QDs (a), CdHg(2%)Te/CdS/ZnS QDs (b), CdHg(20%)Te/CdS QDs (c), and CdHg(20%)Te/CdS/ZnS QDs (d). Scale bars are 20 nm (TEM) and 5 nm (HRTEM), respectively. | ||
To identify the presence of CdS and ZnS, the as-prepared CS QDs and CSS QDs were analyzed via Powder X-ray diffraction (XRD). Fig. 3 showed the XRD results for CdHg(10%)Te/CdS QDs and CdHg(10%)Te/CdS/ZnS QDs, respectively. For comparison, the standard XRD patterns of cubic HgTe, CdTe, CdS and ZnS were also shown (JCPDS no. 32-0665, 15-0770, 65-2887, 36-1450).14,26,33 Notably, the peaks of the CdHg(10%)Te/CdS sample better matched those of bulk CdS than those of HgTe and CdTe, indicating the formation of the CdS shell on the surface of CdHgTe QDs.26 Thus, a CdHgTe-rich core and a thick CdS shell formed. With the overgrowth of the ZnS shell, the pattern of peak widths and shapes of the two types of QDs were similar, but the position of peaks was distinctively different. The diffraction patterns of CSS QDs shifted to larger angles because of the presence of ZnS shell around the outer layer of the CdHgTe/CdS.
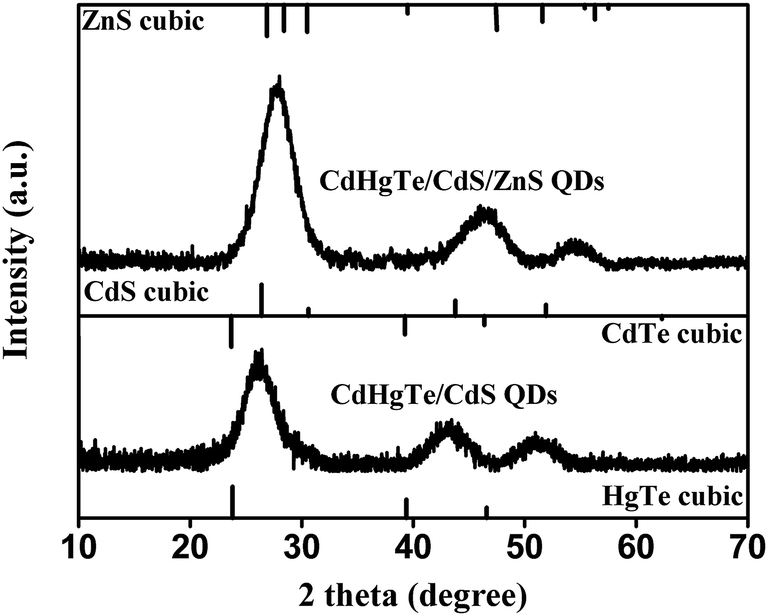 | ||
| Fig. 3 Powder X-ray diffraction (XRD) patterns of CdHg(10%)Te/CdS CS QDs and CdHg(10%)Te/CdS/ZnS CSS QDs. Standard diffraction lines of cubic HgTe, cubic CdTe, cubic CdS and cubic ZnS are also shown for comparison. | ||
Further evidence on the surface structure of QDs can be confirmed from the XPS results. As shown in Fig. 4, the elements Cd, Te, Hg, S, O and C were all detected in both CdHg(10%)Te/CdS CS QDs and CdHg(10%)Te/CdS/ZnS CSS QDs. For the CdHg(10%)Te/CdS sample, the peaks at 161.9 eV originates from S, but the position of peak in CdHg(10%)Te/CdS QDs was markedly different from that of Cd-SR in CdTe QDs (164 eV).26 Owing to the spin–orbit splitting, the S 2p spectrum presented a doublet structure corresponding to S 2p1/2 and S 2p3/2, which were separated by 1.2 eV.34 This indicated that two types of S atoms on the CS QDs can be observed. The S 2p peak of the CS QDs was fitted to one doublet with S 2p1/2 peaking at 162.7 eV and S 2p3/2 at 161.5 eV. The perfectly fitted peak showed that the NAC not only acts as chemical bonds between thiols and Cd or Hg ions on the surface of CdHgTe QDs (Cd-SR) but also acts as a free S2− source to form CdS shell on the CdHgTe core (Cd–S) as the proposed mechanisms. Given that XPS technique was employed to obtain a more quantitative picture to the surface atoms, the surface elemental S content of CSS QDs was higher than that of CS QDs. Simultaneously, the Hg 5p, Hg 4f and Te 3d levels were hardly detected in the CSS QDs, because ZnS capped the CdHg(10%)Te/CdS CS QDs. The emergence of new Zn 3p3, Zn Auger and Zn 2p peaks in the CSS QDs further validated the proposed CSS structure, in which ZnS served as the second shell epitaxially growing around the CdHg(10%)Te/CdS CS QDs.26
 | ||
| Fig. 4 Survey X-ray photoelectron spectra (XPS) of CdHg(10%)Te/CdS CS QDs (bottom) and corresponding CdHg(10%)Te/CdS/ZnS CSS QDs (top). The inset show the XPS narrow scan spectrum of S 2p spectra of CdHg(10%)Te/CdS CS QDs. | ||
There have been tremendous efforts on the study of fluorescence decays of CdTe or CdTe/CdS QDs, but few are on the CdHgTe/CdS QDs.35 Upon coating the core/shell QDs with the ZnS shell, the fluorescence decay lifetime was extended (from 21.1 ns to 28.65 ns), and the slightly nonexponential decay curve shifted to a monoexponential exciton decay (Fig. 5). The variation of the fluorescence decay lifetimes were suggested to be strongly dependent on the surface chemistry of QDs.35,36 These changes indicated that, in the presence of an extra inorganic shell, the exciton trapping at the surface defects had decreased efficiency.35,36 With the efficiently removed of the quenching defects from the CdHgTe/CdS surface, the result of the overgrowth shells provided the optimal surface conditions and high PLQYs.35,36
 | ||
| Fig. 5 Fluorescence decay curves of CdHg(10%)Te/CdS CS QDs (black) and corresponding CdHg(10%)Te/CdS/ZnS CSS QDs (red). | ||
In vitro imaging
In general, organic fluorophores easily underwent irreversible photobleaching, which resulted in fluorescence loss (Fig. S4a†). By contrast, colloidal QDs possessed a significant two-photon cross section and thus they were two to three orders of magnitude higher than that of organic fluorophores (Fig. S4†).37 Moreover, for CSS QDs, the PL intensity stabilized at about 80% of its initial value after irradiation for 1 h (Fig. S4†), indicating that the CSS structure effectively protected the core QDs not oxidized by the UV irradiation.26 In this case, the CdHgTe/CdS/ZnS QDs were selected as the ideal probe for in vitro and in vivo imaging. The QDs in the intracellular environment confirmed the viewpoint convincingly, exhibiting excellent FL intensity even after 40 min irradiation (Fig. 6a). In comparison, the fluorescent fragment of FITC was virtually invisible under only 5 min of UV irradiation at a concentration 40 times higher than that of CSS QDs. To evaluate the biocompatibility of the obtained CSS QDs, we investigated the cytotoxicity of the obtained CdHg(10%)Te/CdS/ZnS CSS QDs and the corresponding CdHg(10%)Te/CdS CS QDs to Hela cells through MTT assay (Fig. 6b), respectively. The surface properties of QDs determine their bio-interface interactions, intracellular distribution and vivo biodistributions.20,38,39 Thus, the design of the surface of QDs can introduce additional functions. As a therapeutic drug and antioxidant, NAC can effectively prevent ROS generation during photo-irradiation and surface oxides.20,39,40 More importantly, the components of QDs, such as Cd or Hg, are toxic to cells. However, these harmful effects can be prevented especially when multiple shells around the QDs are stable and biocompatible.26,41 | ||
| Fig. 6 (a) Comparison of the photostability of FITC and CdHg(10%)Te/CdS/ZnS QDs upon staining of fixed Hela cells. Scale bars are 50 μm. (b) Cytotoxicity of different concentrations of CdHg(10%)Te/CdS QDs and CdHg(10%)Te/CdS/ZnS QDs in Hela cells. (c) Fluorescence microscopy images from live Hela cells labelled with CdHg(10%)Te/CdS/ZnS QDs after 1 h (top) and 24 h (bottom) incubation, respectively. Scale bars are 20 μm. | ||
Up to now, there have been few studies on the direct application of NAC capped NIR-emitting CdHgTe/CdS/ZnS QDs in aqueous solution. As shown in Fig. 6c, the stained Hela cells showed red profile after 1 h of incubation, and most of QDs were distributed within the cytoplasmic compartment of Hela cells. After 24 h incubation, the as-prepared QDs were distributed not only within the cytoplasmic compartment of Hela cells but also in the nuclear compartment. This result indicated that the as-prepared CSS QDs are sufficiently small to enter the cell nucleus through the nuclear pore complexes.16,42 Meanwhile, most of the cells retained their shapes after 24 h of incubation, indicating that the entered QDs presented no apparent toxicity to the labelled cells.18–20 Su et al. considered that the CdTe QDs produced more severe cytotoxicity than CdCl2 solutions despite the same concentrations of the intracellular Cd2+ ions concentrations, implying that ROS is more noxious for cells than heavy metal.20 Fortunately, NAC effectively prevent ROS which generate from photo-irradiation and surface oxide.43 In this case, the protective ZnS shells and the antioxidant drug (NAC) are the main reasons for the high stability and biocompatibility in living cells.
In vivo imaging
In this paper, we observed the process in which the high PLQYs NIR-emitting CSS QDs as a detector circulate in the body of mammal (nude mice) through the blood stream and then send a conspicuous signal to the outside world. Prior to in vivo studies, the acute toxicity of the QDs in nude mice was assessed. We chose 20 mg kg−1 as the test concentration, which was 4 times higher as compared to Prasad et al.'s report.44 The fluctuation in body weight is a useful indicator to study the toxicity effects of QDs.44 After two weeks of evaluation, no difference in body weight change curves was observed between the text and control group, indicating the low toxicity of the CSS QDs in vivo (Fig. 7). This was much different from the result of Chen et al.'s report, in which the mice died within several hours after being injected with 14 mg kg−1 of CdHgTe formulations.45 More importantly, histological analysis was also performed on the tissues obtained from the major organs such as heart, liver, spleen, lung and kidney (Fig. 8). Tissues were harvested at different time points after the injection of the CSS QDs to mice. Analysis was performed by a pathologist. No apparent histopathological abnormality or lesion related to treatment were observed in mice receiving CSS QDs. This finding contradicted those of Singh et al.'s result, who reported reversible changes in major organs.9 Reports have suggested that degradation of QD surface coatings may induce changes in hematological indicators such as white blood cell count. The CSS QDs, which was coated with biocompatible ligand, did not induce the inflammatory response (Fig. S5†). We further analyzed several major blood enzyme concentrations to assess liver and kidney function (Fig. S6†). Results suggested that there was no significant toxicity compared to control animals and reflected normal variation present in populations of animals.22,24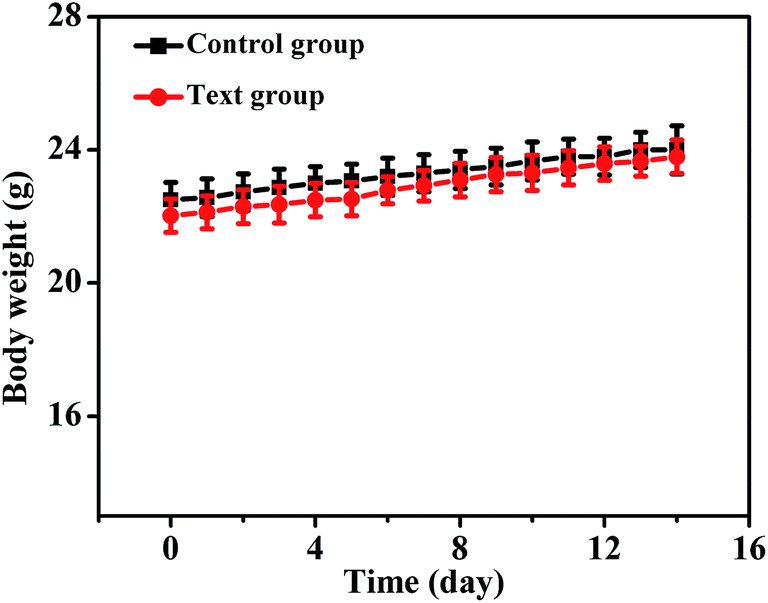 | ||
| Fig. 7 Weights of mice were recorded after injection of the CdHgTe/CdS/ZnS QDs through tail vein. | ||
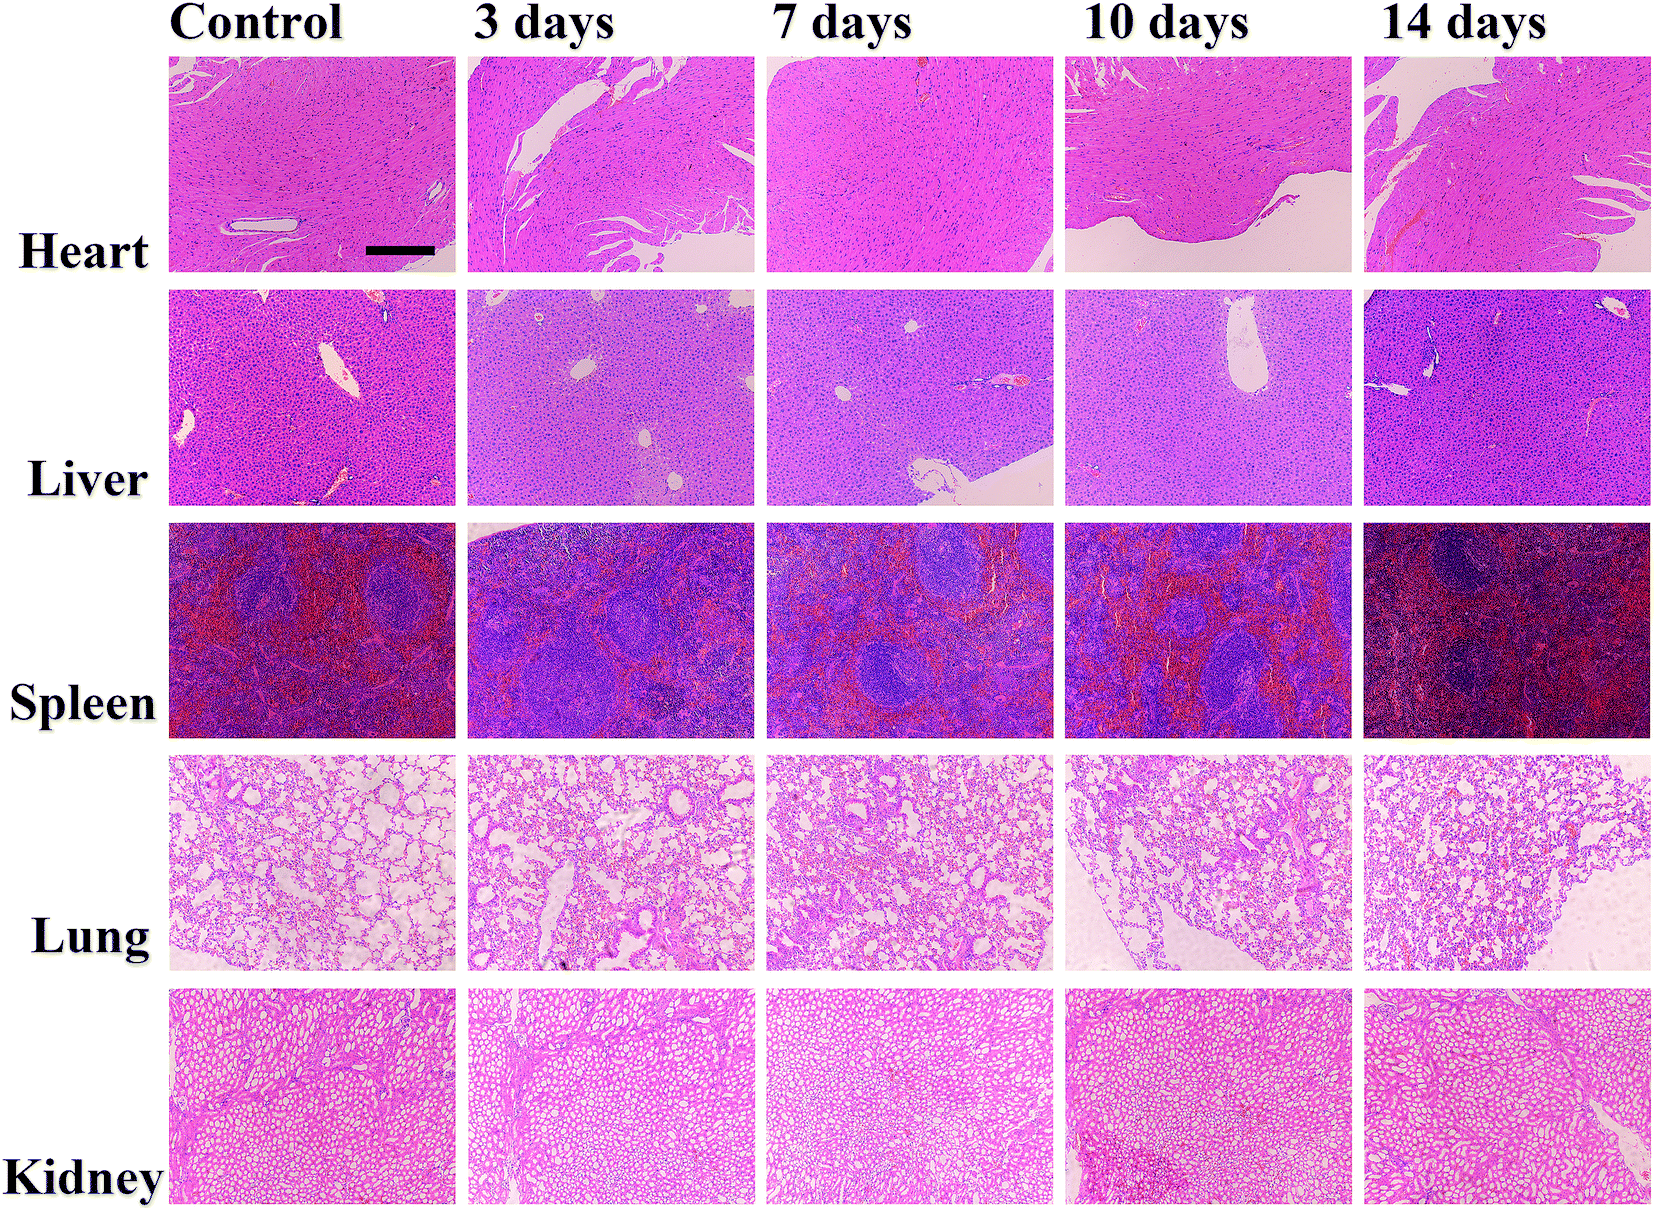 | ||
| Fig. 8 Histological studies on the major organs of the CdHgTe/CdS/ZnS QDs injected mice after 0, 3, 7, 10 and 14 days. Scale bars are 200 μm, respectively. | ||
Given that biological autofluorescence background is minimized and penetration of excitation and emission light through tissues is increased by using the NIR-emitting QDs, the NAC capped QDs effectively prevent reticuloendothelial system uptake in vivo and further improve bioimaging efficiency.1 As we can see from Fig. 9c, the tumor was identified distinctly during only 2 h of blood circulation. This phenomenon attributed to three reasons: first, the ultra-small NIR QDs (below 5 nm) can migrate faster and step in tissue more easily. Second, high PLQYs further improved bioimaging sensitivity. Third, the ligands NAC further improved the biocompatibility with its antioxidant and anti-inflammatory effects.1,21,35 Similar to the in vitro imaging nonspecific adsorption of cells, such passive targeting is useful to tumor tissues too. The non-targeted QDs can accumulate within tumor cells through the enhanced permeability and retention (EPR) effect.1 Although nanoparticle accumulation is more difficult to maximize through the retention effect than through active targeting, the conjugation of QDs with targeting small molecules (e.g. folic acid and hyaluronic acid) interferes with the optical properties and changes natural selectivity.1,2,10,40 By virtue of the leaky nature of tumor blood vessels, the QDs showed excellent accumulation in the tumor for 4 h. After the injection of QDs for 6 h, the fluorescence signal of the tumor tissue decreased, suggesting that the QDs inside the body were metabolized.1,2,10,40 One mouse was sacrificed after injected QDs for 6 h through euthanasia. The fluorescence of the submandibular lymph node was evident (Fig. 9h). This finding is crucial in various clinical settings.11 The images of ex vivo heart, liver, spleen, lung and kidney are shown in Fig. 9h. The accumulation in spleen and liver suggested that some parts of the QDs were metabolized through the biliary pathway.1,2,10 By contrast, the FL intensity of the kidney was markedly stronger than those of other organs, indicating that renal clearance is the major elimination pathways for these ultra-small QDs.46,47
 | ||
| Fig. 9 In vivo tumor targeting of the NIR QDs. Spectrally unmixed in vivo fluorescence images of liver-tumor-bearing nude mouse at (a) 0 h, (b) 0.5 h, (c) 2 h, (d) 6 h, (e) 8 h, (f) 12 h. (g) Representative image from the same tumor-bearing mouse by white light. (h) Fluorescence image of ex vivo heart, liver, spleen, lung, kidney and submandibular lymph node after injected QDs for 6 h. | ||
Conclusion
In this study, we described the one-pot aqueous synthesis of NIR-emitting core/shell CdHgTe/CdS QDs with ultra-small sizes and high PLQYs. By varying the feed ratios of Cd2+ to Hg2+ and the thickness of the CdS shell, the emission wavelength of CdHgTe/CdS QDs can span from 635 to 756 nm. The ZnS shell grown epitaxially around the core/shell QDs considerably improved the stability and PL intensity both in the aqueous solutions and in the intracellular environment. The results of TEM and HRTEM verified the regular spherical shapes and homogeneous size distributions of the QDs. Further evidence from the XRD and XPS confirmed the presence of core/shell/shell structure. Owing to the antioxidant ligand NAC and the designed core/shell/shell structure, the entered QDs presented no obvious toxicity to the labelled cells and exhibited bright red fluorescence. To further study their potential toxicity in vivo applications, we performed toxicity measurement for 14 days after QDs injection. The results showed that the programmed NIR QDs caused negligible harmful effects to the nude mice even at the concentration of 20 mg kg−1. Furthermore, the NAC capped QDs accumulated within the tumor cells through passive targeting within 2 h of blood circulation. Unexpectedly, the entered QDs were metabolized through the lymphatic drainage because of their ultra-small sizes and excellent stability. Thus, the QDs have potential applications as fluorescent labels for long-term diagnostics and therapy.Acknowledgements
We acknowledge the financial support from the National Natural Science Foundation of China (20577036, 20777058, 20977070, 81471789) and the National High Technology Research and Development Program of China (863 program, No. 2007AA06Z418). We express our gratitude to Prof. Yun Chen and Dr Yanteng Zhao (Department of Biomedical Engineering, School of Basic Medical Sciences, Wuhan University), respectively, for technical help.References
- Z. Li, Q. Sun, Y. Zhu, B. Tan, Z. P. Xu and S. X. Dou, J. Mater. Chem. B, 2014, 2, 2793–2818 RSC.
- H. Kobayashi, M. Ogawa, R. Alford, P. L. Choyke and Y. Urano, Chem. Rev., 2010, 110, 2620–2640 CrossRef CAS PubMed.
- M. Bruchez Jr, M. Moronne, P. Gin, S. Weiss and A. P. Alivisatos, Science, 1998, 281, 2013–2016 CrossRef CAS.
- W. C. Chan, D. J. Maxwell, X. Gao, R. E. Bailey, M. Han and S. Nie, Curr. Opin. Biotechnol., 2002, 13, 40–46 CrossRef CAS PubMed.
- G. Rousserie, A. Sukhanova, K. E. Desrumeaux, F. Fleury, P. Chames, D. Baty, V. Oleinikov, M. Pluot, J. H. M. Cohen and I. Nabiev, Crit. Rev. Oncol. Hemal., 2010, 74, 1–15 CrossRef PubMed.
- A. L. Rogach, A. Eychmüller, S. G. Hickey and S. V. Kershaw, Small, 2007, 3, 536–557 CrossRef CAS PubMed.
- X. J. Liu, Q. L. Ren, F. F. Fu, R. J. Zou, Q. Wang, G. B. Xin, Z. Y. Xiao, X. J. Huang, Q. Liu and J. Q. Hu, Dalton Trans., 2015, 44, 10343–10351 RSC.
- R. G. Aswathy, Y. Yoshida, T. Maekawa and D. S. Kumar, Anal. Bioanal. Chem., 2010, 397, 1417–1435 CrossRef CAS PubMed.
- N. Singh, S. Charan, K. Sanjiv, S. H. Huang, Y. C. Hsiao, C. W. Kuo, F. C. Chien, T. C. Lee and P. Chen, Bioconjugate Chem., 2012, 23, 421–430 CrossRef CAS PubMed.
- Y. He, Y. L. Zhong, Y. Y. Su, Y. M. Lu, Z. Y. Jiang, F. Peng, T. T. Xu, S. Su, Q. Huang, C. H. Fan and S. T. Lee, Angew. Chem., Int. Ed., 2011, 50, 5695–5698 CrossRef CAS PubMed.
- S. Kim, Y. T. Lim, E. G. Soltesz, A. M. D. Grand, J. Lee, A. Nakayama, J. A. Parker, T. Mihaljevic, R. G. Laurence, D. M. Dor, L. H. Cohn, M. G. Bawendi and J. V. Frangioni, Nat. Biotechnol., 2004, 22, 93–97 CrossRef CAS PubMed.
- W. J. Zhang, G. J. Chen, J. Wang, B. C. Ye and X. H. Zhong, Inorg. Chem., 2009, 48, 9723–9731 CrossRef CAS PubMed.
- S. Leubner, R. Schneider, A. Dubavik, S. Hatami, N. Gaponik, U. Resch-Genger and A. Eychmüller, J. Mater. Chem. C, 2014, 2, 5011–5018 RSC.
- B. Tang, F. Yang, Y. Lin, L. H. Zhuo, J. C. Ge and L. H. Cao, Chem. Mater., 2007, 19, 1212–1214 CrossRef CAS.
- W. J. Cai, L. M. Jiang, D. M. Yi, H. Z. Sun, H. T. Wei, H. Zhang, H. C. Sun and B. Yang, Langmuir, 2013, 29, 4119–4127 CrossRef CAS PubMed.
- H. J. Zhan, P. J. Zhou, Z. Y. He and Y. Tian, Eur. J. Inorg. Chem., 2012, 15, 2487–2493 CrossRef.
- Y. He, H. T. Lu, L. M. Sai, W. Y. Lai, Q. L. Fan, L. H. Wang and W. Huang, J. Phys. Chem. B, 2006, 110, 13352–13356 CrossRef CAS PubMed.
- Y. Y. Su, Y. He, H. T. Lu, L. M. Sai, Q. N. Li, W. X. Li, L. H. Wang, P. P. Shen, Q. Huang and C. H. Fan, Biomaterials, 2009, 30, 19–25 CrossRef CAS PubMed.
- Y. Y. Su, M. Hu, C. H. Fan, Y. He, Q. N. Li, W. X. Li, L. H. Wang, P. P. Shen and Q. Huang, Biomaterials, 2010, 31, 4829–4834 CrossRef CAS PubMed.
- Y. Y. Su, F. Peng, Z. Y. Jiang, Y. L. Zhong, Y. M. Lu, X. X. Jiang, Q. Huang, C. H. Fan, S. T. Lee and Y. He, Biomaterials, 2011, 32, 5855–5862 CrossRef CAS PubMed.
- S. D. Flora, A. Izzotti, F. D'Agostini and R. M. Balansky, Carcinogenesis, 2001, 22, 999–1013 CrossRef PubMed.
- H. S. Choi, W. Liu, P. Misra, E. Tanaka, J. P. Zimmer, B. I. Ipe, M. G. Bawendi and J. V. Frangioni, Nat. Biotechnol., 2007, 25, 1165–1170 CrossRef CAS PubMed.
- H. S. Choi, B. I. Ipe, P. Misra, J. H. Lee, M. G. Bawendi and J. V. Frangioni, Nano Lett., 2009, 9, 2354–2359 CrossRef CAS PubMed.
- T. S. Hauck, R. E. Anderson, H. C. Fischer, S. Newbigging and W. C. W. Chan, Small, 2010, 6, 138–144 CrossRef CAS PubMed.
- D. C. Pan, Q. Wang, S. C. Jiang, X. L. Ji and L. J. An, Adv. Mater., 2005, 17, 176–180 CrossRef.
- Y. He, H. T. Lu, L. M. Sai, Y. Y Su, M. Hu, C. H. Fan, W. Huang and L. H. Wang, Adv. Mater., 2008, 20, 3416–3421 CrossRef CAS.
- D. V. Talapin, I. Mekis, S. Gotzinger, A. Kornowski, O. Benson and H. Weller, J. Phys. Chem. B, 2004, 108, 18826–18831 CrossRef CAS.
- S. Raj, R. Khan, I. H. Lee, K. U. Jeong and Y. T. Yu, RSC Adv., 2016, 6, 95032–95037 RSC.
- F. Aldeek, L. Balan, G. Medjahdi, T. Roques-Carmes, J. P. Malval, C. Mustin, J. Ghanbaja and R. Schneider, J. Phys. Chem. C, 2009, 113, 19458–19467 CAS.
- S. Taniguchi, M. Green and T. Lim, J. Am. Chem. Soc., 2011, 133, 3328–3331 CrossRef CAS PubMed.
- A. L. Rogach, M. T. Harrison, S. V. Kershaw, A. Kornowski, M. G. Burt, A. Eychmüller and H. Weller, Phys. Status Solidi B, 2001, 224, 153–158 CrossRef CAS.
- Y. He, H. T. Lu, L. M. Sai, W. Y. Lai, Q. L. Fan, L. H. Wang and W. Huang, J. Phys. Chem. B, 2006, 110, 13370–13374 CrossRef CAS PubMed.
- V. Lesnyak, A. Lutich, N. Gaponik, M. Grabolle, A. Plotnikov, U. Resch-Genger and A. Eychmüller, J. Mater. Chem., 2009, 19, 9147–9152 RSC.
- H. B. Bao, Y. J. Gong, Z. Li and M. Y. Gao, Chem. Mater., 2004, 16, 3853–3859 CrossRef CAS.
- D. Zhao, Z. K. He, W. H. Chan and M. M. F. Choi, J. Phys. Chem. C, 2009, 113, 1293–1300 CAS.
- Q. Zeng, X. Kong, Y. Sun, Y. Zhang, L. Tu, J. Zhao and H. Zhang, J. Phys. Chem. C, 2008, 112, 8587–8593 CAS.
- D. R. Larson, W. R. Zipfel, R. M. Williams, S. W. Clark, M. P. Bruchez, F. W. Wise and W. W. Webb, Science, 2003, 300, 1434–1436 CrossRef CAS PubMed.
- Q. Ma and X. G. Su, Analyst, 2010, 135, 1867–1877 RSC.
- W. Y. Mao, J. Guo, W. L. Yang, C. C. Wang, J. He and J. Y. Chen, Nanotechnology, 2007, 18, 485611–485618 CrossRef.
- B. Xue, D. W. Deng, J. Cao, F. Liu, X. Li, W. Akers, S. Achilefu and Y. Q. Gu, Dalton Trans., 2012, 41, 4935–4947 RSC.
- P. Reiss, M. Protière and L. Li, Small, 2009, 5, 154–168 CrossRef CAS PubMed.
- J. Lovrić, H. S. Bazzi, Y. Cuie, G. R. A. Fortin, F. M. Winnik and D. Maysinger, J. Mol. Med., 2005, 83, 377–385 CrossRef PubMed.
- A. O. Choi, S. J. Cho, J. Desbarats, J. Lovrić and D. J. Maysinger, J. Nanobiotechnol., 2007, 5, 1–13 CrossRef PubMed.
- W. C. Law, K. T. Yong, I. Roy, H. Ding, R. Hu, W. W. Zhao and P. N. Prasad, Small, 2009, 11, 1302–1310 CrossRef PubMed.
- H. Y. Chen, Y. Q. Wang, J. Xu, J. Z. Ji, J. Zhang, Y. Z. Hu and Y. Q. Gu, J. Fluoresc., 2008, 18, 801–811 CrossRef CAS PubMed.
- C. Liu, Z. Gao, J. Zeng, Y. Hou, F. Fang, Y. Li, R. Qiao, L. Shen, H. Lei, W. Yang and M. Gao, ACS Nano, 2013, 7, 7227–7240 CrossRef CAS PubMed.
- Y. Yang, T. Zhao, T. Cheng, J. Shen, X. Liu, B. Yu, S. Lv and H. Zhang, RSC Adv., 2014, 4, 5642–5648 RSC.
Footnote |
| † Electronic supplementary information (ESI) available. See DOI: 10.1039/c7ra02403g |
| This journal is © The Royal Society of Chemistry 2017 |