
 Open Access Article
 This Open Access Article is licensed under a
 Creative Commons Attribution 3.0 Unported Licence
Distinctive oil shale pyrolysis behavior in indirectly heated fixed bed with internals
Lanxin Linab,
Dengguo Laiab,
Zhen Shiab,
Zhennan Hanab and
Guangwen Xu *ac
*ac
aState Key Laboratory of Multi-Phase Complex Systems, Institute of Process Engineering, Chinese Academy of Sciences, Beijing 100190, China. E-mail: gwxu@ipe.ac.cn; Fax: +86 10 82629912; Tel: +86 10 82544886
bUniversity of Chinese Academy of Sciences, Beijing 100049, China
cInstitute of Industrial Chemistry and Energy Technology, Shenyang University of Chemical Technology, Shenyang 110142, China
First published on 18th April 2017
Abstract
Intrinsic characteristics of oil shale pyrolysis in a fixed bed reactor with internals have been investigated in this study. Mounting particularly designed internals in fixed bed reactor improved shale oil production to up to 90% yield by Fischer assay. Comparing particle characteristics at different radial positions of the reactors with and without internals demonstrated that, inside the particle bed with internals, the product flow was regulated to move from the high-temperature zone (outer) to low-temperature zone (center), which reduced the secondary reactions of released volatiles. Terminating oil shale pyrolysis at central particle bed temperatures of 150, 300, 450, and 550 °C showed that the contents of vacuum gas oil and heavy oil in the shale oil produced had increased from 9.63 wt% to 53.29 wt%. The volatile contents of particles in the inner layer of the reactor slightly increased in the early stage of pyrolysis and, in turn, decomposed to form pyrolysis products as the temperature was raised. The adsorption or condensation of liquids on the surface of particles gradually increased from the outer region to the central region of the reactor due to the regulated product flow direction and low temperatures in the central zone of the reactor causing heavy components to condense. Increasing the degree of pyrolysis was also found to decrease the alkene, aromatic, and cycloalkane contents in shale oil, but increased those of alkane and heteroatomic compounds. These results demonstrate that adopting internals into oil shale pyrolysis optimized the product flow direction and selectively directed secondary reactions to occur for heavy volatile species only.
1. Introduction
Alternative and renewable energy sources have received increasing attention in recent years as fossil fuel consumption has grown. Oil shale is among the most promising alternative energy sources because of its enormous reserves and plentiful aliphatic organic compounds.1 Available oil shale utilization patterns have been established in several countries since the 1960s. Combusting oil shale to generate power could supply domestic industrial users, with retorted shale oil considered a potential resource to offset the future crude oil scarcity. The utilization of retorted shale oil requires a comprehensive utilization mode, as reported by many studies.2–6Several representative oil shale retorting processes have been developed and are still in service, such as in situ underground retorting and Tosco-II technology in the USA, the Kiviter process in Estonia, the Petrosix process in Brazil, the Galoter process in Russia, Enefit-280 technology in Germany and Estonia, the Alberta Taciuk process (ATP) in Australia and Canada, the Lurgi–Ruhrgas process in Germany, and the Fushun process in China.4–9 Of these, Tosco-II, Galoter, Enefit-280, ATP, and Lurgi–Ruhrgas processes adopt a solid heat carrier method to heat oil shale particles and achieve relatively high oil yields. However, the resultant liquid products usually exhibit high dust intake due to inherent technical defects. Many studies on oil-dust characteristics and separation have been conducted, but a comprehensive solution for the dust-intake problem in pyrolysis had yet to be developed.10 Gas heat carrier retorting technology is employed in the Petrosix, Kiviter, and Fushun retorting processes. However, these methods only process large-particle feedstock. Excessive air pumped into a Funshun furnace causes oil combustion in the pyrolysis stage, lowering the shale oil yield to 65% by Fischer assay. Process analysis is applied to optimize operating parameters and improve oil production efficiency.11 An in situ retorting process has been proposed for deeply buried oil shale, but this technology requires long-term verification for application.4 Therefore, no existing retorting processes provide satisfactory pyrolysis performance for oil shale, especially for particle sizes below 10 mm. In particular, innovative retorting technologies are required for small oil shale particles to achieve high oil yield and quality simultaneously.
Particularly designed internals, comprising a central gas collection pipe and a number of metallic plates, have been employed to improve oil shale pyrolysis production in indirectly heated fixed bed reactors.12–14 An innovative reactor with internals was evaluated by comparing the heating rate of oil shale particles and pyrolysis product distribution. With the heating rate to particles improved, especially in the central region, the resultant shale oil yield was afforded in 90% oil yield by Fischer assay. Raising the reactor temperature from 600 °C to 1000 °C benefited shale oil production, which was in contrast to almost all other reports in the area, which show higher pyrolysis temperatures lead to lower oil yield. In conventional indirectly heated fixed bed reactors, it is generally difficult to achieve high oil yields at high reaction temperatures due to unavoidable significant secondary reactions of volatiles.15–18 In contrast, devised internals can reduce cracking in the reactor to achieve a higher shale oil yield at higher heating or reaction temperatures. Matching the product flow field with temperature distribution in the reactor using internals has been speculated to avoid excessive cracking of primary products and improved pyrolysis production. Therefore, further understanding of the detailed pyrolysis characteristics of the new reactor and its superiority are required to guide industrial applications of the technology.
Many studies have focused on the behavior and kinetics of oil shale pyrolysis, which are needed for reasonable analysis and optimization guidance.15–22 Al-Ayed et al. adopted second-order kinetics to model liquid accumulation15 and first-order kinetics to fit the total weight loss of oil shale in a fixed bed.16 In contrast, various parameters, such as heating rate, final temperature, particle size, density, and additional minerals, have been investigated to clarify their effects on oil shale pyrolysis at various scales.22–32 A heating rate of 10 °C min−1 for oil shale particles is optimal for obtaining a high oil yield.26–29 The internals adopted in the preceding reactor gave an obvious improvement on heating rate.12–14 Nonetheless, this improvement was not as effective at altering pyrolysis behavior in indirectly heated reactors.12,13 Lan et al. obtained a maximal shale oil yield at a reaction-stopping temperature of 550 °C.30 Lai et al. demonstrated that the oil yield decreased with increasing temperature by conducting an oil shale pyrolysis series with and without ash.31 Zhang et al. investigated the impact of residence time on the pyrolysis product in a fluidized bed.33 These studies were all performed in reactors without the aforementioned internals.34 Pyrolysis behavior in fixed bed reactors with internals and the working mechanism of internals have yet to be reported. Therefore, a targeted fundamental investigation of oil shale pyrolysis in this innovative fixed bed reactor with internals was conducted in this study.
2. Experimental section
2.1 Materials and apparatus
Oil shale was obtained from Huadian oil shale mine, and was sieved to a particle size of 0–5 mm for use in experiments. The properties of Huadian oil shale are shown in Table 1. The dry-base oil content was 12.78 wt% by Fischer Assay. Silica sand (1–2 mm) was used in the study to replace a portion of the oil shale particles, which had been pretreated at 900 °C for 3 h.A conventional fixed bed reactor without internals was used as reference in this work. The pyrolysis investigation was conducted in a reactor mounted with a central collection pipe and four metallic plates. The plates were welded perpendicular to the fixed bed reactor wall. Fig. 1 shows schematic diagrams of the two reactors used. The reactors had an inner diameter of 200 mm, and effective volumes for loading oil shale of around 5600 mL. From the wall to the center of the reactor (Fig. 1), both reactors were demarcated into three layers (a–c) in a radial direction. Three temperature measurement points were present in layers a–c to record real-time heating curves inside these layers. The experimental system was the same as used in our previous work,14 consisting of four parts: pyrolysis, liquid collection, pressure control, and gas sampling.
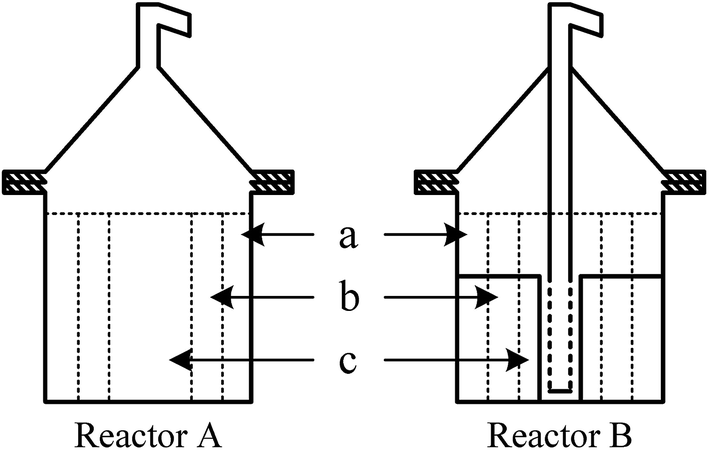 | ||
| Fig. 1 Schematic illustrations of particle layers a–c in reactors A and B. | ||
2.2 Pyrolysis and analysis
The furnace was heated to 850 °C and held until the pyrolysis test was completed. For each individual experiment, dried Huadian oil shale (4900 g) was loaded into the test reactor. In some tests, the oil shale particles in the outboard layer were replaced with silica sand of equal volume. After connecting to the experimental system, the reactors were placed into the heated furnace and quickly covered with silica wool. The pressure in the reactor was maintained at 1 atm using a vacuum pump. Pyrolysis products were exhausted from the top of the reactor and cooled in a downstream condenser pipe. The cooled liquid product was collected in a bottle. Residual low-boiling components in the gaseous product were adsorbed using three acetone bottles. The pyrolysis gas was then passed through a wet gas meter to measure the volume and then successive through a few clean bottles to remove dust, moisture, and hydrogen sulfide. Every 5 min, a gas sample was taken for compositional analysis by GC. When the central temperature measurement point reached 150 °C, 300 °C, 450 °C, and 550 °C, the reactor was removed from the furnace to terminate pyrolysis and the reactor was cooled in air.Subsequent product treatment was conducted for all pyrolysis experiments conducted at central temperatures of 150 °C, 300 °C, 450 °C and 550 °C. All yields were given relative to the dry mass of treated oil shale.
After cooling to room temperature, oil shale char from the three layers (a–c in Fig. 1) was sampled for further analysis. Accordingly, the char samples were denoted a–c. The char yield was calculated from the product weight relative to the mass of loaded oil shale. Condensate (or adsorbate) on 1.0 mL char, sieved to 0.2–1.0 mm, was dissolved (with the char) in 50 mL petroleum ether (boiling range: 90–110 °C, AR). The obtained solution was scanned using an ultraviolet spectrophotometer (TU-1901) at 1 nm s−1. Char samples were smashed to a powder below 0.1 mm in size for proximate analysis.
Liquid from the scrubbing bottles was mixed with the acetone solutions from the washing pipelines and vessels, and rotary evaporation was performed to remove acetone. The resultant residual liquid was blended with shale oil in the liquid collection bottle of the condenser. Intake water in the blended liquid was first separated by oil-water delamination, and the remaining moisture in the oil phase was measured by a standard method using toluene as an azeotrope. This allowed the water and oil yields to be estimated. The dehydrated shale oils collected from different central temperatures at termination (150, 300, 450, and 550 °C) were analyzed to obtain the distributions of distillation fractions according to boiling points. A GC 7890A instrument (Agilent) was employed to perform simulated distillation fraction analysis. The chemical compositions of the four oil samples were determined using a GC-MS QP 2010 Ultra instrument (Shimadzu). All analytical methods used for shale oil in this study have been detailed in our previous work.13,14 The pyrolysis gas yield was calculated from the measured gas volume (in a gas meter) and the gas composition was obtained using a micro GC (Agilent 3000A).
3. Results and discussion
3.1 Temperature distribution
Particularly designed internals have been successfully applied to improve the oil yield and heating efficiency in an indirectly heated fixed bed reactor in our previous work.12–14 Taking the heating curve at or near the reactor center to characterize the heating efficiency of the particle (oil shale) bed in the reactor showed that the heating rate of the particles at the measured positions was nearly doubled when using internals. Three temperature measurement points in layers a–c were recorded to capture the real-time temperature distribution in the tested reactors with or without internals.Fig. 2 compares the heating curves for oil shale in the layers a–c. The heating furnace temperature for the tests was 800 °C. Overall, reactor B, which had internals, gave a much shorter heating time than reactor A to reach a temperature of 550 °C at the measured bed center. This implied faster heating in the reactor with internals, in agreement with our previous studies.12–14 Fig. 2 also shows that the difference between the heating curves of the two reactors was largest in layer c and smallest in layer a. This meant that the internals mainly facilitated heating to particles in the inner (core) bed.
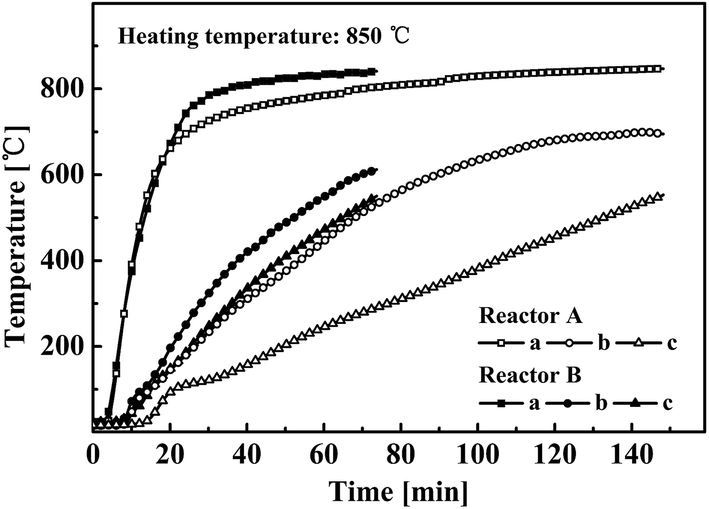 | ||
| Fig. 2 Heating curves for layers a–c in reactors with and without internals. | ||
Layer a, nearest the reactor wall, was quickly heated to 700 °C in 20 min, and subsequently exceeded 800 °C. This formed a high-temperature zone in layer a in the early stage of the experiment, resulting in fast oil shale pyrolysis. At this stage the temperatures in layers b and c were below 200 °C, which were too low to give oil shale pyrolysis. There was little difference between the two reactors in the initial (first 10 min) temperature rise characteristics from outboard layer a to central layer c.
As the experiment continued, the heating rates of layers b and c in reactor B (with internals) gradually became higher than those in reactor A. The average heating rate of oil shale in layer c was 4 °C min−1 in reactor A, but was elevated to about 10 °C min−1 in reactor B.26–29 The devised internals enhanced heating by aligning the field of temperature, from high to low, with the flow direction.12–14 The central gas collection pipe guided the high-temperature gaseous products to flow from the outboard to the central zone, with heat taken from the gas contributing to heating of the core bed.12,13 Meanwhile, the metallic plates added extra heating surfaces to promote heat transfer from the reactor wall to the particle bed.14 At the end of the test, layer b in reactor A has been heated to a higher temperature than that in reactor B, indicating that a higher temperature area had been created inside reactor A. Therefore, the employed internals greatly improved heating efficiency from the bed wall to the center and altered the temperature gradient in the bed.
3.2 In-bed product flow direction
A decreasing temperature gradient is present from the outboard to the center of an indirectly heated fixed bed reactor. This gradient has a critical impact on the in-bed secondary reactions of pyrolysis products. If the products flowed through the high-temperature outboard, excessive product cracking would occur. In contrast, secondary reactions are likely to be weak in the reactor center. Herein, the product flow direction in the reactors with and without internals was clarified to obtain better understanding of the system.A char bed gives a smaller pressure drop than an oil shale bed of the same thickness.13 As pyrolysis progresses in an indirectly heated fixed bed, a char layer is formed on the outboard or annulus, causing the gaseous pyrolysis products to flow toward the reactor wall. The pyrolysis products must undergo a large amount of secondary reactions in the outboard zone to greatly decrease shale oil production. The internals potentially reduce this problem by redirecting the flow of pyrolysis products into the pyrolysis reactor.12–14 Silica sand (1.0–2.0 mm) has better gas permeability than oil shale. Therefore, silica sand was used to imitate char by replacing oil shale particles with silica sand in the outer layer of the reactor. This also ensured that no chemical change would occur in the sand layer, while volatile products were only generated by pyrolyzing oil shale in the central zone. Observing the color change of the silica sand allowed the flow direction of volatiles formed in the bed center to be determined.
Fig. 3 shows top-down photos inside the beds after pyrolysis tests in reactors (A) without and (B) with internals. The outer layer filled with silica sand had obviously different colors. Sand particles were blackened in reactor A, also having a deeper color at inner positions close to the central oil shale layer. This was caused by the deposition of unreacted matters, including carbon, formed from pyrolysis. Therefore, without mounting internals in reactor A, the pyrolysis products flowed outwards toward the reactor wall. In contrast, Fig. 3 shows that the loaded silica sand remained white in reactor B with internals, demonstrating that the generated pyrolysis products did not flow into the outer region next to the reactor wall. This verified that the use of particularly designed internals in a fixed bed pyrolyzer resulted in the internal flow of pyrolysis products from the wall zone to the central zone around the gas collection pipe.
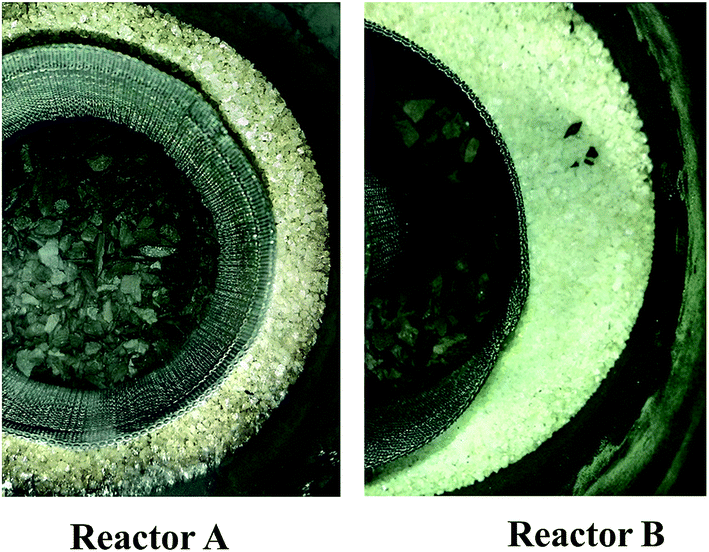 | ||
| Fig. 3 Evidence of secondary cracking through color change on particles in the vicinity of the reactor wall for reactors A and B. | ||
Samples of oil shale or char were taken from layers a–c at different reaction stages or reaction times and analyzed to further understand the product flow direction in reactor B with internals. Table 2 summarizes the results of proximate analysis for all samples, in which the reaction stage is shown by different temperatures reached at the monitored central position (representing the bed center). At all pyrolysis stages, from the outer layer a to central layer c, the ash and fixed carbon contents of the analyzed samples decreased, but their volatile contents conversely increased. This agreed with the temperature gradient in the reactor that high-temperature in the outer layer caused a high degree of pyrolysis. Meanwhile, as the reaction progressed (measured temperature increased) the volatile contents of all samples tended to decrease gradually, but those of layers b and c initially increased slightly or did not vary until the measured central temperature was over 300 °C. As the flow of products was from the outer wall to center, species with high boiling points (or heavy species) would be condensed and adsorbed on the surface of inner-layer particles when their temperatures were low, such as below 300 °C. This explained the slight rise in volatile content of samples from layers b and c. The condensation of heavy species also improved the quality of the tar product. Once the temperature of the inner-layer particles was high enough, oil shale pyrolysis and secondary reactions of this condensed matter had to occur. Therefore, the central gas collection pipe realized selective cracking of condensed matters, while other non-condensable matter was directly released as final products without significant secondary reactions occurring when passing through the reactor space.
| Central temperature [°C] | Ash [wt%] | Volatile [wt%] | Fixed carbon [wt%] | ||||||
|---|---|---|---|---|---|---|---|---|---|
| a | b | c | a | b | c | a | b | c | |
| 150 | 67.43 | 63.84 | 63.37 | 25.89 | 31.10 | 31.33 | 6.68 | 5.07 | 5.02 |
| 300 | 74.63 | 64.30 | 63.78 | 17.88 | 31.52 | 31.17 | 7.49 | 6.05 | 5.57 |
| 450 | 80.03 | 76.32 | 70.70 | 10.52 | 15.09 | 21.97 | 9.45 | 8.59 | 7.35 |
| 550 | 82.38 | 82.53 | 81.35 | 7.05 | 8.21 | 9.78 | 10.57 | 9.27 | 8.88 |
For UV analysis, unsaturated functional groups and heteroatoms in the pyrolysis products must induce light absorption in UV region. This absorbance is proportional to the chromophore concentration, indicating the amount of condensate deposited on the particles. Fig. 4 compares the UV spectra of the condensate on 1 mL of particles (0.2–1 mm) taken from layers a–c, and the original oil shale. The absorption peak at around 225 nm, indicating the C![[double bond, length as m-dash]](https://www.rsc.org/images/entities/char_e001.gif) C bond of a large alkene, was used as the comparison reference. For each of the reaction temperatures compared, the absorbance of observable peaks increased from outer layer a to central layer c, with the original oil shale having the lowest absorbance. This indicated that more chemicals were present on particles in the inner low-temperature layers, further verifying the product flow from the high-temperature outer layer to the bed center and into the central gas collection pipe. UV absorbance for samples from a single layer of the reactor manifested a similar variation with pyrolysis temperature (or time). Absorbance was elevated to a maximum when the plotted central temperature was about 450 °C, and then sharply dropped to a very low value by the end of pyrolysis (scale is different in four sub-plots of Fig. 4). This evidenced the secondary reactions of species condensed on the particle surface. During pyrolysis, non-condensable products directly flow into the central gas collection pipe, but most heavy species with high boiling points must be condensed on the low-temperature surface of particles in the inner layer. As the reaction progresses, the inner bed reached a high temperature, causing re-evaporation and cracking of the condensed components into further pyrolysis products via secondary reactions. Therefore, in the reactor with internals, the heavy species experienced, in succession, generation, condensation, and re-evaporation or cracking, while light species were directly discharged as products. This demonstrated that internals resulted in secondary reactions selectively on only heavy species, affording oil production with high yields (due to no secondary reaction of light species) and quality (only cracking of heavy species).
C bond of a large alkene, was used as the comparison reference. For each of the reaction temperatures compared, the absorbance of observable peaks increased from outer layer a to central layer c, with the original oil shale having the lowest absorbance. This indicated that more chemicals were present on particles in the inner low-temperature layers, further verifying the product flow from the high-temperature outer layer to the bed center and into the central gas collection pipe. UV absorbance for samples from a single layer of the reactor manifested a similar variation with pyrolysis temperature (or time). Absorbance was elevated to a maximum when the plotted central temperature was about 450 °C, and then sharply dropped to a very low value by the end of pyrolysis (scale is different in four sub-plots of Fig. 4). This evidenced the secondary reactions of species condensed on the particle surface. During pyrolysis, non-condensable products directly flow into the central gas collection pipe, but most heavy species with high boiling points must be condensed on the low-temperature surface of particles in the inner layer. As the reaction progresses, the inner bed reached a high temperature, causing re-evaporation and cracking of the condensed components into further pyrolysis products via secondary reactions. Therefore, in the reactor with internals, the heavy species experienced, in succession, generation, condensation, and re-evaporation or cracking, while light species were directly discharged as products. This demonstrated that internals resulted in secondary reactions selectively on only heavy species, affording oil production with high yields (due to no secondary reaction of light species) and quality (only cracking of heavy species).
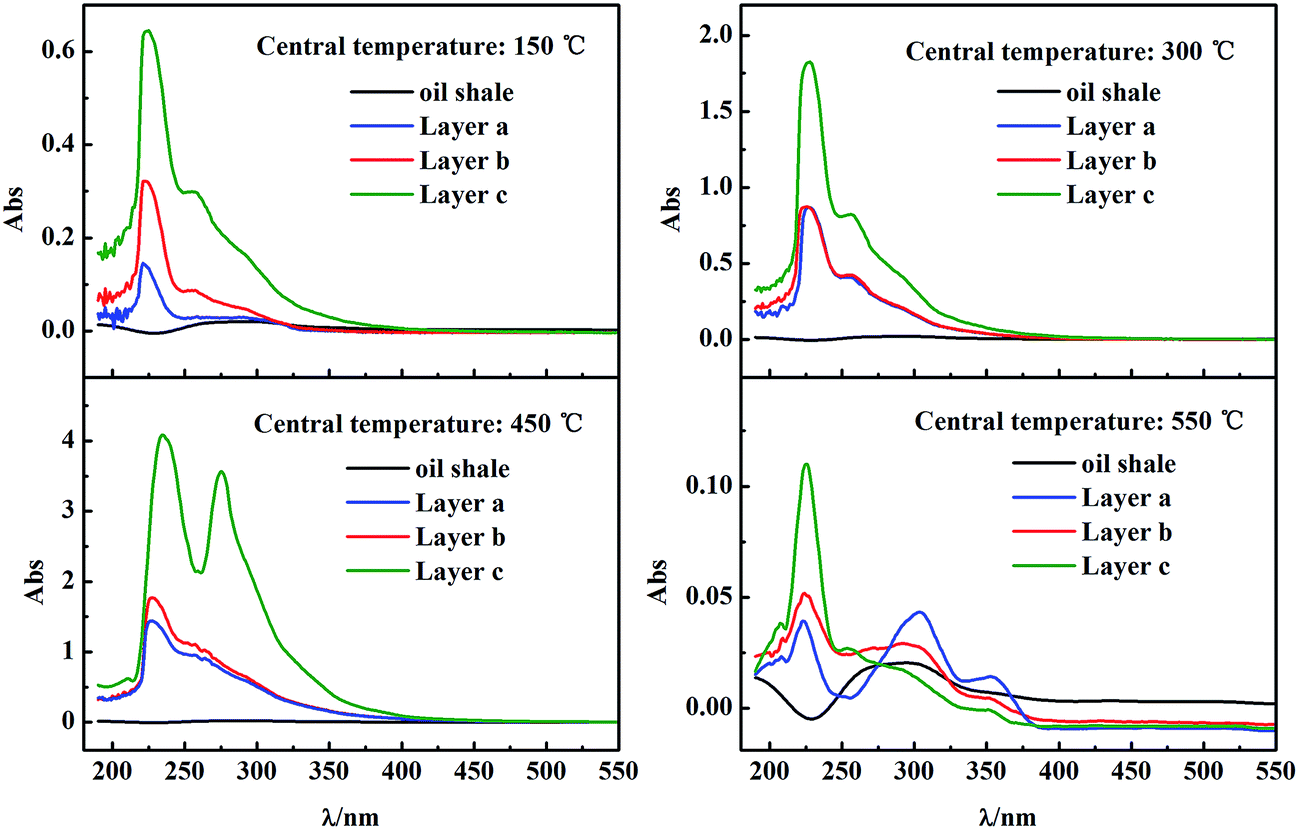 | ||
| Fig. 4 UV analysis of condensate on particles in different particle layers a–c from pyrolysis terminated at different central temperatures. | ||
3.3 Product generation characteristics
Previously, we reported pyrolysis product characteristics based on the final yields and qualities of shale oil and pyrolysis gas.12–14 This section further characterizes production by analyzing oil and gas products at different reaction times or temperatures at the measured central point. Table 3 shows the product distribution at measured central temperatures of 150, 300, 450 and 550 °C. As the reaction progressed, the yields of shale oil and pyrolysis gas increased, while that of char decreased. For the tabulated time, the variation in yield with time was almost linear for all such products. Pyrolysis water production showed little variation during the last stage of reaction because it resulted from water evaporation and decomposition of hydroxy groups at low temperatures. These features of production were different from those in a conventional fixed bed reactor (without internals), which gives obvious peak production at temperatures of 480–530 °C.22–27 This difference was caused by oil shale pyrolysis in the reactor with internals occurring layer-by-layer from outside to inside, and the flow and temperature fields in the reactor being controlled to form the desired direction and gradient, respectively.| Time [min] | Central temperature [°C] | Yield [wt%] | |||
|---|---|---|---|---|---|
| Char | Oil | Water | Gas | ||
| 20 | 150 | 97.55 | 0.60 | 0.46 | 1.20 |
| 38 | 300 | 91.13 | 2.86 | 2.50 | 3.82 |
| 56 | 450 | 80.87 | 7.71 | 4.22 | 8.32 |
| 74 | 550 | 75.31 | 11.45 | 4.29 | 11.74 |
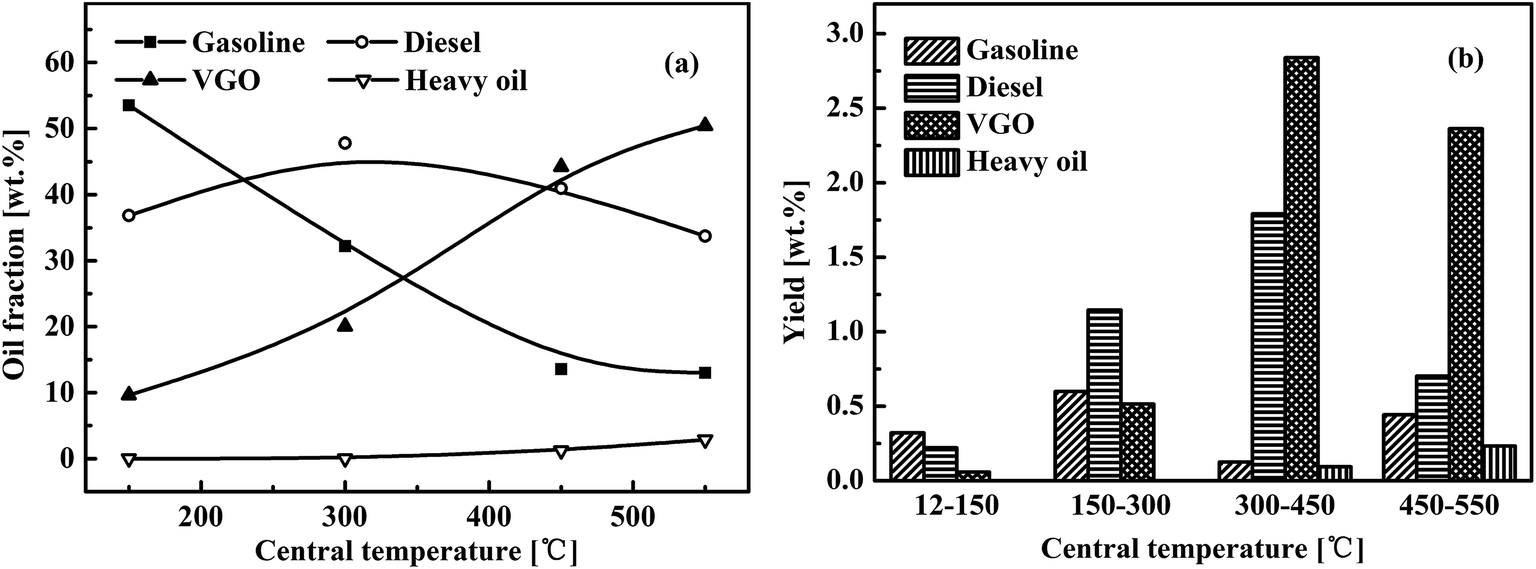
The shale oil product can be characterized according to boiling points as fractions of gasoline (<180 °C), diesel (180–350 °C), vacuum gas oil (VGO, 350–500 °C) and heavy oil (>500 °C). Fig. 5 shows the variations in fractions of these distillates with pyrolysis temperature at the measured central point and the yield at each pyrolysis stage at a range of measured central temperatures. In Fig. 5, the fraction was the oil obtained in a test at room temperature to the mentioned individual central temperature, while the yields are for the shale oil product obtained at each temperature range, including 0–150 °C, 150–300 °C, 300–450 °C and 450–550 °C. Using the temperature range 150–300 °C as an example, two pyrolysis experiments were conducted in this range to obtain shale oil yields from room temperature to 150 °C and 300 °C. Then, by subtraction, the plotted yield was estimated for the temperature range of 150–300 °C, as shown in Fig. 5(b).
 | ||
| Fig. 5 Variations in (a) oil fraction and (b) yield with changing central temperature in the reactor with internals. | ||
Fig. 5(a) clearly shows that no heavy oil was generated by pyrolysis at temperatures below 300 °C at the measured central point, but the ultimate heavy oil content reached 2.86 wt% of oil gained at a central temperature of 550 °C. The total VGO yield was 0.57 wt% up to 300 °C and 5.20 wt% at 300–550 °C. The oils obtained at measured central temperatures of 450 °C and 550 °C had VGO contents that reached 44.25 wt% and 50.43 wt%, respectively. Therefore, heavy components, including VGO and heavy oil, were generated mainly in late stage of pyrolysis at temperatures above 300 °C. The fraction of gasoline in the shale oil product sharply decreased from 53.53% to about 13.0% when the measured temperature was raised from 150 °C to 550 °C. However, the absolute gasoline yield at each reaction stage was low, fluctuating around 0.4 wt%. The heavy products (VGO + heavy oil) decreased the gasoline fraction at high temperatures. Diesel distillate was produced mainly at central temperatures above 300 °C, with the highest yield (1.9 wt%) obtained at 300–450 °C. The diesel content remained at about 40% in oils obtained using all tested central temperatures. Diesel production is thought to be caused by the pyrolysis of oil shale and secondary racking of condensate at 400–550 °C. Therefore, the beneficial actions from our mounted internals enabled the production of gasoline and diesel (light oils) in the entire temperature range up to 550 °C, whereas the production of VGO and heavy oil (heavy species) mainly occurred at high-temperature reaction stages (>300 °C). In the reactor with internals, the condensation of heavy matter on inner-layer particles had to occur during earlier reaction stages (<300 °C at the measured central point). This was a critical process to ensure selective cracking to heavy species.
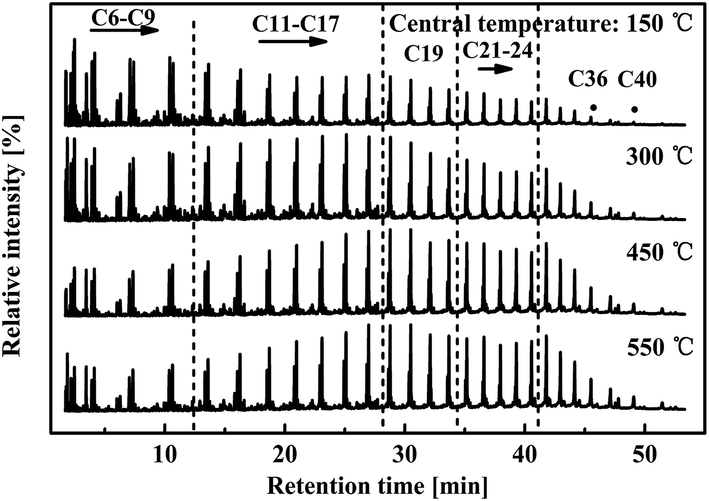
Fig. 6 shows the GC-MS spectra of oil samples obtained at the tested different central temperatures shown in Fig. 5. The carbon numbers of components were marked to identify alkane peaks. In the first spectrum (150 °C), the relative intensity decreased with increasing carbon number. Raising the central temperature (300, 450, and 550 °C) gradually elevated the relative intensities of carbon numbers above 15. Further pyrolysis and re-evaporation/cracking of heavy species lowered the relative intensities of groups C6–C9 but increased those of C19, C21–C24, C36, and C40. This result complied with the preceding distillation analysis, but was the opposite of our general knowledge regarding oil composition variation with pyrolysis temperature in normal fixed bed reactors.19,23 Deep cracking of long-chain hydrocarbons in high-temperature wall-annulus was expected to cause obvious decomposition of species with carbon numbers above 17. However, the action of internals caused these high-C species to be released and moderately decomposed in the late stage of pyrolysis.
 | ||
| Fig. 6 GC-MS spectra of shale oils from pyrolysis terminated at different central temperatures in the reactor with internals. | ||
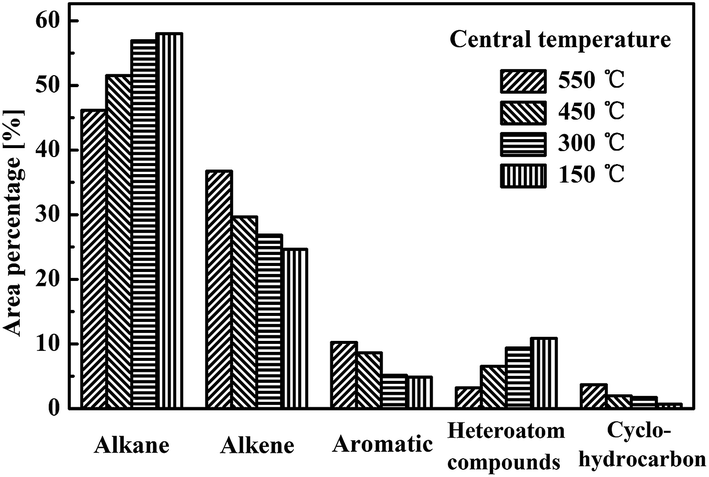
From GC-MS analysis, the oil components were classified into five types: alkanes, alkenes, aromatics, heteroatom compounds, and cyclohydrocarbons. Their area percentages were calculated by integrating peaks of the GC-MS spectrum. The area percentage was proportional to the content of the indicated chemicals. Fig. 7 shows that the area percentage of aliphatic hydrocarbons (alkane and alkene) was above 80% in all oils, indicating the aliphatic hydrocarbon base of the shale oil composition. The area percentages for aromatic and heteroatom compounds were both around 10%, while that of cyclohydrocarbon was below 5%. The variation in relative areas with central temperature (pyrolysis stage) revealed that continued pyrolysis at high temperatures reduced the alkenes, aromatics, and cyclohydrocarbons in oil, but gave more alkanes and heteroatom compounds. Considering the chemical structure of these components, the molecular weights of the alkenes, aromatics, and cyclohydrocarbons were much lower than those of the alkanes. The carbon numbers of most alkenes, aromatics, and cyclohydrocarbons were below 19, 11, and 16, respectively. Fig. 6 shows the carbon number distribution of the alkanes obtained, indicating that high molecular weight alkane components were present. C19H37N, C27H56O, and C28H58O were detected as the major heteroatomic compounds, with molecular weights higher than the alkenes, aromatics, and cyclohydrocarbons obtained. The boiling point of oil components increases with higher molecular weights. Therefore, alkanes and heteroatomic compounds would condense in the earlier stage of pyrolysis and re-evaporate in the late stage to give a gradually higher percentage, as shown in Fig. 7.
 | ||
| Fig. 7 Major chemical components of shale oils from pyrolysis terminated at different central temperatures in the reactor with internals. | ||
4. Conclusions
Pyrolysis of Huadian oil shale in fixed bed reactors with or without internals was conducted to investigate the working mechanism of internals in improving pyrolysis performance. Measuring heating curves of the oil shale particles at the bed center clarified that the particularly designed internals increased heat transfer from the reactor wall to the central layer of oil shale by 30–50%. The internals were further shown to regulate the flow of volatile products in the reactor from the annular high-temperature zone to the central low-temperature region. This caused silica sand loaded in the annular layer of the reactor with internals to maintain its white color, whereas in the reactor without internals the silica sand was blackened, demonstrating a certain degree of coking of the volatiles flowing through the sand particles. Furthermore, because of the regulation of volatile flow by internals, UV analysis of the liquid washing particles demonstrated that the particles taken from the central layer of the reactor with internals contained more deposited surface chemicals, confirming the condensation of heavy components on these particles, which were at relatively low temperatures during the early stages of pyrolysis. The condensed heavy components were re-evaporated or cracked in-turn when the central bed temperature was further elevated during late-stage pyrolysis. Consequently, by regulating volatile flow in the reactor from high temperature to low temperature, secondary reactions were selectively restricted to heavy species via a successive process of condensation, evaporation, and cracking. Meanwhile, light components were directly exhausted via the central channel as pyrolysis products. Because the volatiles released from oil shale particles flowed into a low-temperature region, where only heavy species underwent the aforementioned selective secondary reactions, the shale oil yield continuously increased with increasing heating temperature and maintained a high light content even at higher heating temperatures. Terminating oil shale pyrolysis at central temperatures of 150, 300, 450, and 550 °C further demonstrated that, in the reactor with internals, light species (gasoline + diesel) were produced throughout the entire pyrolysis period, whereas heavy species (VGO + heavy oil) were mainly generated in the late stage. Pyrolysis in the reactor with internals was also shown to produce more alkenes and aromatics in the early reaction stage at low temperatures, but more alkanes in the late stage at higher temperatures.Acknowledgements
The study was financed by the National Basic Research Program of China (2014CB744303), National Natural Science Foundation (91534125), and Strategic Priority Research Program of Chinese Academy of Sciences (XDA07010100).References
- J. R. Dyni, Oil Shale, 2003, 20, 193–252 Search PubMed.
- W. Taciuk, Oil Shale, 2013, 30, 1–5 CrossRef.
- K. Bredow, Oil Shale, 2003, 20, 81–92 Search PubMed.
- J. G. Speight, Shale oil production process, Elsevier, New York, 2012 Search PubMed.
- X. M. Jiang, Z. G. Cui, C. Yan, D. C. Liu, J. R. Qiu and J. B. Li, Fuel, 2002, 81, 793–797 CrossRef CAS.
- J. Qian, J. Wang and S. Li, Proceedings of the 18th International Offshore and Polar Engineering Conference, ISOPE, Vancouver, 2008, pp. 19–20 Search PubMed.
- A. R. Brandt, Energy Fuels, 2009, 23, 6253–6258 CrossRef CAS.
- X. M. Jiang, X. X. Han and Z. G. Cui, Energy, 2007, 32, 772–777 CrossRef.
- I. Öpik, N. Golubev, A. Kaidalov, J. Kann and A. Elenurm, Oil Shale, 2001, 18, 99–108 Search PubMed.
- P. Chaturong and P. Adisak, Powder Technol., 2013, 245, 233–240 CrossRef.
- S. Y. Yang, J. Zhang, Q. C. Yang and Y. Qian, Energy Fuels, 2014, 28, 5557–5564 CrossRef CAS.
- C. Zhang, R. C. Wu and G. W. Xu, Energy Fuels, 2014, 28, 236–244 CrossRef CAS.
- L. X. Lin, C. Zhang, H. J. Li, D. G. Lai and G. W. Xu, Fuel Process. Technol., 2015, 138, 147–155 CrossRef CAS.
- L. X. Lin, D. G. Lai, E. W. Guo, C. Zhang and G. W. Xu, Fuel, 2016, 163, 48–55 CrossRef CAS.
- O. S. Al-Ayed, M. R. Suliman and N. A. Rahman, Appl. Energy, 2010, 87, 2273–2277 CrossRef CAS.
- O. S. Al-Ayed, M. Matouq, Z. Anbar, A. M. Khaleel and E. Abu-Nameh, Appl. Energy, 2010, 87, 1269–1272 CrossRef CAS.
- H. Bar, R. Ikan and Z. Aizenshtat, J. Anal. Appl. Pyrolysis, 1988, 14, 49–71 CrossRef CAS.
- G. Yang, Z. H. Wang, Q. M. Xian, F. Shen, C. Sun, Y. Z. Zhang and J. Wu, RSC Adv., 2015, 5, 40117–40125 RSC.
- Y. H. Sun, F. T. Bai, B. C. Liu, Y. M. Liu, M. Y. Guo, W. Guo, Q. W. Wang, X. S. Lü, F. Yang and Y. Yang, Fuel, 2014, 115, 338–346 CrossRef CAS.
- J. Gersten, V. Fainberg, G. Hetsroni and Y. Shindler, Fuel, 2000, 79, 1679–1686 CrossRef CAS.
- M. C. Torrente and M. A. GalaÂn, Fuel, 2001, 80, 327–334 CrossRef CAS.
- V. Dieckmann, H. J. Schenk, B. Horsfield and D. H. Welte, Fuel, 1998, 77, 23–31 CrossRef CAS.
- L. Ballice, Fuel Process. Technol., 2005, 86, 673–690 CrossRef CAS.
- H. F. Guo, J. D. Lin, Y. D. Yang and Y. Y. Liu, Fuel, 2014, 118, 186–193 CrossRef CAS.
- S. Wang, X. M. Jiang, X. X. Han and J. H. Tong, Fuel Process. Technol., 2014, 121, 9–15 CrossRef CAS.
- P. T. Williams and N. Ahmad, Fuel, 1999, 78, 653–662 CrossRef CAS.
- F. D. Guffey and T. R. McLendon, Liq. Fuels Technol., 1984, 2, 439–461 CrossRef CAS.
- T. H. Fletcher, R. Gillis, J. Adams and T. Hall, Energy Fuels, 2014, 28, 2959–2970 CrossRef CAS.
- J. H. Campbell, G. H. Koskinas, N. D. Stout and T. T. Coburn, In Situ, 1978, 2, 1–47 Search PubMed.
- X. Z. Lan, W. J. Luo, Y. H. Song, J. Zhou and Q. L. Zhang, Energy Fuels, 2015, 29, 7800–7806 CrossRef CAS.
- D. G. Lai, Z. H. Chen, L. X. Lin, Y. M. Zhang, S. Q. Gao and G. W. Xu, Energy Fuels, 2015, 29, 2219–2226 CrossRef CAS.
- L. Zhang, B. Zhang, Z. Q. Yang and Y. F. Yan, RSC Adv., 2014, 4, 39145–39155 RSC.
- H. Y. Zhang, J. Zheng, R. Xiao, D. K. Shen, B. S. Jin, G. M. Xiao and R. Chen, RSC Adv., 2013, 3, 5769–5774 RSC.
- H. F. Guo, Q. X. Cheng, Z. Jin, D. Wang, G. W. Xu and Y. Y. Liu, RSC Adv., 2016, 6, 102231–102248 RSC.
| This journal is © The Royal Society of Chemistry 2017 |