 Open Access Article
Creative Commons Attribution 3.0 Unported Licence
A simple and sensitive sensor based on a molecularly imprinted polymer-modified carbon paste electrode for the determination of curcumin in foods
Q. Zhou *a,
H. Y. Zhaia,
Y. F. Pan*b and
K. Lia
aDepartment of Pharmacy, GuangDong Pharmaceutical University, GuangZhou, 510006, PR China. E-mail: kytxor@163.com; Fax: +86 2039352128; Tel: +86 02039352135
bDepartment of Chemistry, GuangDong Pharmaceutical University, ZhongShan, 528458, PR China. E-mail: p39352353@126.com
First published on 26th April 2017
Abstract
A highly sensitive and selective molecularly imprinted polymer-modified carbon paste electrode (MIP-CPE) was designed. The curcumin molecularly imprinted polymer (CUR-MIP) was prepared by thermally induced precipitation polymerization, using curcumin (CUR) as the template molecule, methacrylic acid (MAA) as the functional monomer, 2,2′-azodiisobutyronitrile (AIBN) as the initiator, and ethylene glycol dimethacrylate (EDGMA) as the cross-linker. The modified electrode was prepared by mixing the polymer, graphite powder, and paraffin oil in specific proportions. The electrochemical behaviour of CUR on this electrode was studied, and a method for direct CUR determination using this electrode was established. The results showed that CUR exhibited a distinct oxidation peak (Epa) at 0.434 V (vs. SCE) in the mixed phosphate buffer solution (PBS) at pH 3.06. The optimum addition ratio of the polymer in the modified electrode was 20%, and the peak current (Ipa) was 4.5-fold higher than that of the bare CPE. The Ipa showed a good linear relationship with concentration in the range 0.1–50 μM, and the detection limit was 10.1 nM. The method was applied to determine CUR contents in food, giving recovery rates of 90.77–105.7%.
1. Introduction
Curcumin (CUR, Scheme 1) is a diketone compound used widely in food and medicine. It is extracted from the roots of certain plants of the Zingiberaceae and Araceae families. It has been used as a natural pigment in the food industry due to its bright yellow colour, mainly in canned foods, intestinal products, cakes, beverages, and other dyeing applications.1 Pharmacologically, CUR, or its sodium salt, has antibacterial, antitumour, hypoglycaemic, and antioxidant effects.2–7 In traditional Chinese medicine, CUR is believed to help blood circulation, warm the meridians, and cure pain caused by rheumatism and blood stasis.In China, Japan, the European Union, and other regions, CUR can be legally added to food. However, in September 2010, the Food Additives and Nutritional Enhancers Science Committee of the European Food Safety Authority was asked to re-evaluate the safety of CUR as a food colouring. The acceptable daily intake amount may also be redefined. Therefore, the fast and convenient determination of CUR content in food has become necessary. Currently, CUR determination is mainly performed by HPLC, HPTLC, LC-MS, TLCS, CE, and spectrophotometry.8–16 However, the pretreatment process for these methods is tedious, and sensitivity and selectivity vary. The electrochemical determination of CUR has rarely been reported. Afzalia et al. detected CUR in urine and turmeric samples using a ferrocene-nanofiber carbon paste electrode, which gave a linear calibration graph in the range 0.1–500 μM curcumin with a detection limit of 24 nM.17 Cakir et al. used a palladium nanoparticle (PdNP)-coated graphite electrode to detect curcumin in samples of turmeric powder, which gave a linear calibration graph in the range 3.0 × 10⁻⁸ M to 6.0 × 10⁻⁷ M with a detection limit of 2.2 × 10⁻⁸ M.18 Ziyatdinova et al. determined curcumin in spices using a glassy carbon electrode in 0.1 M LiClO4 in ethanol, which gave a linear calibration graph in the range 9.9 × 10⁻⁶ to 1.07 × 10⁻⁴ M curcumin with a detection limit of 4.1 × 10 −6 M.19
Chemically modified carbon paste electrodes (CMCPEs) are composed of a modifier and carbon paste, which provides a specific function to the modified electrode. CMCPEs enhance the selectivity and sensitivity of the CPE, combining separation, enrichment, and selective determination.20–22 Therefore CMCPEs have become popular in electrical analysis research. Our group has made progress in researching modified carbon paste electrodes.23–25 MIP has good stereospecific recognition and has been widely used in chromatographic separation, antibody or receptor simulation, biosensors, enzyme simulation, and catalytic synthesis, among other applications. In this paper, the electrochemical behaviour of CUR was studied using MIP-CPE as the working electrode. The direct determination of CUR using this electrode was established and applied to the determination of CUR in food, giving excellent results.
2. Experimental
2.1 Apparatus and chemicals
Cyclic voltammetry (CV) was performed using an Ingsens-1100 series handheld electrochemical workstation (Ingsens Instruments, Guangzhou, China). A conventional three-electrode system comprising MIP-CPE as the working electrode, SCE (Chenhua Instruments, Shanghai, China) as the reference electrode, and a platinum electrode (Chenhua Instruments, Shanghai, China) as the indicating electrode. A pH meter (pHS-25, Leici Instrument, Shanghai, China) with a double junction glass electrode was used to determine the pH of solutions.CUR (≥98%) was purchased from the China Institute of Pharmaceutical and Biological Products, graphite powder (SP, 40 nm) was obtained from the China National Pharmaceutical Group Chemical Reagent Co., Ltd. MAA (AR), EDGMA (AR), AIBN (AR), and liquid paraffin (HPLC) were purchased from Shanghai Aladdin Reagent Co., Ltd. Other chemicals were analytically pure, and deionized water was used in all experiments. Curcuma powder and cookies (Meixin West Bakery) were purchased from a supermarket in Guangzhou.
2.2 Preparation of MIP26,27
CUR (1 mM) was accurately weighed and placed in a round-bottom flask. CH3OH (120 mL), MAA (4 mM), EDGMA (20 mM), and AIBN (30 mg) were then added and mixed well, followed by nitrogen purging for 10 min. The flask was sealed and placed in a constant temperature water bath for polymerization at 60 °C for 24 h. The product was rinsed with a mixed solution of methanol–acetic acid (9![[thin space (1/6-em)]](https://www.rsc.org/images/entities/char_2009.gif) :
:![[thin space (1/6-em)]](https://www.rsc.org/images/entities/char_2009.gif) 1) until no CUR was detected in the eluent. Methanol was used to remove the residual formic acid. The product was dried in the oven at 60 °C to obtain CUR-MIP.
1) until no CUR was detected in the eluent. Methanol was used to remove the residual formic acid. The product was dried in the oven at 60 °C to obtain CUR-MIP.
A blank or a non-imprinted polymer (NIP) was prepared using the same method in the absence of template.
2.3 Electrode fabrication
Fine graphite powder, MIP, and paraffin oil were mixed in certain ratios and packed into a 2.0 mm radius glass tube. A copper wire was inserted from the back as the electrical contact. The electrode surface was polished using soft white paper, and the MIP-CPE was then prepared.An NIP-CPE was prepared using the same method, but replacing MIP with NIP.
2.4 Preparation of buffer solution and standard solution
Mixed phosphate solid reagent (KH2PO4 3.388 g + Na2HPO4 3.533 g) was dissolved in distilled water and transferred into a 250 mL volumetric flask to obtain PBS of pH 6.86. The pH was adjusted using 1 M HCl solution.A CUR standard sample (0.07369 g) was accurately weighed and dissolved in absolute ethanol. The solution was transferred to a 200 mL brown volumetric flask. A 1.0 mM CUR standard solution was obtained and stored in a 4 °C refrigerator. The solution was diluted to the desired concentration using PBS at pH 3.06.
2.5 Sample pretreatment
Small samples of curcuma powder and cookies were ground and dried at 70 °C. The curcuma powder (0.2 g) and curcuma cookie powder (1 g) were weighed and placed in separate conical flasks with stoppers. Next, 95% ethanol (20 mL) was added to each flask for extraction under ultrasonication for 30 min, followed by filtration. The sample residue was also extracted using this method. The filtrate was combined and transferred into a 100 mL volumetric flask to be stored at 4 °C. For use, 2 mL of this solution was diluted to the desired concentration using PBS (18 mL, pH 3.06).2.6 Electrochemical measurement
The solution was transferred into a small beaker with the three-electrode system. The accumulation time (tacc) was set to 20 s, and the electrode was scanned in the range 0–1.0 V at a scan rate of 50 mV s−1. The peak potential (Epa) and peak current (Ipa) were recorded at 0.434 V.At the end of each measurement, the working electrode was placed in a 1 M NaOH solution and scanned for five cycles to remove any absorbed CUR.
The recovery study was conducted using a standard addition method. Different amounts of CUR were added to the sample solution, and the measured peak current was recorded using the electrode present.
3. Results and discussion
3.1 Electrochemical behaviour of CUR
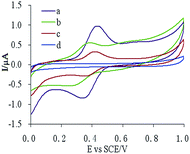
Three different electrodes, MIP-CPE, NIP-CPE, and CPE, were used in a 10 μM CUR solution for cyclic voltammetry scans, as described in Section 2.6. The results are shown in Fig. 2. The oxidation peak (Epa) of CUR on the bare CPE was 0.434 V, and the reduction peak (Epc) was 0.338 V (Fig. 1c), which indicated that the oxidation–reduction reaction of CUR on CPE was quasi-reversible. The response of CUR on MIP-CPE was the highest (Fig. 1a). Compared with the bare CPE, the Ipa increased approximately 4.5-fold. This increase was probably due to the specific ability of MIP to recognize the template molecules. The CUR molecules could diffuse to the surface of the electrode through polymer pores and undergo a redox reaction. Meanwhile, due to the enrichment effect of MIP on the template molecules, the sensitivity of the electrode was increased, and the anti-interference ability of the electrode was improved.3.2 Optimization of measurement conditions
![[thin space (1/6-em)]](https://www.rsc.org/images/entities/char_2009.gif) :
:![[thin space (1/6-em)]](https://www.rsc.org/images/entities/char_2009.gif) 10, 80
10, 80![[thin space (1/6-em)]](https://www.rsc.org/images/entities/char_2009.gif) :
:![[thin space (1/6-em)]](https://www.rsc.org/images/entities/char_2009.gif) 20, 70
20, 70![[thin space (1/6-em)]](https://www.rsc.org/images/entities/char_2009.gif) :
:![[thin space (1/6-em)]](https://www.rsc.org/images/entities/char_2009.gif) 30, and 60
30, and 60![[thin space (1/6-em)]](https://www.rsc.org/images/entities/char_2009.gif) :
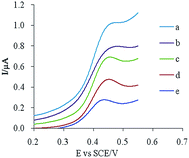
:![[thin space (1/6-em)]](https://www.rsc.org/images/entities/char_2009.gif) 40 (m/m). The resulting electrodes were scanned in a 10 μM CUR solution, and the results are shown in Fig. 2. Probably due to the functional group and pore of MIP having a specific recognition ability for the template molecule, adding MIP into the electrode material increased the adsorption capacity of the template molecule on the surface of the electrode, which increased the peak current. Higher peak currents and better peak shapes were obtained when the ratio of graphite to MIP was 80
40 (m/m). The resulting electrodes were scanned in a 10 μM CUR solution, and the results are shown in Fig. 2. Probably due to the functional group and pore of MIP having a specific recognition ability for the template molecule, adding MIP into the electrode material increased the adsorption capacity of the template molecule on the surface of the electrode, which increased the peak current. Higher peak currents and better peak shapes were obtained when the ratio of graphite to MIP was 80![[thin space (1/6-em)]](https://www.rsc.org/images/entities/char_2009.gif) :
:![[thin space (1/6-em)]](https://www.rsc.org/images/entities/char_2009.gif) 20. Therefore, this optimized electrode composition was used to prepare modified electrodes.
20. Therefore, this optimized electrode composition was used to prepare modified electrodes.
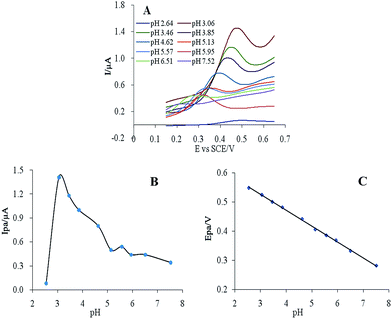 | ||
| Fig. 3 (A) Cyclic voltammograms of 10 μM CUR in PBS at pH 2.64–7.52. Effect of pH on the (B) peak current and (C) potential. | ||
CUR has a yellow or orange-yellow colour in acidic or neutral environments, and its peak potential decreases with increasing pH. Over the pH range 2.54–7.52, the peak potential was a linear function of pH (Fig. 3C), following the equation E = −0.054 pH + 0.688, r = 0.9990, for which the slope was 0.054 and close to 0.059. According to the Nernst equation, the reaction of CUR on the electrode was a redox process with equal electrons and protons.
3.3 Reaction mechanism study
The effect of scanning rate on the 10 μM CUR peak current and peak potential was studied using cyclic voltammetry (Fig. 4A). The results showed that the peak current of CUR and υ exhibited a linear relationship in the scanning rate range 10–800 mV s−1 (Fig. 4B), with the equation Ipa = 0.0078υ + 0.0704, r = 0.9998. This result indicated that the oxidation of CUR was an absorption-controlled process. Additionally, the peak current increased gradually with increasing scanning rate. To obtain a better signal-to-noise ratio and peak shape, a scanning rate of 50 mV s−1 was used for subsequent experiments.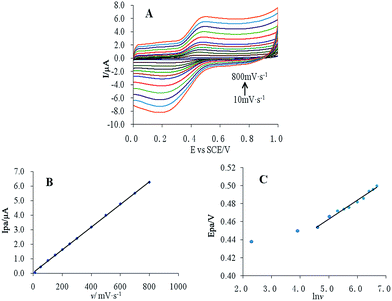 | ||
Fig. 4 (A) Cyclic voltammetry of 10 μM CUR at different scanning rates, (B) linear relationship of Ipa and v, and (C) linear relationship of Ipa and ln![[thin space (1/6-em)]](https://www.rsc.org/images/entities/char_2009.gif) v. v. | ||
Epa and ln![[thin space (1/6-em)]](https://www.rsc.org/images/entities/char_2009.gif) v also had a good linear relationship (Fig. 4C), with the following equation:
v also had a good linear relationship (Fig. 4C), with the following equation:
E = 0.021![[thin space (1/6-em)]](https://www.rsc.org/images/entities/char_2009.gif) ln ln![[thin space (1/6-em)]](https://www.rsc.org/images/entities/char_2009.gif) υ + 0.357 (r = 0.9842) υ + 0.357 (r = 0.9842)
| (1) |
According to the quasi-reversible electrode reaction, the relationship between peak potential and scanning rate can be described as follows:28
 | (2) |
![[thin space (1/6-em)]](https://www.rsc.org/images/entities/char_2009.gif) 487 C M−1), υ is the scanning rate (V s−1), R is the gas constant (8.314 J K−1), and T is the temperature in K (298). The value of αn was calculated to be 0.61, assuming α was 0.5 (ref. 29) and the number of electrons involved in the reaction was n = 1.22, which was close to 1. In combination with the conclusion of Section 3.2.3, the redox reaction of CUR on this electrode involved transferring one proton and one electron. A reaction mechanism was proposed, as described below (Scheme 2).
487 C M−1), υ is the scanning rate (V s−1), R is the gas constant (8.314 J K−1), and T is the temperature in K (298). The value of αn was calculated to be 0.61, assuming α was 0.5 (ref. 29) and the number of electrons involved in the reaction was n = 1.22, which was close to 1. In combination with the conclusion of Section 3.2.3, the redox reaction of CUR on this electrode involved transferring one proton and one electron. A reaction mechanism was proposed, as described below (Scheme 2).
In addition, combining eqn (3) and the linear relation between Ipa and υ (Fig. 4B), the absorption capacity of CUR on the MIP-CPE surface was calculated as follows:30
 | (3) |
3.4 Interference test
For the interference test, 1000-fold Mg2+, Zn2+, K+, Na+, Cl−, and CO32− were added to a 10 μM CUR standard solution and scanned using the CPE and MIP-CPE, respectively. The results showed no interference in the detection of CUR and that the MIP-CPE exhibited a higher anti-interference ability than the bare CPE.3.5 Electrode precision, repeatability, and stability
After obtaining a stable scan for the blank solution, the freshly prepared modified electrode was evaluated by continuously measuring the CUR standard solution ten times. As the relative standard deviation (RSD) was 0.4%, the modified electrode was very precise. Five electrodes were prepared under the same conditions simultaneously. The RSD was 3.3% when measuring the same CUR standard solution, which indicated good repeatability. After storing the same electrode at room temperature for 3, 6, 9, 12, and 15 days, the RSD was 2.8% when measuring the same CUR standard solution, which indicated good stability.3.6 Linear range and detection limit
The peak current was found to be linearly dependent on CUR concentration in the range 0.1–50 μM (Fig. 5). The regression equation was Ipa = 0.065c + 0.322, r = 0.9999. According to S/N = 3, the detection limit was calculated to be 10.1 nM.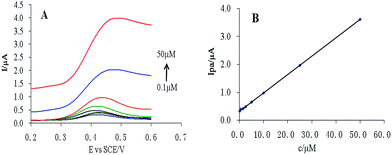 | ||
| Fig. 5 (A) Linear scan cyclic voltammogram of CUR at different concentrations, and (B) linear relationship between CUR concentration and peak current. | ||
3.7 Sample analysis
The contents of CUR in curcuma powder and cookies were determined using the MIP-CPE. The samples were treated as described in Section 2.5, and the results are summarized in Table 1. Converting to a mass fraction, the contents of CUR in curcuma powder and cookies were 2.10% and 0.0199%, respectively.| Samples | Found/μM | Added/μM | Determined/μM | Recovery, n = 5/% | RSD, n = 5/% |
|---|---|---|---|---|---|
| Curcuma powder | 11.40 | 9.00 | 20.12 | 96.67 | 2.33 |
| 11.40 | 11.50 | 23.51 | 105.2 | 1.95 | |
| 11.40 | 14.00 | 26.26 | 105.7 | 1.97 | |
| Curcuma cookies | 0.54 | 0.42 | 0.93 | 92.86 | 3.23 |
| 0.54 | 0.55 | 1.04 | 90.91 | 3.48 | |
| 0.54 | 0.65 | 1.13 | 90.77 | 2.99 |
3.8 Method comparison
Compared with the reference method (Table 2), the present method had a wider linear range, higher recovery rate, and lower detection limit. A small portable electrochemical workstation was used in this study, for which the instrument cost was relatively low and no complex pre-treatment of the sample was needed. Therefore, it could be applied to the on-site rapid detection of CUR in food.| Ref. | Method | Linear range | Recovery/% | LOD | RSD/% |
|---|---|---|---|---|---|
| 8 | HPLC | 0.075–0.175 mg mL−1 (75–175 ng mL−1) | 100.35–101.21 | 0.014 mg mL−1 (14 ng mL−1) | — |
| 9 | HPLC | — | 85 | — | 5.0 |
| 10 | HPLC | 5–255 ng mL−1 | 76.9 | 5 ng mL−1 | — |
| 11 | HPLC | 0.2–7.0 ng mL−1 | 96 | 0.091 ng mL−1 | — |
| 12 | HPTLC | 50–300 ng per spot | 99.55–1.1.83 | 8 ng per spot | 0.53–0.73 |
| 13 | LC-MS | 5–2000 ng mL−1 | — | 5 ng mL−1 | 0.58–14.46 |
| 14 | CE | 3 × 10⁻⁶ to 7 × 10⁻⁴ mol L−1 (1.1–257.6 ng mL−1) | 81.0–85.5 | 3 × 10⁻⁸ mol L−1 (0.011 ng mL−1) | 4.1–6.3 |
| 15 | UV-vis | 4–40 mg L−1 (4–40 ng mL−1) | 77.21–97.28 | 0.04 mg L−1 (0.04 ng mL−1) | 0.37–0.69 |
| 17 | CV | 0.1–500 μM | 98–103.4 | 24 nm | 2.23 |
| 18 | CV | 0.03–0.6 μM | — | 22 nM | 2.9 |
| 19 | CV | 9.9–107 μM | — | 4.1 μM | 2.3 |
| Present work | CV | 0.1–50 μM (0.0368–18.4 ng mL−1) | 90.77–105.7 | 10.1 nM (0.00368 ng mL−1) | 1.95–3.48 |
4. Conclusions
A CUR-MIP-modified MIP-CPE has been developed. The optimum amount of polymer in the electrode was 20% and the oxidation peak current at 0.434 V was approximately 4.5 times higher than that of the bare CPE. The optimum conditions for CUR determination by the electrode were found to be a PBS buffer solution (pH 3.06), an accumulation time of 20 s, and a scanning rate of 50 mV s−1. The linear range was 0.1–50 μM, and the detection limit was 10.1 nM. The method was used to determine the CUR content in commercial samples A and B, and the recovery rate ranged from 90.77% to 105.7%. The electrode showed good sensitivity, selectivity, and anti-interference ability. Its simple sample pretreatment, fast detection speed, and low cost make its application to the rapid determination of CUR in food feasible.Acknowledgements
This work was supported by the National Natural Science Foundation of China (No. 81573678) and the Natural Science Foundation of Guangdong province (No. 2015A030313584).References
- Chinese pharmacopoeia, 2015, pp. 264–265 Search PubMed.
- A. B. Hegge, T. T. Nielsen, K. L. Larsen, E. Bruzell and H. H. Tønnesen, J. Pharm. Sci., 2012, 101, 1524–1537 Search PubMed.
- J. Miquel, A. Bernd, J. M. Sempere, J. Díaz Alperi and A. Ramírez, Arch. Gerontol. Geriatr., 2002, 34, 37–46 CrossRef CAS PubMed.
- L. L. Miguel, Mol. Nutr. Food Res., 2008, 52, S103–S127 Search PubMed.
- Y. Guang, G. Kimmer and L. J. Susan, Mol. Carcinog., 2013, 52, 404–411 CrossRef PubMed.
- P. Neerati, R. Devde and A. K. Gangi, Phytother. Res., 2014, 28, 1796–1800 CrossRef CAS PubMed.
- Y. M. Sun, R. X. Wang, S. L. Yuan, X. J. Lin and C. B. Liu, Chin. J. Chem., 2004, 22, 827–830 CrossRef CAS.
- M. A. Korany, R. S. Haggag, M. A. A. Ragab and O. A. Elmallah, Arabian J. Chem., 2013 DOI:10.1016/j.arabjc.2013.06.021.
- M. J. Scotter, LWT–Food Sci. Technol., 2009, 42, 1345–1351 CrossRef CAS.
- Y. Pak, R. Patek and M. Mayersohn, J. Chromatogr. B: Anal. Technol. Biomed. Life Sci., 2003, 796, 339–346 CrossRef CAS.
- D. D. Heath, M. A. Pruitt, D. E. Brenner and C. L. Rock, J. Chromatogr. B: Anal. Technol. Biomed. Life Sci., 2003, 783, 287–295 CrossRef CAS.
- M. J. Ansari, S. Ahmad, K. Kohli, J. Ali and R. K. Khar, J. Pharm. Biomed. Anal., 2005, 39, 132–138 CrossRef CAS PubMed.
- W. Z. Ma, J. L. Wang, Q. Guo and P. F. Tu, J. Pharm. Biomed. Anal., 2015, 111, 215–221 CrossRef CAS PubMed.
- X. H. Sun, C. L. Gao, W. D. Cao, X. R. Yang and E. K. Wang, J. Chromatogr. A, 2002, 962, 117–125 CrossRef CAS PubMed.
- S. B. R. Aparecida, C. F. Ana, B. Evandro, C. F. Lúcio, H. H. V. F. V. L. Pedro and H. G. Odinei, Food Chem., 2015, 172, 99–104 CrossRef PubMed.
- J. J. B. Nevado, C. G. Cabanillas and A. M. C. Salcedo, Talanta, 1994, 41, 789–797 CrossRef CAS PubMed.
- M. Afzalia, A. Mostafavia and T. Shamspura, Mater. Sci. Eng., C, 2016, 68, 789–797 CrossRef PubMed.
- S. Cakir, E. Bicer and E. Y. Arslan, Croat. Chem. Acta, 2015, 88, 105–112 CrossRef CAS.
- G. K. Ziyatdinova, A. M. Nizamova and H. C. Budnikov, J. Anal. Chem., 2012, 67, 591–594 CrossRef CAS.
- C. H. Hu, J. Deng, X. L. Xiao, X. Z. Zhan, K. H. Huang, N. Xiao and S. Q. Ju, Electrochim. Acta, 2015, 158, 298–305 CrossRef CAS.
- M. Arvand and P. Fallahi, Sens. Actuators, B, 2013, 188, 797–805 CrossRef CAS.
- S. Sadeghi, A. Motaharian and A. Z. Moghaddam, Sens. Actuators, B, 2012, 168, 336–344 CrossRef CAS.
- Z. P. Liu, H. Y. Zhai, Z. G. Chen, Q. Zhou, Z. X. Liang and Z. H. Su, Electrochim. Acta, 2014, 136, 370–376 CrossRef CAS.
- H. Y. Zhai, Z. X. Liang, Z. G. Chen, H. H. Wang, Z. P. Liu, Z. H. Su and Q. Zhou, Electrochim. Acta, 2015, 171, 105–113 CrossRef CAS.
- Z. X. Liang, H. Y. Zhai, Z. G. Chen, H. H. Wang, S. M. Wang, Q. Zhou and X. T. Huang, Sens. Actuators, B, 2016, 24, 915–925 CrossRef.
- X. Y. Liu, L. J. Zhu, X. Gao, Y. X. Wang, H. X. Lu, Y. W. Tang and J. R. Li, Food Chem., 2016, 202, 309–315 CrossRef CAS PubMed.
- P. Wang, W. M. Hu and W. K. Su, Anal. Chim. Acta, 2008, 615, 54–62 CrossRef CAS PubMed.
- J. Wang, Analytical electrochemistry, 2006, p. 30 Search PubMed.
- H. Y. Ma, N. F. Hu and J. F. Rusling, Langmuir, 2000, 16, 4969–4975 CrossRef CAS.
- J. Wang, Analytical electrochemistry, 2006, p. 34 Search PubMed.
| This journal is © The Royal Society of Chemistry 2017 |


