 Open Access Article
Facile synthesis of mesoporous titanium dioxide doped by Ag-coated graphene with enhanced visible-light photocatalytic performance for methylene blue degradation†
Lin Xiao,
Li Youji *,
Chen Feitai,
Xu Peng and
Li Ming
College of Chemistry and Chemical Engineering, Jishou University, 416000, Hunan, P. R. China. E-mail: bcclyj@163.com; Tel: +86-13762157748
First published on 11th May 2017
Abstract
A highly efficient and elaborately structured visible-light-driven catalyst composed of mesoporous TiO2 (MT) doped with Ag+-coated graphene (MT-Ag/GR) has been successfully fabricated by a sol–gel and solvothermal method. The as-prepared catalyst has been investigated by X-ray diffraction (XRD), photoluminescence spectroscopy (PL), X-ray photoelectron spectroscopy (XPS), diffuse reflectance spectroscopy (DRS), scanning electron microscopy (SEM), Fourier transform infrared (FT-IR) spectroscopy, and transmission electron microscopy (TEM). Inexpensive, stable MT was coupled with hole-accepting graphene (GR) and electron-trapping silver induced higher activities than those achieved with pure MT, MT-Ag, and MT/GR in the degradation of methylene blue (MB) in solution. Although the Ag dopant and graphene support were responsible for narrowing the band gap of TiO2 and shifting its optical response, respectively, they acted synergistically in shifting absorbance from the ultraviolet (UV) to the visible-light region with a smaller band-gap energy. Meanwhile, they also served to lower the photo-induced electron and hole recombination rate, and increased the specific surface area and the concentrations of Ti3+ ions and hydroxyl groups. In degradation studies, the effects of catalyst amount, pH, and initial MB concentration have been examined as operational parameters. A photocatalytic mechanism for the action of MT-Ag/GR is proposed, and possible reasons for the enhancement in visible-light photocatalytic efficiency are discussed.
1. Introduction
Mesoporous TiO2 (MT) has been demonstrated to be a highly effective photocatalyst because of its large surface area, porous structure, and large pore volume, which result in an increased number of surface reactive sites and improved mass transport, and it is also environmentally friendly.1–3 Nevertheless, there are still restrictions for its application, such as a high recombination rate of photo-generated electrons and holes, and a low photoresponse towards visible light. These two limiting factors make MT a less-than-ideal material for effective photocatalysis. Therefore, various efforts have been made to improve the photocatalytic properties of MT, including doping with metal ions and coupling with a second semiconductor.4–6 To enhance the visible-light-driven photocatalytic performance of MT, noble metals (Pt, Ag, Pd, Au) have been widely used as dopants to extend its light absorption into the visible-light region.7–11 Ag is frequently employed in surface-modified semiconductor heterojunctions due to its Schottky barriers and matched energy levels.8,9 However, the modified MT also incurs some loss of photocatalytic activity due to an inherent decrease in the surface area available for reaction and low electrical conductivity of the heterostructure.12 Thus, there is a need to develop a reliable approach to synthesize highly efficient visible-light-driven MT with a tailored structure. Several studies are currently focused on the synthesis of MT on graphene (GR) sheets due to the unique properties, such as excellent electron rich entity, large surface area, and unrivalled electrical conduction.12–14 Under UV or visible-light irradiation, the photocurrent generation of GR–TiO2 is superior to that of TiO2 because GR with the π–π conjugated structure of the carbon atoms can help in dispersion of e− or h+ reducing charge recombination.15–17 Thus, the addition of GR to bulk TiO2 has been observed to improve activity under visible-light irradiation for the degradation of dodecyl benzenesulfonate,18 methylene blue (MB),19 Eosin blue dye,20 and texbrite pollutants.21 However, little effort has seemingly been made to combine Ag, GR, and MT. Herein, a visible-light-driven MT catalyst is proposed, considering the synergistic effects of the GR support and Ag doping on the structure and photocatalytic activity of MT. A sol–gel and solvothermal method with the aid of a liquid-crystal template has been applied to fabricate MT modified by Ag together with graphene (MT-Ag/GR), thereby generating a catalyst with elaborate structure and high photoactivity. A photocatalytic mechanism for MB degradation by visible-light based MT-Ag/GR is proposed and possible reasons for the enhancement of visible-light photocatalytic efficiency are discussed. Additionally, to optimize the catalytic performance of MT-Ag/GR, the effects of catalyst amount, pH, and initial MB concentration have been examined as operational parameters.2. Experimental
2.1. Materials
Graphene oxide (GO) was purchased from Changsha FENHUA Materials Technology Corporation Limited, Changsha, People's Republic of China. Cetyl trimethylammonium bromide (CTAB, 99 wt%), and butyl titanate were purchased from Tianjin Guangfu Fine Chemical Research Institute. Absolute ethanol, silver nitrate, and concentrated nitric acid were purchased from Hunan Huihong Reagent Corporation Limited. All reagents were used as received without further purification.2.2. Fabrication of MT-Ag/GR
Firstly, cetyl trimethylammonium bromide (CTAB, 5.0 g) was mixed with ethanol (30 mL) and stirred steadily to form a liquid-crystal template (LCT) at ambient temperature. Subsequently, a solution of butyl titanate (25 mL) in absolute ethanol (50 mL) was slowly added to the LCT at a rate of one drop every 3 s and stirred for a certain time to form a titanium dioxide sol containing the LCT. Next, a solution of 7.0 mg AgNO3 in 5.0 mL ethanol and the 10 mL graphene oxide solution in ethanol (2.0 mg mL−1) were mixed and then slowly added to the titanium dioxide sol/LCT. Throughout the whole process, the solution was stirred until it formed a titanium dioxide gel. Subsequently, the obtained gel was dried at 65 °C and then calcined at 450 °C under the protection of nitrogen to prepare an MT-Ag/GR nanocomposite. Following a similar protocol, but without silver nitrate or GO, mesoporous titania combined with graphene (MT/GR) and Ag-doped mesoporous titania (MT-Ag) were synthesized.2.3. Characterization of the material
The crystalline phase of the obtained samples was identified by means of a Y-2000 X-ray diffractometer (Bruker, Germany) using Cu-Kα radiation from an 18 kV source. Low-angle XRD patterns were acquired on a Nano STAR X-ray diffractometer using Cu-Kα radiation from a 40 kV source. The Brunauer–Emmett–Teller (BET) specific surface area and pore size distribution of samples were measured from N2 adsorption/desorption isotherms determined at liquid-nitrogen temperature (77.3 K) on a Quantachrome Instruments Autosorb-1-C/TCD. PL spectra of the samples were acquired on a Varian Cary Eclipse spectrometer. The surface morphology and size of products was characterized by N3400 scanning electron microscopy (SEM) and JEM-2010F transmission electron microscopy (TEM). UV/Vis diffuse-reflectance spectra were recorded at room temperature on a Lambda 20 spectrophotometer (Perkin-Elmer, USA). Fourier transform infrared (FT-IR) spectrum was recorded on a Nicolet Is10 fourier red spectrometer (Nicolet, America). X-ray photoelectron spectroscopy (XPS) was performed on an instrument from Kratos Analytical Ltd. (England).2.4. Photocatalytic evaluation
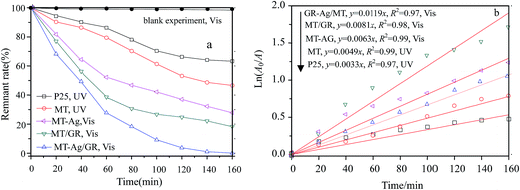
The photocatalytic reactor used has been described previously.22 The visible radiation source is a high-pressure Hg lamp with UV filter; the highest intensity of this lamp is in the region 450–900 nm. The suspension was placed in the reactor, and air was bubbled through it at a rate of 10.0 mL s−1 in order to maintain a homogeneous mixture. To establish an adsorption–desorption equilibrium, the suspension was continuously stirred for 30 min in the dark prior to irradiation. At given irradiation time intervals, 3 mL of the suspension was collected and subsequently centrifuged to remove the catalyst particles. The concentration was determined by measuring the maximum absorbance of MB at 664 nm with a TU-1810 spectrophotometer. To compare reaction rates among different catalysts, a pseudo-first-order rate equation was introduced as follows:
 | (1) |
 | (2) |
3. Results and discussion
3.1. Characterization of catalysts
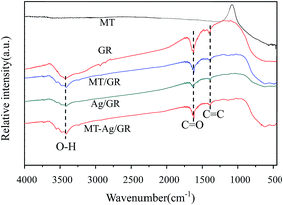
![[double bond, length as m-dash]](https://www.rsc.org/images/entities/char_e001.gif) O and C
O and C![[double bond, length as m-dash]](https://www.rsc.org/images/entities/char_e001.gif) C groups, respectively. The GR still contains some oxygen containing functionalities, which can induce interactions of GR with titania and Ag nanoparticles. Peaks at 2854 and 2927 cm−1 imply the presence of CH2 groups in GR. Notably, the intensity of CH2 decreases in GR-supported samples, which proves the successful interaction of GR to MT or Ag. The band in the range of 400–1000 cm−1 corresponds to the Ti–O stretching vibration of crystalline TiO2 phase,23 suggesting the existence of both Ti–O–Ti and Ti–O–C bonds in the composites. Moreover, the 400–1000 cm−1 line shape of MT-Ag/GR is the same as that of MT/GR, and different from that of Ag/GR. It obviously reveals the linkages between GR with MT in MT-Ag/GR mainly due to the low amount of the doped Ag.
C groups, respectively. The GR still contains some oxygen containing functionalities, which can induce interactions of GR with titania and Ag nanoparticles. Peaks at 2854 and 2927 cm−1 imply the presence of CH2 groups in GR. Notably, the intensity of CH2 decreases in GR-supported samples, which proves the successful interaction of GR to MT or Ag. The band in the range of 400–1000 cm−1 corresponds to the Ti–O stretching vibration of crystalline TiO2 phase,23 suggesting the existence of both Ti–O–Ti and Ti–O–C bonds in the composites. Moreover, the 400–1000 cm−1 line shape of MT-Ag/GR is the same as that of MT/GR, and different from that of Ag/GR. It obviously reveals the linkages between GR with MT in MT-Ag/GR mainly due to the low amount of the doped Ag.
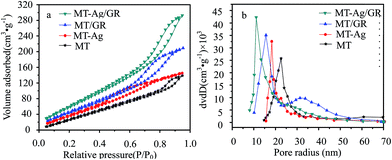
| Samples | SBET (m2 g−1) | Vt (cm3 g−1) | Pore radius (nm) | ˙OH concentration (%) | Ti3+ concentration (%) |
|---|---|---|---|---|---|
| MT | 129.729 | 0.206 | 22.620 | 11.7 | 4.6 |
| MT-Ag | 169.321 | 0.211 | 18.303 | 13.6 | 9.7 |
| MT/GR | 194.540 | 0.306 | 15.597 | 14.9 | 11.3 |
| MT-Ag/GR | 242.272 | 0.425 | 11.099 | 16.5 | 14.5 |
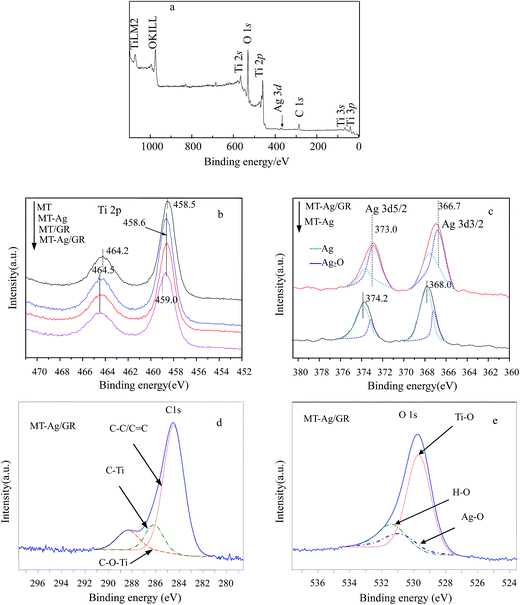
![[double bond, length as m-dash]](https://www.rsc.org/images/entities/char_e001.gif) C. The largest binding energy of about 284.8 eV is representative of C–C or C
C. The largest binding energy of about 284.8 eV is representative of C–C or C![[double bond, length as m-dash]](https://www.rsc.org/images/entities/char_e001.gif) C bonds in graphene. Peaks at higher binding energies can be assigned to oxygenated carbon species, such as C–O.34 Note that the content of oxygen functional groups significantly decreased after reduction during the sol–gel process. However, some of these oxygen functional groups remained after reduction of GO because MT/GO was not completely reduced to graphene. The presence of C–Ti bonds can be assigned to the combination of carbon and MT, and the intensity of the C–Ti signal of MT-Ag/GR was obviously stronger than that of MT, further demonstrating that GR was well supported on MT. The presence of Ti–O–C carbonaceous bonds at the sample interface has been attributed to coordination between carboxyl groups of GR and Ti(OH)x.35 The XPS O 1s signals corresponded to Ti–O at 529.8 eV and H–O at 531.5 eV (Fig. 8e). That at 529.8 eV was due to O2− ion in the TiO2 lattice, whereas the shoulder peak located at a binding energy of 531.5 eV can be attributed to the surface hydroxyl groups of chemisorbed water molecules on the titania.34,36 The hydroxyl concentration increased for these samples in the order: MT < MT-Ag < MT/GR < MT-Ag/GR, mainly due to their different surface areas (Table 1). The H–O concentration of MT-Ag/GR was apparently higher than those of the other photocatalysts, as a result of its large specific surface area, which can provide more space to store ˙OH radicals, thereby leading to higher photocatalytic activity.
C bonds in graphene. Peaks at higher binding energies can be assigned to oxygenated carbon species, such as C–O.34 Note that the content of oxygen functional groups significantly decreased after reduction during the sol–gel process. However, some of these oxygen functional groups remained after reduction of GO because MT/GO was not completely reduced to graphene. The presence of C–Ti bonds can be assigned to the combination of carbon and MT, and the intensity of the C–Ti signal of MT-Ag/GR was obviously stronger than that of MT, further demonstrating that GR was well supported on MT. The presence of Ti–O–C carbonaceous bonds at the sample interface has been attributed to coordination between carboxyl groups of GR and Ti(OH)x.35 The XPS O 1s signals corresponded to Ti–O at 529.8 eV and H–O at 531.5 eV (Fig. 8e). That at 529.8 eV was due to O2− ion in the TiO2 lattice, whereas the shoulder peak located at a binding energy of 531.5 eV can be attributed to the surface hydroxyl groups of chemisorbed water molecules on the titania.34,36 The hydroxyl concentration increased for these samples in the order: MT < MT-Ag < MT/GR < MT-Ag/GR, mainly due to their different surface areas (Table 1). The H–O concentration of MT-Ag/GR was apparently higher than those of the other photocatalysts, as a result of its large specific surface area, which can provide more space to store ˙OH radicals, thereby leading to higher photocatalytic activity.
3.2. Photocatalysis
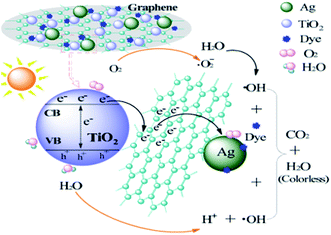
| MT + Ag/Ag2O + hυ → MT(h+) + Ag/Ag2O(e−) | (3) |
| MT(h+) + GR → MT + GR(h+) | (4) |
| GR(h+) + H2O → GR + ˙OH + H+ | (5) |
| Ag/Ag2O(e−) + O2 → Ag/Ag2O + O2˙− | (6) |
| O2˙− + H+ → HO2˙ | (7) |
| 2HO2˙ → O2 + H2O2 | (8) |
| H2O2 + O2˙− → ˙OH + OH− + O2 | (9) |
| ˙OH/O2˙−/Ag/Ag2O(h+) + dye → CO2 + H2O | (10) |
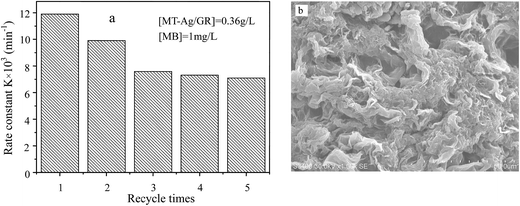 | ||
| Fig. 10 Recycling performance of MT-Ag/GR for MB degradation (a) and SEM image of used MT-Ag/GR (b). | ||
4. Conclusions
In this study, an MT-Ag/GR nanocomposite showing superior catalytic performance has been synthesized by a facile sol–gel and solvothermal method with the aid of a liquid-crystal template. It was noted that the incorporation of graphene and Ag can effectively improve the photocatalytic activity of TiO2 by increasing its adsorption property, inhibiting charge recombination, and reducing the band-gap energy. The MT-Ag/GR hybrid exhibited superior photocatalytic activity in the degradation of MB dye compared with bare MT, P25, MT-Ag, and MT/GR. Furthermore, the degradation capacity of MT-Ag/GR did not display any discernible decrease after four degradation cycles. The superior properties of the nanostructure could be related to the presence of graphene sheets with hole-accepting property and metallic silver with electron-trapping property, which decreases the photo-induced electron–hole recombination rate and broadens the light response range. A plausible mechanism for the degradation of MB by photocatalytic oxidation under visible light on MT-Ag/GR has been proposed. Additionally, the optimal conditions were identified as an MB concentration of 1 mg L−1 at pH 6 with an MT-Ag/GR concentration of 0.36 mg L−1. The dual incorporation of graphene with a unique porous structure and noble metals into semiconductor structures offers a promising strategy for fabricating highly active ternary nanostructured nanocomposites for water purification under solar irradiation.Acknowledgements
This work has been supported by the Natural Science Foundation of China (No. 21476095), and the Aid Program (Environment and Energy Materials and Deep Processing of Mineral Resources in Wuling Mountains) for Science and Technology Innovative Research Team in Higher Educational Institutions of Hunan Province.References
- J. G. Yu, Y. R. Su and B. Cheng, Template-Free Fabrication and Enhanced Photocatalytic Activity of Hierarchical Macro-/Mesoporous Titania, Adv. Funct. Mater., 2007, 17, 1984–1990 CrossRef CAS.
- J. G. Yu, L. J. Zhang, B. Cheng and Y. R. Su, Hydrothermal preparation and photocatalytic activity of hierarchically sponge-like macro-mesoporous titania, J. Phys. Chem. C, 2007, 111, 10582–10586 CAS.
- W. Zhou, F. F. Sun, K. Pan, G. H. Tian, B. J. Jiang, Z. Y. Ren, C. G. Tian and H. G. Fu, Well-ordered large-pore mesoporous anatase TiO2 with remarkably high thermal stability and improved crystallinity: preparation, characterization, and photocatalytic performance, Adv. Funct. Mater., 2011, 21, 1922–1930 CrossRef CAS.
- G. Li, C. Liu and Y. Liu, Different effects of cerium ions doping on properties of anatase and rutile TiO2, Appl. Surf. Sci., 2006, 253, 2481–2486 CrossRef CAS.
- A. Kumar and A. K. Jain, Photophysics and photochemistry of colloidal CdS–TiO2 coupled semiconductors – photocatalytic oxidation of indole, J. Mol. Catal. A: Chem., 2001, 165, 265–273 CrossRef CAS.
- X. H. Xia, Z. J. Jia, Y. Yu, Y. Liang, Z. Wang and L. L. Ma, Preparation of multi-walled carbon nanotube supported TiO2 and its photocatalytic activity in the reduction of CO2 with H2O, Carbon, 2007, 45, 717–721 CrossRef CAS.
- V. M. Daskalaki, P. Panagiotopoulou and D. I. Kondarides, Production of peroxide species in Pt/TiO2 suspensions under conditions of photocatalytic water splitting and glycerol photoreforming, Chem. Eng. J., 2011, 170, 433–439 CrossRef CAS.
- T. Sun, E. Z. Liu, J. Fan, X. Y. Hu, F. Wu, W. Q. Hou, Y. H. Yang and L. M. Kang, High photocatalytic activity of hydrogen production from water over Fe doped and Ag deposited anatase TiO2 catalyst synthesized by solvothermal method, Chem. Eng. J., 2013, 228, 896–906 CrossRef CAS.
- A. Ramchiary and S. K. Samdarshi, Ag deposited mixed phase titania visible light photocatalyst–Superiority of Ag-titania and mixed phase titania co-junction, Appl. Surf. Sci., 2014, 305, 33–39 CrossRef CAS.
- O. Rosseler, M. V. Shankar, M. K. L. Du, L. Schmidlin, N. Keller and V. Keller, Solar light photocatalytic hydrogen production from water over Pt and Au/TiO2 (anatase/rutile) photocatalysts: Influence of noble metal and porogen promotion, J. Catal., 2010, 269, 179–190 CrossRef CAS.
- Y. Z. Yang, C. H. Chang and H. Idriss, Photocatalytic production of hydrogen form ethanol over M/TiO2 catalysts (M = Pd, Pt or Rh), Appl. Catal., B, 2006, 67, 217–222 CrossRef CAS.
- W. G. Wang, J. G. Yu, Q. J. Xiang and B. Cheng, Enhanced photocatalytic activity of hierarchical macro/mesoporous TiO2–graphene composites for photodegradation of acetone in air, Appl. Catal., B, 2012, 119–120, 109–116 CrossRef CAS.
- G. D. Jiang, Z. F. Lin, C. Chen, L. H. Zhu, Q. Chang, N. Wang, W. Wei and H. Q. Tang, TiO2 nanoparticles assembled on graphene oxide nanosheets with high photocatalytic activity for removal of pollutants, Carbon, 2011, 49, 2693–2701 CrossRef CAS.
- N. Raghavan, S. Thangavel and G. Venugopal, Enhanced photocatalytic degradation of methylene blue by reduced graphene-oxide/titanium dioxide/zincoxide ternary nanocomposites, Mater. Sci. Semicond. Process., 2015, 30, 321–329 CrossRef CAS.
- A. K. Geim and K. S. Novoselov, The rise of graphene, Nat. Mater., 2007, 6, 183–193 CrossRef CAS PubMed.
- K. I. Bolotin, K. J. Sikes, Z. Jiang, M. Klima, G. Fudenberg, J. Hone, P. Kim and H. L. Stormer, Ultrahigh electron mobility in suspended graphene, Solid State Commun., 2008, 146, 351–355 CrossRef CAS.
- D. C. Marcano, D. V. Kosynkin, J. M. Berlin, A. Sinitskii, Z. Z. Sun, A. Slesarev, L. B. Alemany, W. Lu and J. M. Tour, Improved synthesis of graphene oxide, ACS Nano, 2010, 4, 4806–4814 CrossRef CAS PubMed.
- M. Shi, J. F. Shen, H. W. Ma, Z. Q. Li, X. Lu, N. Li and M. X. Ye, Preparation of graphene–TiO2 composite by hydrothermal method from peroxotitanium acid and its photocatalytic properties, Colloids Surf., A, 2012, 405, 30–37 CrossRef CAS.
- Y. J. Wang, R. Shi and T. Cordero, Significant photocatalytic enhancement in methylene blue degradation of TiO2 photocatalysts via graphene-like carbon in situ hybridization, Appl. Catal., B, 2010, 100, 179–183 CrossRef CAS.
- N. Prabhakarrao, M. Ravi Chandra and T. Siva Rao, Synthesis of Zr doped TiO2/reduced Graphene Oxide (rGO) nanocomposite material for efficient photocatalytic degradation of Eosin Blue dye under visible light irradiation, J. Alloys Compd., 2017, 694, 596–606 CrossRef CAS.
- P. Nuengmatcha, S. Chanthai, R. Mahachai and W. Oh, Sonocatalytic performance of ZnO/graphene/TiO2 nanocomposite for degradation of dye pollutants (methylene blue, texbrite BAC-L, texbrite BBU-L and texbrite NFW-L) under ultrasonic irradiation, Dyes Pigm., 2016, 134, 487–497 CrossRef CAS.
- Y. J. Li, X. M. Zhou, W. Chen, L. Y. Li, M. X. Zen, S. D. Qin and S. G. Sun, Photodecolorization of Rhodamine B on tungsten-doped TiO2/activated carbon under visible-light irradiation, J. Hazard. Mater., 2012, 227–228, 25–33 CrossRef CAS PubMed.
- Z. Jafari, N. Mokhtarian, G. Hosseinzadeh, M. Farhadian, A. Faghihi and F. Shojaie, Ag/TiO2/freeze-dried graphene nanocomposite as a high performance photocatalyst under visible light irradiation, J. Energy Chem., 2016, 25, 393–402 CrossRef.
- N. R. Khalid, E. Ahmed, M. Ahmad, N. A. Niaz, M. Ramzan, M. Shakil, T. Iqbal and A. Majid, Microwave-assisted synthesis of Ag–TiO2/graphene composite for hydrogen production under visible light irradiation, Ceram. Int., 2016, 42, 18257–18263 CrossRef CAS.
- Y. J. Li, S. Y. Zhang, Q. M. Yu and W. B. Yin, The effects of activated carbon supports on the structure and properties of TiO2 nanoparticles prepared by a sol–gel method, Appl. Surf. Sci., 2007, 253, 9254–9258 CrossRef CAS.
- F. A. Jumeri, H. N. Lim, Z. Zainal, N. M. Huang and A. Pandikumar, Titanium dioxide-reduced graphene oxide thin film for photoelectrochemical water splitting, Ceram. Int., 2014, 40, 15159–15165 CrossRef CAS.
- M. N. Rashed and A. A. El-Amin, Photocatalytic degradation of methyl orange in aqueous TiO2 under different solar irradiation sources, Int. J. Phys. Sci., 2007, 2, 73–81 Search PubMed.
- S. Qian, X. Y. Liu and C. X. Ding, Effect of Si-incorporation on hydrophilicity and bioactivity of titania film, Surf. Coat. Technol., 2013, 229, 156–161 CrossRef CAS.
- T. D. Nguyen-Phan, V. H. Pham, E. W. Shin, H. D. Pham, S. Kim, J. S. Chung, E. J. Kim and S. H. Hur, The role of graphene oxide content on the adsorption-enhanced photocatalysis of titanium dioxide/graphene oxide composites, Chem. Eng. J., 2011, 170, 226–232 CrossRef CAS.
- Y. Wang, Y. Huang, W. Ho, L. Zhang, Z. Zou and S. Lee, Biomolecule-controlled hydrothermal synthesis of C–N–S–tridoped TiO2 nanocrystalline photocatalysts for NO removal under simulated solar light irradiation, J. Hazard. Mater., 2009, 169, 77–87 CrossRef CAS PubMed.
- X. Fan, J. Fan, X. Y. Hu, E. Z. Liu, L. M. Kang, C. N. Tang, Y. N. Ma, H. T. Wu and Y. Y. Li, Preparation and characterization of Ag deposited and Fe doped TiO2 nanotube arrays for photocatalytic hydrogen production by water splitting, Ceram. Int., 2014, 40, 15907–15917 CrossRef CAS.
- B. Xin, L. Jing, Z. Ren, B. Wang and H. Fu, Effects of simultaneously doped and deposited Ag on the photocatalytic activity and surface states of TiO2, J. Phys. Chem. B, 2005, 109(7), 2805 CrossRef CAS PubMed.
- S. I. Mogal, V. G. Gandhi, M. Mishra, S. Tripathi, T. Shripathi, P. A. Joshi and D. O. Shah, Single-step synthesis of silver-doped titanium dioxide: influence of silver on structural, textural, and photocatalytic properties, Ind. Eng. Chem. Res., 2014, 53(14), 5749–5758 CrossRef CAS.
- N. D. Abazovic, L. Mirenghi, I. A. Jankovic, N. Bibic, D. V. Sojic, B. F. Abramovic and M. I. Comor, Synthesis and characterization of rutile TiO2 nanopowders doped with iron ions, Nanoscale Res. Lett., 2009, 4, 518–525 CrossRef CAS PubMed.
- P. Wang, J. Wang, T. S. Ming, X. F. Wang, H. G. Yu, J. G. Yu, Y. G. Wang and M. Lei, Dye-Sensitization-Induced Visible-Light Reduction of Graphene Oxide for the Enhanced TiO2 Photocatalytic Performance, ACS Appl. Mater. Interfaces, 2013, 5, 2924–2929 CAS.
- J. Zhu, F. Chen, J. Zhang, H. Chen and M. Anpo, Fe3+–TiO2 photocatalysts prepared by combining sol–gel method with hydrothermal treatment and their characterization, J. Photochem. Photobiol., A, 2006, 180, 196–204 CrossRef CAS.
- S. T. Nishanthi, S. Iyyapushpam, B. Sundarakannan, E. Subramanian and D. Pathinettam Padiyan, Plasmonic silver nanoparticles loaded titania nanotube arrays exhibiting enhanced photoelectrochemical and photocatalytic activities, J. Power Sources, 2015, 274, 885–893 CrossRef CAS.
- M. Selim, A. S. Shah, K. Zhang, A. Reum Park, K. S. Kim, N. G. Park, J. H. Park and P. J. Yoo, Single-step solvothermal synthesis of mesoporous Ag–TiO2–reduced graphene oxide ternary composites with enhanced photocatalytic activity, Nanoscale, 2013, 5, 5093–5101 RSC.
- P. Ciambelli, D. Sannino, V. Palma, V. Vaiano, R. S. Mazzei, P. Eloy and E. M. Gaigneaux, Photocatalytic cyclohexane oxidehydrogenation on sulphated MoOx/γ-Al2O3 catalysts, Catal. Today, 2009, 141(3–4), 367–373 CrossRef CAS.
- K. Eufinger, D. Poelman, H. Poelman, R. De Gryse and G. B. Marin, Effect of microstructure and crystallinity on the photocatalytic activity of TiO2 thin films deposited by dc magnetron sputtering, J. Phys. D: Appl. Phys., 2007, 40, 5232–5238 CrossRef CAS.
Footnote |
| † Electronic supplementary information (ESI) available. See DOI: 10.1039/c7ra02198d |
| This journal is © The Royal Society of Chemistry 2017 |

