 Open Access Article
Effect of textual features and surface properties of activated carbon on the production of hydrogen peroxide from hydroxylamine oxidation
Wei Song *,
Lin Yu
 ,
Xiaowei Xie,
Zhifeng Hao,
Ming Sun
 ,
Hongli Wen and
Yongfeng Li
School of Chemical Engineering and Light Industry, Guangdong University of Technology, Guangzhou 510006, PR China. E-mail: songw@gdut.edu.cn; songvvei@163.com; Tel: +86-20-39349149
First published on 11th May 2017
Abstract
Herein, the textural features and surface properties of activated carbon were mediated by oxidation in the gas-phase or liquid-phase. Activated carbon (AC) treated by gas-phase oxidation showed greatly enhanced production of hydrogen peroxide (H2O2) via hydroxylamine oxidation primarily because of the formation of more surface quinoid species. The yield and selectivity of H2O2 increased to 55% and 87%, respectively, which were much superior to those of the parent AC catalyst. Detailed structural and surface analyses revealed that gas-phase oxidation produced more quinoid but less carboxylic groups on activated carbon, and the opposite effect was observed for the samples treated by liquid-phase oxidation; this confirmed the crucial role of the quinoid groups on AC. Quantitative correlation of the relationship between the activity and the number of the surface quinoid groups further indicated the critical role of the quinoid groups, serving as intrinsic active species.
1. Introduction
Hydrogen peroxide (H2O2), an environmentally friendly oxidant, is widely used in chemical industries for textural processes, wastewater treatment, and green chemical synthesis due to its high oxidative efficiency and formation of water as the only by-product.1 With the rapidly increasing stringent legislation and public concerns about the environment, the demand for H2O2 is experiencing a persistent increase worldwide in the chemical field. However, the current industrial production of this unique green oxidant is accompanied by the generation of large amounts of waste. The well-established alkyl anthraquinone auto-oxidation (AO) process2 is actually a multi-step, energy consuming, and waste generating procedure. Additionally, the storage, transport, and handling of H2O2 in high-concentration increase the cost and safety problems. However, in many oxidative procedures, even a low concentration of H2O2 can meet the requirement of the reaction.3–6 In this context, based on the AO method, the simplification of the production process and its in situ use has attracted significant attention from the researchers.5,7–9 The most promising method is the direct production of H2O2 from molecular oxygen and hydrogen; however, the hazard of this explosive mixture and the lack of selective catalysts have obscured its industrial application to date.10–13Alternatively, oxidation of suitable hydrogen-containing compounds would be a practical route for the direct production of H2O2. Hydroxylamine (NH2OH) can be oxidized into H2O2 by O2 in an aqueous solution under ambient conditions and thus is viewed as a potentially alternative hydrogen resource.14 This reaction has been previously shown to have high TOF values using homogeneous manganese complexes as catalysts;15–17 however, it suffered from the difficulty of separating and recycling the homogeneous catalyst. Recently, supported noble metal particles, such as Au and Pd, have been reported to effectively catalyze this system;18–20 however, the high cost of noble metals and the production of H2O2 in low concentration (0.05–0.1 wt%) remain the major obstacles for their industrial applications.
Activated carbon (AC), which is rich in surface functional groups, is attracting extensive attention for use as a catalyst, instead of its conventional role as a support for dispersing metal particles. For example, AC has been applied for the oxidative dehydrogenation of hydrocarbons and dehydrogenation and dehydration of alcohols.21 The catalytic performance of ACs is typically assigned to the surface oxygen-containing groups, which are generally created upon oxidation treatments in either a gaseous or liquid phase. The former leads to carbons with a predominant population of quinoid groups, whereas the latter introduces large amounts of surface carboxylic groups.21
We have previously found that AC could be a promising catalyst for the direct production of H2O2 via NH2OH oxidation under ambient conditions,22 in which the catalytic performance of AC largely depends on the surface oxygen-containing groups, especially the quinoid groups. In this study, we comparatively examined the creation and modification of the surface functional groups by treating AC in gaseous and liquid phases with the aim to improve the surface concentration of the quinoid groups. The catalytic activity for the direct production of H2O2 over the modified AC catalyst correlated well with the number of surface quinoid groups.
2. Experiments
2.1. Surface modification of activated carbon
Herein, 10 g activated carbon (200–300 mesh, Aldrich) was initially treated with 100 mL of concentrated hydrochloric acid (HCl, 37%) to remove the inorganic impurities and ashes. The mixture was stirred at room temperature for 3 h, followed by thorough washing with hot water until the filtrate was free of Cl− (detected by AgNO3). The sample was dried at 110 °C overnight in vacuum, which was named AC. Then, the AC sample was oxidized with a 5 vol% O2/N2 mixture at 425 °C for 1, 3, 10, and 20 h, and the samples were accordingly named AC1, AC3, AC10, and AC20. In the liquid oxidation process, AC (3 g) was oxidized with 30 mL of concentrated H2SO4 at 150 °C or 3 M HNO3 at 95 °C for 3 h, or a saturated solution of (NH4)2S2O8 in 1 M H2SO4 at room temperature for 24 h. After this, the oxidized AC was thoroughly washed with hot water until the pH value of the filtrate was nearly neutral, and then, it was dried at 110 °C overnight in vacuum. The samples thus obtained were named ACS, ACN, and ACP.2.2. Characterization of the AC samples
Nitrogen adsorption–desorption isotherms were obtained using a Micrometrics ASAP 2000 instrument at −196 °C. Before the measurement, the sample was outgassed overnight at 150 °C. The specific surface area (SBET) was calculated via a multipoint Brunauer–Emmett–Teller (BET) analysis.Chemical titration for the quantitative analysis of acidic groups was based on the Boehm method.23 Herein, four series of AC samples (0.5 g) were first added to four flasks (150 mL). Then, 50 mL of 0.05 M sodium hydrogen carbonate (NaHCO3), sodium carbonate (Na2CO3), sodium hydroxide (NaOH), and sodium ethoxide (NaOC2H5) were added to the flasks. The flasks were then sealed and stirred at room temperature for 24 h. After recovering the solution via filtration, 10 mL of aliquots were titrated with 0.05 M of HCl, and the surface oxygenated groups were determined according to the following assumptions. NaHCO3 merely neutralizes carboxyl groups; lactones are determined by the difference between the groups neutralized by Na2CO3 and NaHCO3; phenols are estimated by the difference between the groups neutralized by NaOH and Na2CO3; and carbonyls/quinones are determined by the difference between the groups neutralized by NaOC2H5 and NaOH.24
The pH values of the suspension were measured by dispersing 0.4 g of carbon powder into 20 mL of water, and the suspensions were stirred overnight to achieve equilibrium.
Fourier transform infrared (FTIR) spectra of the AC samples were obtained via a Bruker Vector 22 spectrometer using a KBr pellet system containing 0.5 wt% of AC.
X-ray photoelectron spectroscopy (XPS) measurements were performed via an ESCALAB MK-II spectrometer (VG Scientific Ltd., UK) using an Al Kα radiation source with an acceleration voltage of 20 kV. The charge effect was corrected by adjusting the binding energy (BE) of C 1s to 285.0 eV. The surface atomic ratio of O/C was calculated from the peak areas and the sensitivity factors of the elements.25
Temperature-programmed desorption (TPD) was conducted using a U-type quartz tubular reactor connected to a quadrupole mass spectrometer (Omnistar, Balzers). The AC sample (40 mg) was loaded and heated to 900 °C at the rate of 10 °C min−1 under a helium flow (30 mL min−1), and the outlet gas was monitored by the mass spectrometer.
2.3. H2O2 production
The reaction of O2 and NH2OH was conducted in a jacketed glass reactor (100 mL) via stirring under ambient conditions (25 °C and atmospheric pressure), as described elsewhere.22 Typically, the reaction mixture contained 0.15 g of AC and 1.74 g (25 mmol) of hydroxylammonium chloride (NH2OH·HCl) in 50 mL of water. Before the addition of AC, the pH value of the NH2OH·HCl aqueous solution was maintained at 8.6 by adding proper amounts of a 1 M NaOH solution. O2 (25 mL min−1) was introduced through a mass flow controller into the reaction medium. Aliquots of the reaction mixture were periodically withdrawn, and the concentration of H2O2 was analyzed using the colorimetric method based on titanium(IV) sulphate.26 The yield of H2O2 was calculated on the basis of the reaction stoichiometry (2NH2OH + O2 = N2 + 2H2O + H2O2). The concentration of NH2OH·HCl was estimated by the colorimetric method using the ferric complexes of Fe(III)-1,10-phenanthroline.273. Results and discussion
3.1. Textural features
Fig. 1 shows the nitrogen adsorption–desorption isotherms and pore size distribution (PSD) of the AC samples. All the AC samples exhibited the characteristics of type I and IV isotherms, indicating the presence of both micropores and mesopores. There were three types of pores on the AC samples: mesopores (3.3 ± 0.5 nm), micropores (1.4 nm), and supermicropores (0.6 nm).28 Minor variations in the pore size and distribution were detected for the samples obtained by gas-phase oxidation, whereas a significant decrease in the pore size was observed for the samples that experienced liquid-phase oxidation. The gas-phase treatment did not alter the mesopores and micropores in the samples, whereas the liquid-phase oxidation remarkably decreased the mesopores and micropores, especially for the ACP sample. As shown in Table 1, the total surface area SBET, the mesoporous surface area Smes, and the microporous surface area (Smic) were 1729, 780, and 949 m2 g−1, respectively, for the parent AC. Accordingly, the micropore width dmic, the micropore volume Vmic, and the total pore volume Vtotal were estimated to be 1.87 nm, 0.695, and 1.609 cm3 g−1, respectively. The values of SBET and Vtotal for the AC samples treated by gas-phase oxidation initially increased to 1837 m2 g−1 and 1.757 cm3 g−1 for the AC1 sample, whereas slightly decreased to 1441 m2 g−1 and 1.287 cm3 g−1 for the AC20 sample with the increasing treatment time. Moreover, the dmic for AC samples treated by gas-phase oxidation slightly decreased from 1.87 to 1.73 nm. On the contrary, liquid-phase oxidation resulted in significant changes in the textural parameters. The SBET of the ACS, ACN, and ACP samples decreased to 1226, 1055, and 879 m2 g−1, respectively, whereas the corresponding Vtotal decreased to 0.912, 0.762 and 0.639 cm3 g−1. In particular, the ACP sample lost nearly three-quarters of its surface area (Smes) as compared to the parent AC. This suggests that the liquid-phase oxidation caused severe destruction of the textual structure of AC, whereas the gas-phase oxidation retained the textual feature of the parent AC.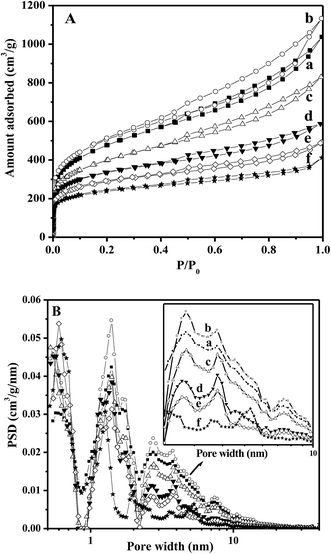 | ||
| Fig. 1 (A) N2 adsorption–desorption isotherms and (B) pore size distribution by density functional theory method for AC (a), AC1 (b), AC20 (c), ACS (d), ACN (e), and ACP (f) samples. | ||
| Catalysts | SBETa (m2 g−1) | Smicb (m2 g−1) | Smesb (m2 g−1) | Vmicb (cm3 g−1) | Vtotalc (cm3 g−1) | dmicd (nm) |
|---|---|---|---|---|---|---|
| a Multipoint BET.b Estimated by the t-plot method.c Calculated from the amount of gas adsorbed at the relative pressure of 0.997.d Micropore width calculated via the DR method. | ||||||
| AC | 1729 | 949 | 780 | 0.445 | 1.609 | 1.87 |
| AC1 | 1837 | 948 | 890 | 0.423 | 1.757 | 1.82 |
| AC3 | 1681 | 825 | 856 | 0.365 | 1.553 | 1.80 |
| AC10 | 1650 | 810 | 840 | 0.361 | 1.497 | 1.76 |
| AC20 | 1441 | 703 | 738 | 0.313 | 1.287 | 1.73 |
| ACS | 1226 | 800 | 427 | 0.348 | 0.912 | 1.68 |
| ACN | 1055 | 729 | 326 | 0.318 | 0.762 | 1.60 |
| ACP | 879 | 658 | 221 | 0.290 | 0.639 | 1.53 |
3.2. Surface properties
| Sample | pH | Content of surface groups (mmol g−1) | ||||
|---|---|---|---|---|---|---|
| Carboxylic | Lactonic | Phenolic | Carbonyl | Total acidic | ||
| Parent AC | 4.70 | 0.244 | 0.194 | 0.137 | 0.129 | 0.704 |
| AC1 | 4.09 | 0.135 | 0.420 | 0.505 | 0.056 | 1.116 |
| AC3 | 4.14 | 0.087 | 0.502 | 0.290 | 0.218 | 1.097 |
| AC10 | 3.99 | 0.138 | 0.458 | 0.410 | 0.220 | 1.226 |
| AC20 | 3.48 | 0.470 | 0.833 | 0.744 | 0.404 | 2.451 |
| ACS | 2.94 | 1.085 | 0.560 | 0.305 | 0.590 | 3.040 |
| ACN | 2.38 | 1.470 | 0.560 | 1.355 | 0.140 | 3.525 |
| ACP | 2.06 | 1.526 | 1.495 | 0.595 | 0.440 | 4.056 |
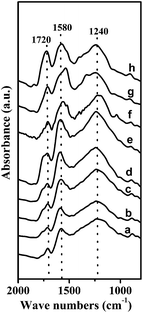
![[double bond, length as m-dash]](https://www.rsc.org/images/entities/char_e001.gif) C double bond in a quinone-like structure, while the band at 1720 cm−1 was due to the C
C double bond in a quinone-like structure, while the band at 1720 cm−1 was due to the C![[double bond, length as m-dash]](https://www.rsc.org/images/entities/char_e001.gif) O stretching vibration from lactones and carboxyl groups in the aromatic rings.29,30 Upon oxidation in the gas-phase and liquid-phase, the intensities of these typical bands enhanced to some extent, indicating the generation of large amounts of surface oxygen-containing groups. For the samples obtained by gas-phase oxidation, the increase in the band at 1720 cm−1 was relatively small at the early stages probably because of the partial removal of carboxylic groups from the carbon surface. However, as the gas-phase oxidation was extended to 20 h, the intensities of all the bands remarkably increased, suggesting the creation of more oxygen-containing groups. For the samples obtained by liquid-phase oxidation, the bands at 1720, 1580, and 1240 cm−1 were greatly enhanced, suggesting the enrichment with carboxyls, lactones, quinones, and phenols. The most intensive band at 1720 cm−1 was observed for the ACP sample, confirming that the carboxylic groups were further enriched by (NH4)2S2O8 oxidation. This result is in good agreement with those of the Boehm titrations and pH values. Thus, it can be concluded that more quinones were generated by gas-phase oxidation, whereas more carboxyls were created by liquid-phase oxidation.
O stretching vibration from lactones and carboxyl groups in the aromatic rings.29,30 Upon oxidation in the gas-phase and liquid-phase, the intensities of these typical bands enhanced to some extent, indicating the generation of large amounts of surface oxygen-containing groups. For the samples obtained by gas-phase oxidation, the increase in the band at 1720 cm−1 was relatively small at the early stages probably because of the partial removal of carboxylic groups from the carbon surface. However, as the gas-phase oxidation was extended to 20 h, the intensities of all the bands remarkably increased, suggesting the creation of more oxygen-containing groups. For the samples obtained by liquid-phase oxidation, the bands at 1720, 1580, and 1240 cm−1 were greatly enhanced, suggesting the enrichment with carboxyls, lactones, quinones, and phenols. The most intensive band at 1720 cm−1 was observed for the ACP sample, confirming that the carboxylic groups were further enriched by (NH4)2S2O8 oxidation. This result is in good agreement with those of the Boehm titrations and pH values. Thus, it can be concluded that more quinones were generated by gas-phase oxidation, whereas more carboxyls were created by liquid-phase oxidation.
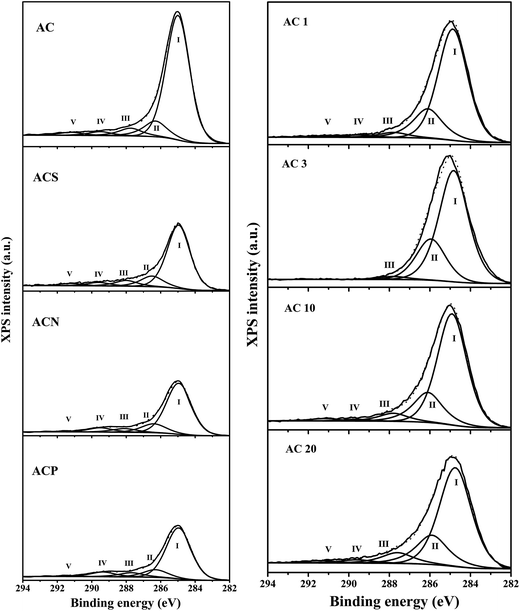
![[double bond, length as m-dash]](https://www.rsc.org/images/entities/char_e001.gif) O) and carboxylic (–COO–) groups. The area of peak IV of both the ACN (6.8%) and ACP sample (7.5%) was more than two times larger than that of the parent AC (2.8%), clearly demonstrating the generation of large amounts of surface oxygen-containing groups, especially the carboxylic groups. However, the areas of peak II for all the AC samples treated by liquid-phase oxidation were much smaller than those for the samples treated by gas-phase oxidation. Additionally, the surface O/C atomic ratio for the AC samples treated by liquid-phase oxidation was much more significantly enhanced than that for the samples treated by gas-phase oxidation. These results indicated that more carboxylic and less phenolic groups were produced by liquid-phase oxidation, being consistent with Boehm titration and IR measurements.
O) and carboxylic (–COO–) groups. The area of peak IV of both the ACN (6.8%) and ACP sample (7.5%) was more than two times larger than that of the parent AC (2.8%), clearly demonstrating the generation of large amounts of surface oxygen-containing groups, especially the carboxylic groups. However, the areas of peak II for all the AC samples treated by liquid-phase oxidation were much smaller than those for the samples treated by gas-phase oxidation. Additionally, the surface O/C atomic ratio for the AC samples treated by liquid-phase oxidation was much more significantly enhanced than that for the samples treated by gas-phase oxidation. These results indicated that more carboxylic and less phenolic groups were produced by liquid-phase oxidation, being consistent with Boehm titration and IR measurements.
| Sample | Functional groups/binding energy (eV) | O/C (%) | ||||
|---|---|---|---|---|---|---|
| Peak I | Peak II | Peak III | Peak IV | Peak V | ||
| C–graphite | C–O | C![[double bond, length as m-dash]](https://www.rsc.org/images/entities/char_e001.gif) O O |
–COO– | π–π* | ||
| 284.9–285.0 | 286.3–286.5 | 287.8–288.1 | 289.5 | 291.2 | ||
| AC | 78.8 | 10.9 | 5.4 | 2.7 | 2.2 | 7.3 |
| AC1 | 72.7 | 20.8 | 3.6 | 1.7 | 1.2 | 5.3 |
| AC3 | 71.9 | 26.2 | 1.9 | — | — | 5.2 |
| AC10 | 71.0 | 20.7 | 5.5 | 1.1 | 1.7 | 6.7 |
| AC20 | 66.8 | 21.3 | 7.8 | 2.4 | 1.7 | 11.7 |
| ACS | 72.9 | 12.7 | 7.1 | 4.4 | 2.9 | 14.0 |
| ACN | 73.2 | 13.2 | 5.7 | 6.8 | 1.2 | 22.5 |
| ACP | 73.1 | 11.4 | 6.7 | 7.5 | 1.3 | 25.1 |
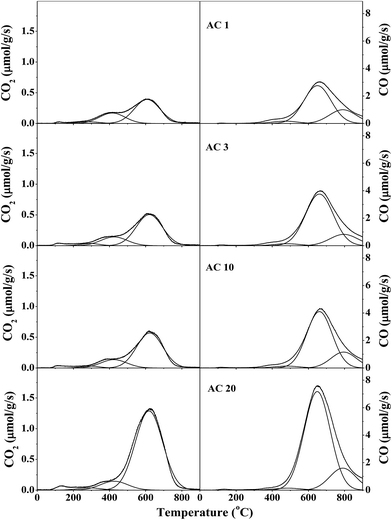
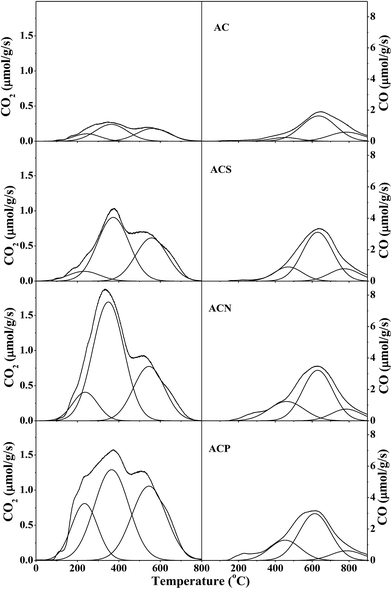
Table 4 presents the amounts of specific surface groups. The amounts of CO2 and CO desorbed from the parent AC were 598 and 3386 μmol g−1, respectively, whereas these increased to 1666 and 9688 μmol g−1 for the AC20 sample. Upon liquid-phase oxidation, the amounts of CO2 and CO desorbed on the ACP sample were significantly enhanced to 3707 and 6245 μmol g−1, respectively. These were similar to those for the ACN sample, but slightly larger than those for the ACS sample. Taking all these observations into account, it can be generally concluded that the largest amount of lactone (1465 μmol g−1), phenol (7783 μmol g−1), and carbonyl-quinone (1739 μmol g−1) groups were obtained for the AC20 sample via gas-phase oxidation, whereas the most enrichment of carboxyl (760 μmol g−1) and anhydride (1910 μmol g−1) was detected for the ACP and ACN samples, respectively. In other words, the moderate gas-phase oxidation generated more phenolic groups, whereas the liquid-phase oxidation created more carboxylic groups.
| Sample | CO2 desorption (μmol g−1) | CO desorption (μmol g−1) | ||||||
|---|---|---|---|---|---|---|---|---|
| Carboxyla | Anhydrideb | Lactonec | Total | Anhydrided | Phenole | Carbonyl-quinonef | Total | |
| a Desorption temperatures: −290 °C.b Desorption temperatures: 365–425 °C.c Desorption temperatures: 565–620 °C.d Desorption temperatures: 455–490 °C.e Desorption temperatures: 615–660 °C.f Desorption temperatures: 785–795 °C. | ||||||||
| Parent AC | 103 | 280 | 215 | 598 | 280 | 2283 | 823 | 3386 |
| AC1 | 26 | 181 | 415 | 622 | 181 | 3103 | 1128 | 4412 |
| AC3 | 29 | 154 | 547 | 730 | 154 | 4338 | 951 | 5443 |
| AC10 | 24 | 147 | 619 | 790 | 147 | 4342 | 1225 | 5713 |
| AC20 | 36 | 165 | 1465 | 1666 | 165 | 7783 | 1739 | 9688 |
| ACS | 166 | 1033 | 719 | 1918 | 1033 | 3839 | 973 | 5845 |
| ACN | 368 | 1910 | 875 | 3154 | 1910 | 3953 | 914 | 6778 |
| ACP | 760 | 1620 | 1327 | 3707 | 1620 | 3835 | 790 | 6245 |
3.3. H2O2 production
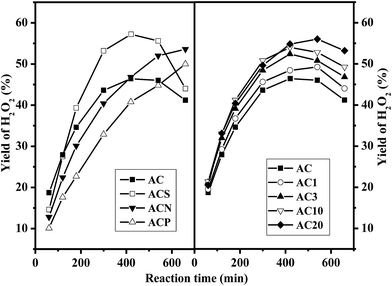
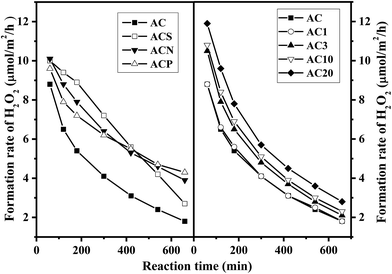
Fig. 6 shows the yield of H2O2 from NH2OH oxidation over the AC catalysts. On the parent AC, the yield of H2O2 remarkably increased during the initial stage and stabilized at around 46% after reaction for 420 min, followed by a slight decline due to H2O2 decomposition. Similar reaction patterns were observed for the AC samples prepared by gas-phase oxidation; however, the yield of H2O2 gradually approached 55% for the AC20 catalyst. For the AC samples prepared by liquid-phase oxidation, the maximum yield of H2O2 reached 57% on ACS catalyst at 420 min, whereas the yields of H2O2 for the ACN and ACP samples continuously increased and approached 53% and 47%, respectively, at 570 min. Fig. 7 shows the comparison of the rate of formation of H2O2 over the AC catalysts at 60 min. The rate of formation of H2O2 over the parent AC was 8.8 μmol m−2 h−1, and then, it rapidly decreased because of the consumption of NH2OH in the reaction medium. A similar trend was observed for all the AC samples, but the rate of formation of H2O2 was higher than that of the parent AC. In particular, the rate of formation of H2O2 was 4.3 μmol m−2 h−1 over the ACS catalyst at 660 min, which was much higher than that over the AC20 catalyst (2.8 μmol m−2 h−1), clearly demonstrating the higher initial activity of the AC20 catalyst and more stability of the ACS catalyst.Fig. 8 shows the conversion of NH2OH and the selectivity of H2O2 over the AC catalysts. Based on the similar conversion of NH2OH (∼47%), the selectivity of the AC catalysts prepared by gas-phase oxidation ranged from 70 to 87%. However, on the AC catalysts obtained by liquid-phase oxidation, the selectivity varied in the range from 66 to 82%. The highest selectivity of H2O2 was observed on the ACP catalyst, which was possibly induced by the lowest conversion of 23%. Thus, the presence of more reactive quinoid groups on the surface of the AC catalyst promoted not only the conversion of NH2OH but also the selectivity towards H2O2.
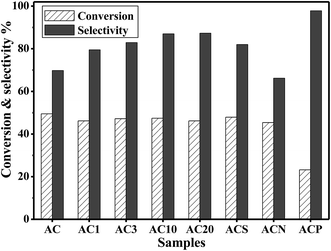 | ||
| Fig. 8 The conversion of NH2OH and the selectivity of H2O2 over the AC catalysts (temp. = 25 °C, pH = 8.6, and t = 180 min). | ||
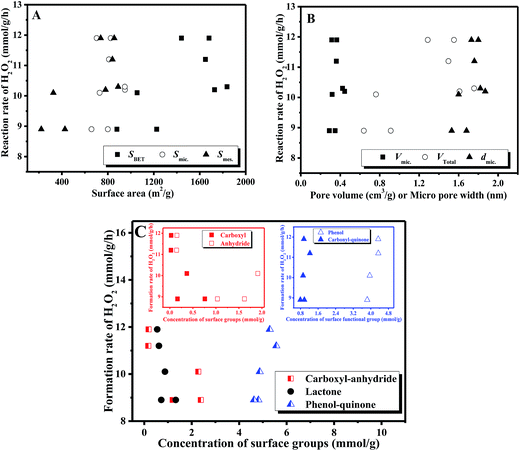
Fig. 9 correlates the rate of formation of H2O2 with the textural features and the surface functional groups on the AC catalysts. It was obvious that there was no direct correlation between the reaction rate and the surface area, the pore volume or micropore width. That is, the textural parameters did not affect the formation of H2O2. On the other hand, the correlation between the reaction rate and the surface oxygen-containing groups identified that the rate of formation of H2O2 almost linearly increased with the increase in the concentration of phenol-quinone groups, whereas the carboxyl-anhydride and/or lactone groups did not alter the reaction rates. Moreover, in our earlier work,22 H2O2 was still generated over the AC catalyst without carboxyl-anhydride groups via thermal treatment at 600 °C, whereas no H2O2 was detected on the AC surface without phenol and carbonyl-quinone groups via thermal treatment at 800 °C. This further confirmed our previous proposal that the surface oxygen groups, especially the quinoid (phenol and carbonyl-quinone) groups, on the AC catalysts played a crucial role in the production of H2O2.22 Clearly, the influences of quinoid groups on the rate of formation of H2O2 were more pronounced.
Additionally, H2O2 was generated in the homogeneous reaction system with Tiron (1,2-dihydroxybenzene-3,5-disulphonate, disodium salt) as the catalyst instead of AC.22 These results suggested that the quinoid species were the essential factors governing the catalytic activity of the ACs. To further identify the roles of the oxygen-containing species, a series of homogeneous reactions was performed under the same reaction conditions using the organic compounds containing carboxyl, phenol, quinone, or hydroquinone groups reported in our previous work.36 It was found that only Tiron, cyclohexa-2,5-diene-1,4-dione, and hydroquinone provided much higher yields of H2O2, whereas the H2O2 yields over benzoic acid, 2-hydroxybenzoic acid, 4-hydroxybenzoic acid, and benzene-1,3-diol were very low. As observed in Fig. 9(C), similar linear slopes between phenol and carbonyl-quinone indicated that phenol groups with hydroquinone structures participated in this reaction as active species. These explanations could be understood by the fact that the pairs of carbonyls at the edges of the carbon layers of a resonance structure behaved as quinones, whereas the pairs of hydroxyls acted as hydroquinones.21 Furthermore, the ratio of the rate of formation of H2O2/the number of phenol groups, namely turnover frequency (TOF), on different AC catalysts ranged from 2.3 to 2.7 h−1. In general, the surface oxygen-containing groups were considered as the active species in the catalytic reactions when the same TOF value could be obtained on different AC samples.
Therefore, the functional groups on the AC catalysts, particularly the quinoid groups, were the active species in the production of H2O2. These quinoid species in the carbon materials often serve as electron acceptors and redox mediators, and the quinone-hydroquinone system is usually involved in the redox mechanism.36 Herein, the quinonoid species on the ACs received electrons from the reductive substrate (NH2OH) and the reduced species, usually existing in the form of semiquinones or hydroquinones, and channeled the electrons to O2, accomplishing the redox cycle involved in the formation of H2O2. Hence, the higher performance of the AC20 catalyst could be reasonably and straightforwardly attributed to the surface richness of the quinoid groups.
4. Conclusions
Proper tuning of the textural structure and surface chemistry of activated carbons could efficiently promote the production rate of H2O2 via NH2OH oxidation. The textural features and the surface chemical properties of ACs were significantly modified by gas-phase or liquid-phase oxidation. Minor variations in the pore size and PSD were detected for the AC samples obtained by gas-phase oxidation, whereas a significant decrease in the total pore volume was observed for the AC samples obtained by liquid-phase oxidation.Gas-phase oxidation of activated carbon under mild conditions efficiently enriched the surface quinoid groups, which in turn promoted the yield and selectivity of H2O2 to 55% and 87%, respectively, on AC20. This corresponded to a H2O2 concentration of 0.47 wt%, which was not only much superior to that obtained on the supported noble metals (0.05–0.1 wt%)18–20 but also comparable to that obtained by the homogeneous manganese complexes catalysts.15–17 Liquid-phase oxidation of activated carbon generated more carboxyl groups, lowering the yield of H2O2. The quantitative correlation between the reaction rate and the number of surface oxygen-containing groups verified that the quinoid groups acted as the active species for NH2OH oxidation to H2O2.
Acknowledgements
This work was supported by the National Natural Science Foundation of China (2160309, 51678160) and the Startup Foundation for Doctors of Guangdong University of Technology (10313).References
- J. M. Campos-Martin, G. Blanco-Brieva and J. L. G. Fierro, Angew. Chem., Int. Ed., 2006, 45, 6962 CrossRef CAS PubMed.
- G. Goor, W. Kunkel and O. Weiberg, in UllmannCs Encyclopedia of Industrial Chemistry, ed. B. Elvers, S. Hawkins, M. Ravenscroft and G. Schulz, VCH, Weinheim, 1989, vol. A13, pp. 443–466 Search PubMed.
- C. Perego, A. Carati, P. Ingallina, M. A. Mantegazza and G. Bellussi, Appl. Catal., A, 2001, 221, 63 CrossRef CAS.
- M. G. Clerici and P. Ingallina, Catal. Today, 1998, 41, 351 CrossRef CAS.
- B. Puértolas, A. K. Hillb, T. García, B. Solson and L. T. Murciano, Catal. Today, 2015, 248, 115 CrossRef.
- S. Pathan and A. Patel, Appl. Catal., A, 2013, 459, 59 CrossRef CAS.
- Q. Chen and E. J. Beckman, Green Chem., 2008, 10, 934 RSC.
- J. A. Miller, L. Alexander, D. I. Mori, A. D. Ryabov and T. J. Collins, New J. Chem., 2013, 37, 3488 RSC.
- A. Asghar, A. A. A. Raman and W. M. A. W. Daud, J. Chem. Technol. Biotechnol., 2014, 89, 1466 CrossRef CAS.
- J. K. Edwards, S. J. Freakley, R. J. Lewis, J. C. Pritchard and G. J. Hutchings, Catal. Today, 2015, 248, 3 CrossRef CAS.
- J. K. Edwards, S. J. Freakley, A. F. Carley, C. J. Kiely and G. J. Hutchings, Acc. Chem. Res., 2014, 47, 845 CrossRef CAS PubMed.
- Y. Yi, L. Wang, G. Li and H. Guo, Catal. Sci. Technol., 2016, 6, 1593 CAS.
- C. Samanta, Appl. Catal., A, 2008, 350, 133 CrossRef CAS.
- M. N. Hughes and H. G. Nicklin, J. Chem. Soc. A, 1971, 1, 164 RSC.
- T. S. Sheriff, J. Chem. Soc., Dalton Trans., 1992, 6, 1051–1058 RSC.
- T. S. Sheriff, P. Carr and B. Piggott, Inorg. Chim. Acta, 2003, 348, 115 CrossRef CAS.
- T. S. Sheriff, P. Carr, S. J. Coles, M. B. Hursthouse, J. Lesin and M. E. Light, Inorg. Chim. Acta, 2004, 357, 2494 CrossRef CAS.
- V. R. Choudhary, P. Jana and S. K. Bhargava, Catal. Commun., 2007, 8, 811 CrossRef CAS.
- V. R. Choudhary and P. Jana, Catal. Commun., 2007, 8, 1578 CrossRef CAS.
- V. R. Choudhary and P. Jana, Appl. Catal., A, 2008, 335, 95 CrossRef CAS.
- J. L. Figueiredo and M. F. R. Pereira, in Carbon materials for catalysis, ed. P. Serp and J. L. Figueiredo, John Wiley & Sons, Inc., Hoboken, New Jersey, 2009 Search PubMed.
- W. Song, J. Li, J. Liu and W. Shen, Catal. Commun., 2008, 9, 831 CrossRef CAS.
- H. P. Boehm, Carbon, 1994, 32, 759 CrossRef CAS.
- F. J. López-Garzón, M. Domingo-García, M. Pérez-Mendoza, P. M. Alvarez and V. Gómez-Serrano, Langmuir, 2003, 19, 2838 CrossRef.
- J. L. Figueiredo, M. F. R. Pereira, M. M. A. Freitas and J. J. M. Órfão, Carbon, 1999, 37, 1379 CrossRef CAS.
- P. A. Clapp, D. F. Evans and T. S. Sheriff, Anal. Chim. Acta, 1989, 218, 331 CrossRef CAS.
- M. Yang, Huagong Xuebao, 1999, 16, 233 CAS.
- D. Prahas, Y. Kartika, N. Indraswati and S. Ismadji, Chem. Eng. J., 2008, 140, 32 CrossRef CAS.
- A. Macías-García, M. A. Díaz-Díez, E. M. Cuerda-Correa, M. Olivares-Marín and J. Gañan-Gómez, Appl. Surf. Sci., 2006, 252, 5972 CrossRef.
- G. de la Puente, J. J. Pis, J. A. Menéndez and P. Grange, J. Anal. Appl. Pyrolysis, 1997, 43, 125 CrossRef CAS.
- A. P. Terzyk, Colloids Surf., A, 2001, 177, 23 CrossRef CAS.
- D. V. Brazhnyk, Y. P. Zaitsev, I. V. Bacherikova, V. A. Zazhigalov, J. Stoch and A. Kowal, Appl. Catal., B, 2007, 70, 557 CrossRef CAS.
- A. Swiatkowski, M. Pakula, S. Biniak and M. Walczyk, Carbon, 2004, 42, 3057 CrossRef CAS.
- H. P. Boehm, Carbon, 2002, 40, 145 CrossRef CAS.
- U. Zielke, K. J. Hüttinger and W. P. Hoffman, Carbon, 1996, 34, 983 CrossRef CAS.
- W. Song, Y. Li, X. Guo, J. Li, X. Huang and W. Shen, J. Mol. Catal. A: Chem., 2010, 328, 53 CrossRef CAS.
| This journal is © The Royal Society of Chemistry 2017 |

