
 Open Access Article
 This Open Access Article is licensed under a
 Creative Commons Attribution 3.0 Unported Licence
Supramolecular interactions via hydrogen bonding contributing to citric-acid derived carbon dots with high quantum yield and sensitive photoluminescence†
Wenkai
Zhang‡
 a,
Lijuan
Shi‡
b,
Yingqiu
Liu
a,
Xianrui
Meng
a,
Hao
Xu
a,
Yuanqing
Xu
a,
Baoying
Liu
a,
Xiaomin
Fang
*a,
Hai-Bei
Li
*c and
Tao
Ding
*a
a,
Lijuan
Shi‡
b,
Yingqiu
Liu
a,
Xianrui
Meng
a,
Hao
Xu
a,
Yuanqing
Xu
a,
Baoying
Liu
a,
Xiaomin
Fang
*a,
Hai-Bei
Li
*c and
Tao
Ding
*a
aInstitute of Fine Chemistry and Engineering, Henan Engineering Laboratory of Flame-Retardant and Functional Materials, College of Chemistry and Chemical Engineering, Henan University, Kaifeng 475004, P. R. China. E-mail: xmfang@henu.edu.cn; dingtao@henu.edu.cn
bKey Laboratory of Coal Science and Technology of Ministry of Education and Shanxi Province, Taiyuan University of Technology, Taiyuan 030024, P. R. China
cSchool of Ocean, Shandong University, Weihai 264209, P. R. China. E-mail: lihaibei@sdu.edu.cn
First published on 7th April 2017
Abstract
Herein, we report the characterization of highly fluorescent citric-acid derived carbon dots (CACDs) synthesized by hydrothermal treatment of citric acid and diethylenetriamine below 200 °C. After being purified using a gel permeation chromatography cleanup system, the complexity and chemical composition of the CACDs were evaluated by liquid chromatography coupled with high-resolution Fourier transform ion cyclotron resonance mass spectrometry. The fluorophores consisted of five-membered ring fused 2-pyridones identified as the photoluminescence origin. M06-2X density functional calculations, surface tension and morphological studies suggested DETA@5CA serves as the main building block to fabricate supramolecular aggregates. Then we proposed that the dimeric and trimeric fluorophores coupled with DETA@5CA led to “dot” topologies in the CACDs solution under the effect of hydrogen bonding. In aqueous solution, the CACDs exhibited narrowly dispersed optical properties and a high fluorescent quantum yield (∼98%). Moreover, the supramolecular interaction induced CACDs have high sensitivity under various ambient conditions, such as pH, organic solvents and metal ions.
Introduction
Photoluminescent carbon dots (CDs) are increasingly being explored as novel fluorescent nanomaterials due to their strong fluorescence, low cytotoxicity, excellent water solubility and stable photoluminescence, which make them promising materials for applications in optoelectronic and energy devices, photocatalysts, sensors, and bioimaging.1–8 Various approaches have been developed to fabricate CDs including “top-down” and “bottom-up” methods. The “top-down” methods refer to carving bulk carbon materials into nanoparticles by using physical or chemical approaches, such as acid oxidation, electrochemical, and hydrothermal. Compared with top-down routes, the bottom-up routes have obvious advantages in adjusting the composition and physical properties of CDs by the careful selection of diverse organic precursors and carbonization conditions via thermal pyrolysis or carbonization. In recent years, citric acid (CA) has become one of the most frequently used bioproducts for the synthesis of CDs through bottom-up carbonization routes due to the direct process involved and high fluorescence quantum yields (QYs). Many CDs have been prepared from CA and amines via heating, hydrothermal methods or microwave assisted methods.9–18 However, because of the complex constituents of the synthesized CDs and consequently their undetermined chemical structures, there are ongoing debates over the origins of their fluorescence.9,19–22 Therefore, identifying the compositions and determining the related chemical structures are essential for resolving the fluorescence origins of citric acid derived carbon dots (CACDs). Lately, the possible origin of their luminescent properties has been revealed by isolation and identification of luminescent species from the CACDs. Detailed analyses confirmed the chemical structure as citric-acid derived organic molecules or fluorophores.11,21,23–25 A group of recent studies show that the photoluminescence (PL) intensity and quantum yields (Φ) of CACDs are diminished greatly as the pyrolysis of the CA–amine complex proceeds to the high temperature, because the strongly intense molecular fluorophore is gradually consumed as the building block of the much less photoluminescent carbogenic core.11,13,26,27 Therefore, low temperature (mainly below 200 °C) during pyrolysis seems to be the key to preserve the fluorescence.Oligomers or polymers have been also suggested to be dominant in the CACDs that are prepared through the condensation of CA and amines at low reaction temperatures.18 Different components in these CDs have synergistic effects; the oligomers or polymers can improve the solubility and PL emission of the fluorophore by stabilizing and increasing absorbance.10,14,28–30 Therefore, separation of the complex CDs is necessary to investigate the relationship of chemical structures and PL mechanism. However, these oligomers or polymers are probably difficult to be detected, because the chemical interactions among them are still unclear (maybe covalent bonding, supra-molecular interaction or even physical blending).10 Recently, based on the rational control of the noncovalent interactions, such as hydrogen bonds, electrostatic forces, van der Waals forces, hydrophobic interactions, dipole–dipole interactions and π–π stacking, a variety of self-assembled structures such as tubules, bers, micelles, vesicles and lamellae have been fabricated from the mixed aliphatic–amine systems.31–33 This suggests that the weak interactions play a special role in the fabrication and self-assembly of CA–amines complex, which provide a new horizon for advancing the research in CACDs.
In this work, we present a systematic study of the formation mechanism of carbon dots prepared from citric acid–amine system and demonstrate the self-assembly behaviors in the complex system. Following careful purification and determination methods, a single distinct fluorophore and supra-molecules DETA@5CA are isolated simultaneously. Combining the results of AFM, surface tension, 1H NMR, MS, and theoretical simulation, the supramolecular interactions via hydrogen bonding within DETA@5CA can be highly verified. Such CACDs featured as fluorophore bonded supra-molecules exhibit homogeneous and narrowly dispersed optical properties, as well as highly luminescence. In considering a range of practical applications, PL properties of CACDs in various ambient conditions, such as pH, organic solvent and metal ions, are also investigated.
Experimental section
Chemicals
Citric acid (CA) and diethylenetriamine (DETA) were purchased from Sigma-Aldrich. Ethanol and acetone were purchased from the Sinopharm Chemical Reagent Co., Ltd. Methanol (HPLC grade) was purchased from Dikma Company (Beijing, China). HPLC-grade water was obtained by the purification of deionized water using a Millipore Milli-Q system (Billerica, MA). The other reagents were analytical-grade.Preparation and extraction of citric-acid derived carbon dots (CACDs)
CACDs were synthesized by a hydrothermal treatment of citric acid and diethylenetriamine according to previous reports.15,16 In a typical procedure, 0.42 g of citric acid monohydrate (2 mmol) and 0.62 g of diethylenetriamine (6 mmol) were dissolved in 10 mL of water. The aqueous solution was transferred to a Teflon-equipped stainless-steel autoclave at X °C (X = 160, 180, 200) for 5 h. After that, the solution naturally cooled to room temperature. Next it was dried by rotary evaporation under reduced pressure and further dried under high vacuum, and then yellow viscous oil was obtained. Then the oil was rinsed with acetone, followed by supersonic expansion and centrifugation at 10![[thin space (1/6-em)]](https://www.rsc.org/images/entities/char_2009.gif) 000 rpm for 0.5 h. The precipitated material at the bottom of the centrifuge was vacuum dried at 65 °C to obtain brown powder of the CACDs-X (X represent hydrothermal temperature).
000 rpm for 0.5 h. The precipitated material at the bottom of the centrifuge was vacuum dried at 65 °C to obtain brown powder of the CACDs-X (X represent hydrothermal temperature).
Process of chromatographic separation
The CACDs-180 was selected to be separated by gel permeation chromatography cleanup system. The CACDs/methanol solution (1.0 mg mL−1) was filtered through 0.45 μm, 13 mm id cellulose acetate syringe filters (Alltech, Deerfield, IL, USA) prior to injection. Carbon dots separation was performed based on the following conditions by gel permeation chromatography cleanup system (GPC Cleanup 600, C18 column packed with octadecyl bonded silica, Beijing LabTech Instruments Co.). Elution conditions: mobile phase, H2O–MeOH (3:7, 5:5, 7:3, v/v); flow rate, 3 mL min−1; detection wavelength, 254 nm; injection volume, 5 mL. The eluted portions are collected and dried for determination by NMR and LC-HRMS.
Theoretical simulations
First-principles based simulations were performed at the density functional theory (DFT) level. The geometries of the fluorophore at the ground state and excited state were optimized at the PBE0/TZVP level, respectively. The frequency calculations at the same level were utilized to verify whether compound structures are local minimum on their potential energy surfaces. The solvent effect was considered with the polarizable continuum model. The time-dependent DFT method was used to calculate the excited states. Hybrid functional M062X and 6-311++G(d,p) basis set are applied to optimize the geometry of supra-molecules.34a All calculations were carried out using the Gaussian 09 package.34bCharacterization
High resolution microscopy measurements were performed using a JEM1200EX transmission electron microscopy (TEM) with an operating voltage of 120 kV. AFM images were measured with SPA400 (Seiko Instruments Inc.) on new cleaved mica surface in tapping mode in air. Fourier transform infrared spectroscopy (FT-IR) characterization was carried out on a BRUKE Vertex 70 FTIR spectrometer. The elemental contents of samples were measured on an FLASH2000HT (Germany). XRD patterns were recorded with a Bruker D8 Advance Diffractometer in the reflection mode using Cu Kα radiation (0.15418 nm). X-ray photoelectron spectra (XPS) was performed on a Thermo Fisher Scientific ESCALAB 250XI photoelectron spectrometer with Al Kα (hν = 1486.6 eV) as the X-ray source. 1H NMR and 13C NMR spectra were obtained on a Bruker AV-400 MHz spectrometer. UV-vis absorption spectra were recorded with a Hitachi U4100 Spectrometer. The PL spectra were recorded by a Hitachi F-7000 spectrophotometer, and the relative quantum yield (QY) of the CDs were measured via the slope method by using quinine sulfate (in 0.5 M H2SO4, Φ = 0.54) as a reference. For details in the mathematic calculation of quantum yields, please refer to the ESI.† The time-resolved PL spectra were performed with F980 spectrometer (Edinburgh Instruments, UK), equipped with a single photon photomultiplier detector (S900-R). The pulse width, wavelength, and repetition rate were chosen as 40 ps, 360 nm, and 5 MHz, respectively. Dynamic rheological measurements were performed using an Advanced Rheometric Expansion System (TA instruments, USA), using 25 mm diameter parallel plates in oscillatory shear mode. Dynamic storage modulus, G′, and dynamic loss modulus, G′′, were recorded as functions of angular frequency (ω) ranging from 0.01 to 100 rad s−1.Following GPC cleanup, HPLC analysis was performed on an Agilent 1200 HPLC system equipped with a G1322A pump and in-line diode array UV detector using a YMC-Pack ODS-AM column with CH3OH (0.1% of TFA) and water (0.1% of TFA) as the eluent. A high-resolution electrospray ionization-mass spectrometry (ESI-MS) was performed on a Solarix XR FTICR (Fourier transform ion cyclotron resonance) mass spectrometer equipped with a 7.0 T magnet (Bruker Daltonics, Billerica, MA, USA).
Results and discussion
Synthesis and characterization of the CACDs
The synthetic approach follows the controlled pyrolysis of CA and DETA at different temperatures (160 °C, 180 °C, and 200 °C) using the hydrothermal process, then viscous and yellow oil is obtained. The oil shows perfect Newtonian behavior as observed from the unity slope in the log frequency dependency of |η*|, and loss modulus dominate over storage modulus (G′) for the entire range of frequency (Fig. S1†), revealing the molecule-like nature for the CACDs.35 The temporal evolution of morphologies and heights of CACDs are traced by atomic force microscope (AFM) (Fig. 1). After pyrolysis at 160 °C for 4 h, no dots are detectable. Raising the temperature to 180 °C and 200 °C results in the emergence of dots with a mean height of 0.3 nm and 0.7 nm, respectively. A group of “dots” with a mean diameter of 3.1 nm are detectable from transmission electron microscopy image in spite of little mass-thickness contrast (Fig. S2†). It is proposed that bottom-up carbon nanodots are generated by thermal treatment of molecular precursors consecutively through polymerization, aromatization, nucleation, and growth.10,14,30 However, due to the lower hydrothermal temperature (<200 °C), only molecules or oligomer clusters should be formed. The FTIR spectra and X-ray photoelectron spectroscopy (XPS) measurement are performed to determine the composition of CACDs (Fig. S3 and S4†). The high-resolution N1s XPS spectrum can be fitted with two Gaussian peaks at 399.8 and 398.9 eV that correspond to the pyrrolic N17 and aromatic N,16 respectively. Existence of pyrrolic N indicates that N bonds with C in one five-membered-ring structure.15 Thermogravimetric analysis (TGA) of CACDs shows a weight loss around 74% up to 480 °C (Fig. S5†), which could be supplementary evidence revealing that CACDs is organic molecules in nature.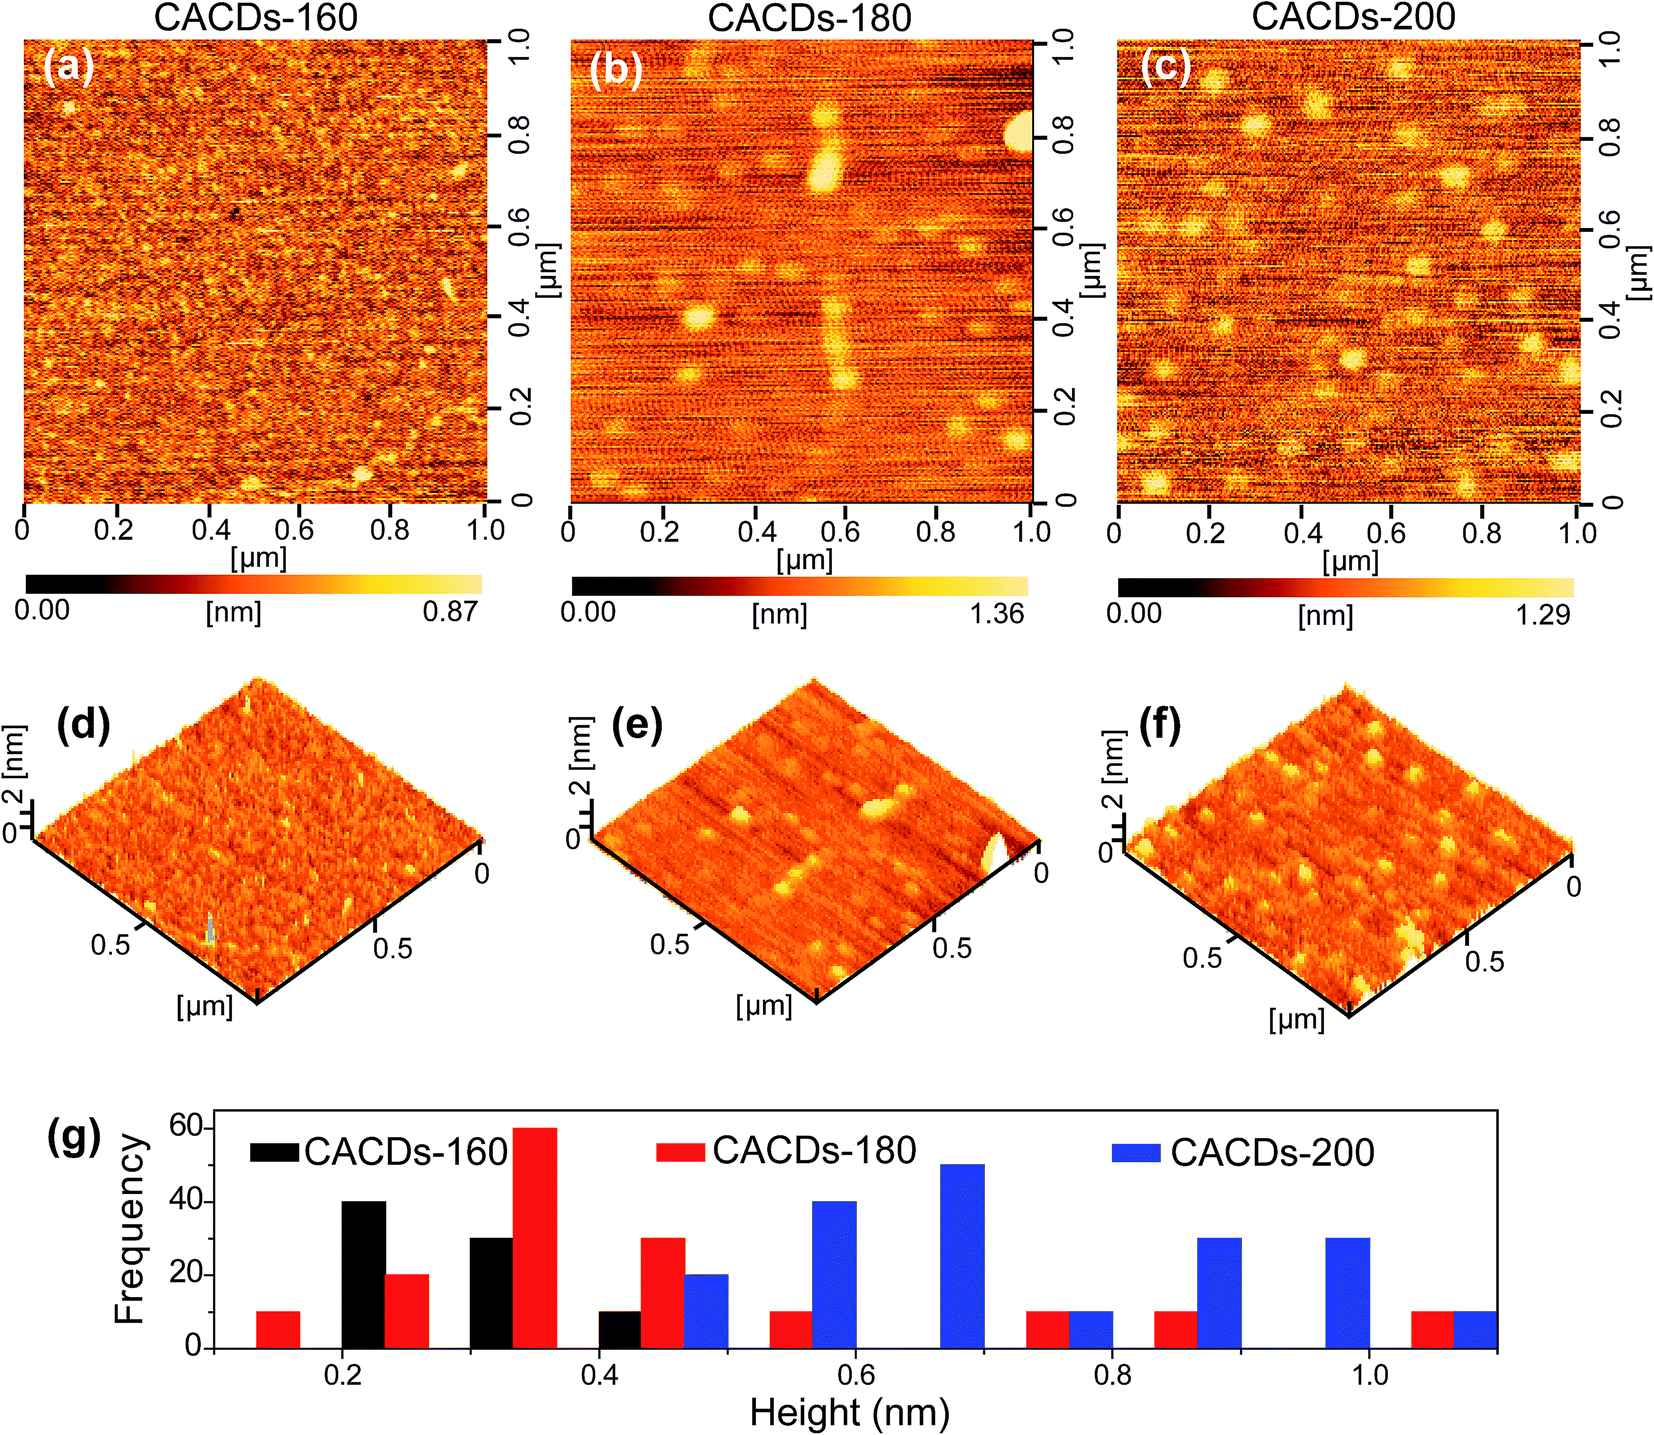 | ||
| Fig. 1 2D AFM height images (a–c), the 3D topographic images (d–f) and corresponding height distributions (g) of the CACDs produced from the thermal treatment of mixture of CA and DETA (a and d) 160 °C (b and e) 180 °C (c and f) 200 °C. | ||
Chromatographic separation of the CACDs
The as-prepared CACDs are separated by gel permeation chromatography cleanup system. The effect of MeOH content on the separation of the CACDs species is first investigated. When MeOH is 70% v/v, the separation of CACDs is unsatisfactory with two adjacent peaks. When the MeOH content is decreased to 30% v/v, multiple peaks is achieved (Fig. S6a†). Under UV 365 nm lamp illumination, the fraction ranging 0–10 min is blue luminescent while fraction ranging 10–20 min is nearly nonluminous (Fig. S6b†). The eluted portions with different retention time exhibit homogeneous and narrowly dispersed PL spectra, indicating simple and single PL species in CACDs (Fig. S6c†). In addition, the chromatograms show that lower organic solvent content tends to increase the retention of the CACDs species, suggesting that the chromatography separation of CACDs follows the typical reversed-phase separation behavior of solutes on a C18 column. Under the optimal eluting solvent program (H2O–MeOH (50/50, v/v)), the LC chromatogram splits into two peaks (labeled as I and II, Fig. 2a). To elucidate the molecular structures of the blue emissive species, the fraction I is collected and subjected to LC-HRMS analysis. High accuracy MS analyses of peak I show the presence of an ion with m/z = 224.1130 (Fig. 2b). The molecular formula of this ion is C10H14N3O3+ which correlates to chemical composition of the condensation product of CA and DETA by the loss of four H2O molecules. The molecular structure of fluorophore is quite consistent with 1-(2-aminoethyl)-5-oxo-1,2,3,5-tetrahydroimidazo[1,2-a]-pyridine-7-carboxylic acid (named as AEOIP). According to previous reports,21,24 the formation mechanism of this kind of compounds consists of formulation of an amide bond between CA and a,b-diamines and few intramolecular condensation steps (Fig. S7†). 1H NMR spectra also confirm the structure of AEOIP molecule (Fig. 2c). In addition, the dimer at m/z 447 (z = 1) and trimer at m/z 670 (z = 1) are observed among the successive ion peaks in the MS spectra, both of which tend to produce a fragment ion of the protonated monomer at m/z 224 (z = 1), suggesting that the CACDs species exist as supra-molecular clusters in the aqueous phase, and the monomers of 224 Da is certainly the repeating units of the clusters in the CACDs. The fraction II were also characterized by high-resolution MS analyses (Fig. 2d). Highly regular mass spacings of 96 Da are observed among the successive ion peaks in the MS spectra of peak II, and the MS peaks for m/z = 147, 244, 340, 436, 532, 628, 724 Da in Table 1 confirm the existence of the [(DETA@nCA)H2]2+ species. The HRMS analysis results reveal that no small molecules (e.g., water or NH3) are eliminated during the assembly process of the carboxylic acid and amino units, thus implying that a number of CA and a single DETA combine together via noncovalent interactions to fabricate self-assembled constructions, that is, DETA@nCA. 1H NMR spectrum further determines the molar ratio between DETA and CA molecules is 1:5 (Fig. 2e), which is consistent with the strongest MS peak of [(DETA@5CA)H2]2+ at m/z = 532.6486. Thus, it is hypothesized that DETA@5CA serves as the main building block to fabricate a kind of star-shaped supra-molecules.
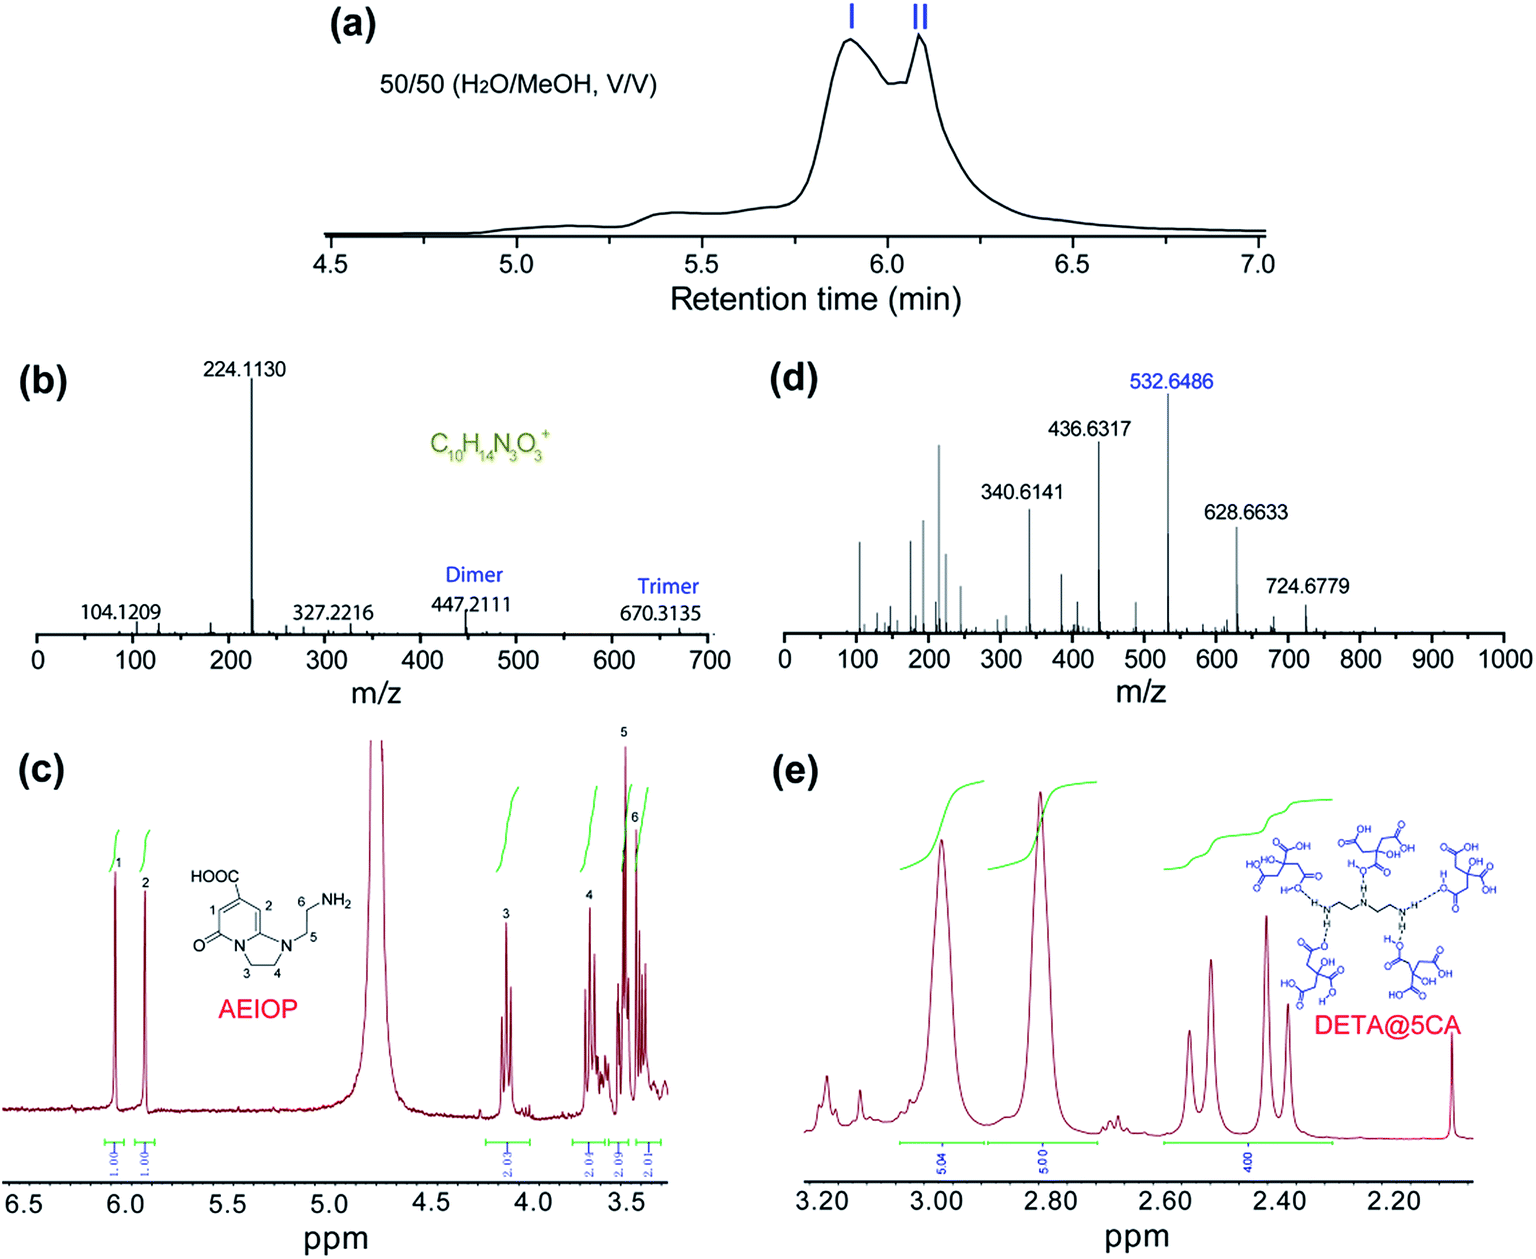 | ||
| Fig. 2 (a) Chromatograms for the elution of CACDs monitored by PDA at 254 nm. High resolution mass spectra (b and d) and 1HNMR spectra (c and e) of fraction I (b and c) and fraction II (d and e). | ||
| m/z | Species | m/z | Species |
|---|---|---|---|
| 104.1210 | [(DETA)H]+ | 340.6141 | [(DETA@3CA)H2]2+ |
| 147.0314 | [(DETA@CA)H2]2+ | 436.6317 | [(DETA@4CA)H2]2+ |
| 193.0380 | [(CA)H]+ | 532.6486 | [(DETA@5CA)H2]2+ |
| 215.0214 | [(CA)Na]+ | 628.6633 | [(DETA@6CA)H2]2+ |
| 244.7357 | [(DETA@2CA)H2]2+ | 724.6779 | [(DETA@7CA)H2]2+ |
Oligomeric aggregates and supramolecular interaction
As mentioned above, a series of supra-molecules are found in the chromatographic separation process of the CACDs. To understand the nature of these supra-molecular interactions, a structural and conformational study of AEIOP dimer and trimer, as well as DETA@5CA are carried out by using M06-2X density functional calculations. Fig. 3a and b show the minima state energy structures of AEIOP dimer and trimer after constrained optimization at the M06-2X/6-31++G(d,p) level of calculation is accomplished. It is found that the formation of a cyclic carboxylic acid dimer including two of C![[double bond, length as m-dash]](https://www.rsc.org/images/entities/char_e001.gif) O⋯H–O hydrogen bonds would seem an obvious choice for dimerizing AEIOP. In the trimeric fluorophores, two of CO⋯H–O and one of CO⋯H–N are found. And more importantly, the final structure energies of dimer and trimer stabilized by hydrogen bonds are 10 kcal mol−1 and 13 kcal mol−1 lower than that through π–π stacking, respectively (Fig. S8†). Thus, the formation of dimeric fluorophores or the trimeric fluorophores are mainly attributed to the hydrogen bonding between the carboxyl and amine groups. The local minima structure of DETA@5CA was also obtained after the optimization. Fig. 3c–e depict the same structure from different angles. It is noted that the calculated molecular dimension of supra-molecules DETA@5CA is around 0.8 nm × 1.2 nm × 1.7 nm. A total of fourteen hydrogen bonds are in the region among the DETA@5CA, including the existence of the six intermolecular O⋯H (1–6 in Fig. 3f), one intermolecular N⋯H (7), and seven intramolecular O⋯H (8–14). Hence it is reasonable to understand that hydrogen bonds are the most important contribution to the self-assemblies of DETA@5CA.
O⋯H–O hydrogen bonds would seem an obvious choice for dimerizing AEIOP. In the trimeric fluorophores, two of CO⋯H–O and one of CO⋯H–N are found. And more importantly, the final structure energies of dimer and trimer stabilized by hydrogen bonds are 10 kcal mol−1 and 13 kcal mol−1 lower than that through π–π stacking, respectively (Fig. S8†). Thus, the formation of dimeric fluorophores or the trimeric fluorophores are mainly attributed to the hydrogen bonding between the carboxyl and amine groups. The local minima structure of DETA@5CA was also obtained after the optimization. Fig. 3c–e depict the same structure from different angles. It is noted that the calculated molecular dimension of supra-molecules DETA@5CA is around 0.8 nm × 1.2 nm × 1.7 nm. A total of fourteen hydrogen bonds are in the region among the DETA@5CA, including the existence of the six intermolecular O⋯H (1–6 in Fig. 3f), one intermolecular N⋯H (7), and seven intramolecular O⋯H (8–14). Hence it is reasonable to understand that hydrogen bonds are the most important contribution to the self-assemblies of DETA@5CA.
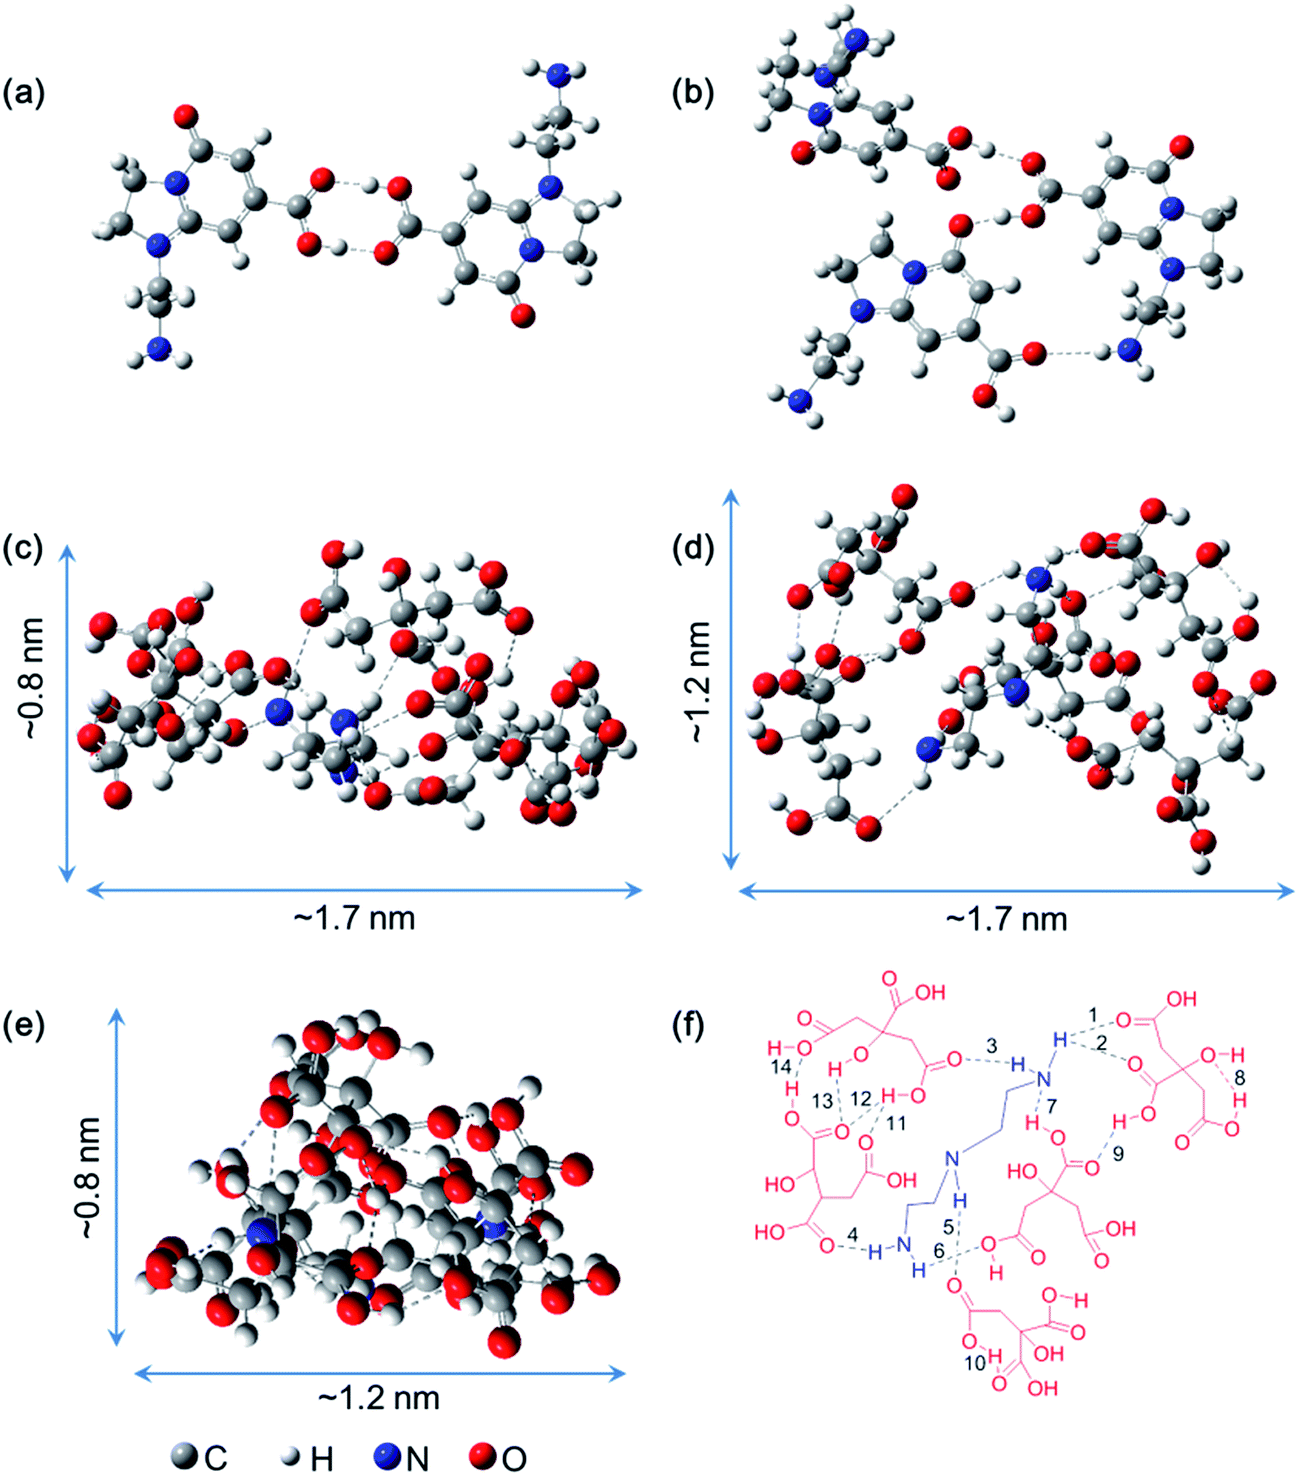 | ||
| Fig. 3 Optimized geometries of AEIOP dimer (a), trimer (b) and DETA@5CA (c–e) with minima energy at the M06-2X/6-31++G(d,p) level of theory, side view (c), top view (d) and end view (e). (f) The 2D representation for labelling groups of hydrogen bonds. All the hydrogen bonds are shown with dashed lines. | ||
To further verify the formation of supra-molecules DETA@5CA, surface tension and AFM are measured. The surface tension of the mixed solution of DETA and CA at the concentration of 10 mg mL−1 with diluted multiple is detected. As shown in Fig. 4a, the concentration of the mixed solution of DETA and CA is 2.5 times the critical aggregation concentration (CAC), indicating the construction of the supra-molecular assembly. As shown in Fig. 4b and c, the size distribution of aggregates formed in the mixed solution of DETA and CA at the concentration of 10 mg mL−1 is in the range of 0.7–2.5 nm, in accordance with the result of theoretical simulation. Combining the results of AFM, surface tension, 1H NMR, MS, and theoretical simulation, the formation of supra-molecules DETA@5CA can be highly verified.
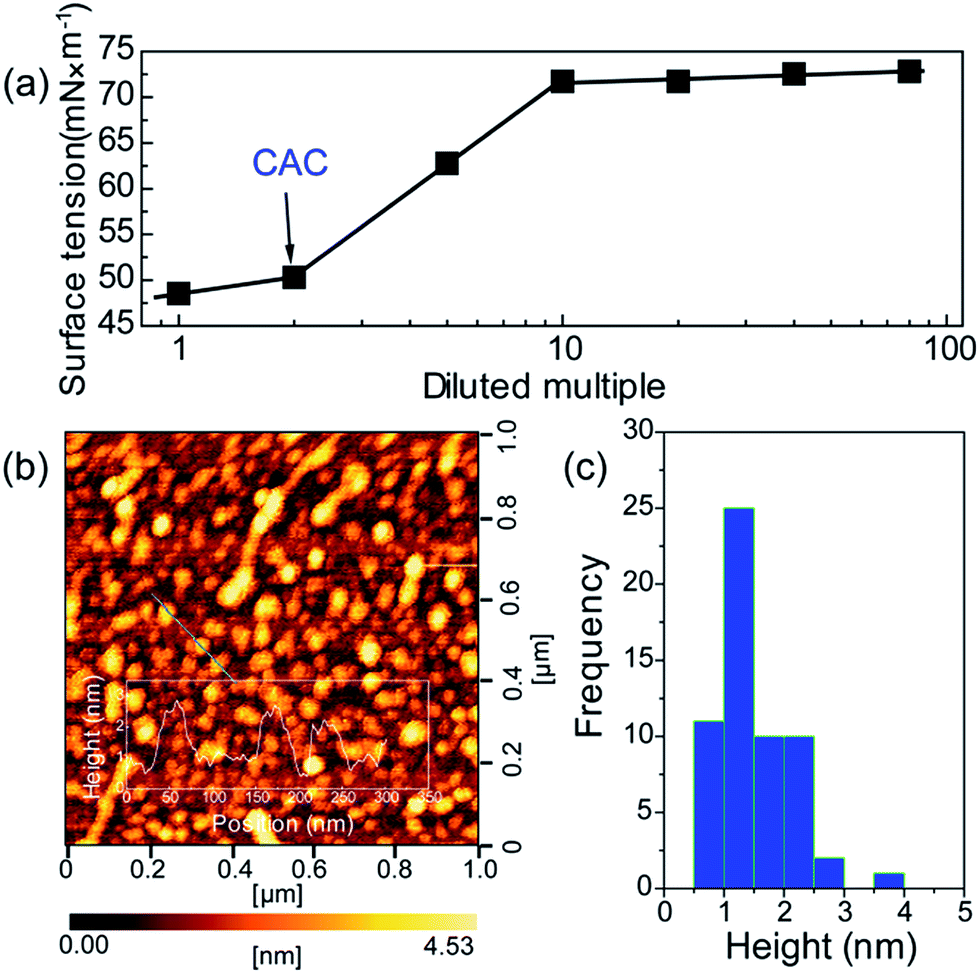 | ||
| Fig. 4 (a) Surface tension of the mixed solution of DETA and CA at the concentration of 10 mg mL−1 with diluted multiple at 25 °C micelle formation. (b) AFM topography image of CA–DETA mixed systems and sectional height profile along the line shows inset. (c) Height distribution estimated from (b). | ||
Photophysical properties of the CACDs
As mentioned above, DETA@5CA plays a key role in “dots” topology formation in the CACDs solution. Different components (fluorophores, oligomers or polymers) in carbon dots are proposed have synergistic effects; the oligomeric polymeric cluster can improve the PL emission homogeneity and stability of the fluorophore by stabilizing and increasing absorbance.10,21 We therefore now describe fully fledged photophysical assays conducted with as synthesized CACDs to understand the fundamental structure–property relationships for this type of material. Fig. 5a shows the optical spectra of the CACDs (0.01 mg mL−1). The absorption spectra display two intense absorption peaks at 238 and 354 nm, the former of which is ascribed to the π–π* transition of the nitrogen heterocyclic sp2 domain and the latter to the n–π* transition of the carbonyl bond. The emission band centers at λem = 433 nm and shows maximum intensity at λex = 355 nm. Particularly, the emission spectra of an aqueous solution of the CACDs are featured of λex-independent fluorescence (Fig. S9†), showing single, narrow, and nearly symmetric peaks at 434 nm with the maximum intensity at λex = 245 or 355 nm for a wide range of concentrations (Fig. 5b). PL emission of CACDs shows slightly redshift but only emission intensities decrease when sample concentration increases from 10−6 mg mL−1 to 1 mg mL−1, which is due to supra-molecules DETA@5CA effectively isolating the fluorophore and restraining the excimer formation (Fig. S10†). For the synthesis of CACDs, the absorption and PL spectra are very highly stable as the CA/DETA molar ratio, hydrothermal temperature and reaction time vary in a wide range (Fig. S11†). Simultaneously considering QY of the CDs, the optimal CA/DETA molar ratio, hydrothermal temperature and time are 1/3, 180 °C and 8 h, respectively. The relative QY is measured to be (98.0 ± 1.2)% relative to the slope method (Fig. 5c), which seems to top most of the citric acid-based carbon dots (Fig. S12†) in terms of fluorescence quantum yield. To confirm the emissive species in CACDs, time-resolved photoluminescence spectroscopy (TRPL) are acquired at different emission wavelengths that are excited at 360 nm (Fig. S13a†). The fluorescence spectral shape shows no changes with increasing delay time (Fig. S13b†), which is different from the spectral shifts found in other citric acid based CDs.9,19 This indicates that the emission spectrum originates from a single emissive species, that is, the fluorophore AEIOP. The PL decay of the CACDs is well explained by monoexponential decay functions, yielding a lifetime of 13.9 ns (Fig. 5d), and the PL lifetime also shows emission-independent and remains constant in the range from 380 to 500 nm (Fig. S13c†). This also suggests the fluorophore AEIOP is the PL origin within CACDs.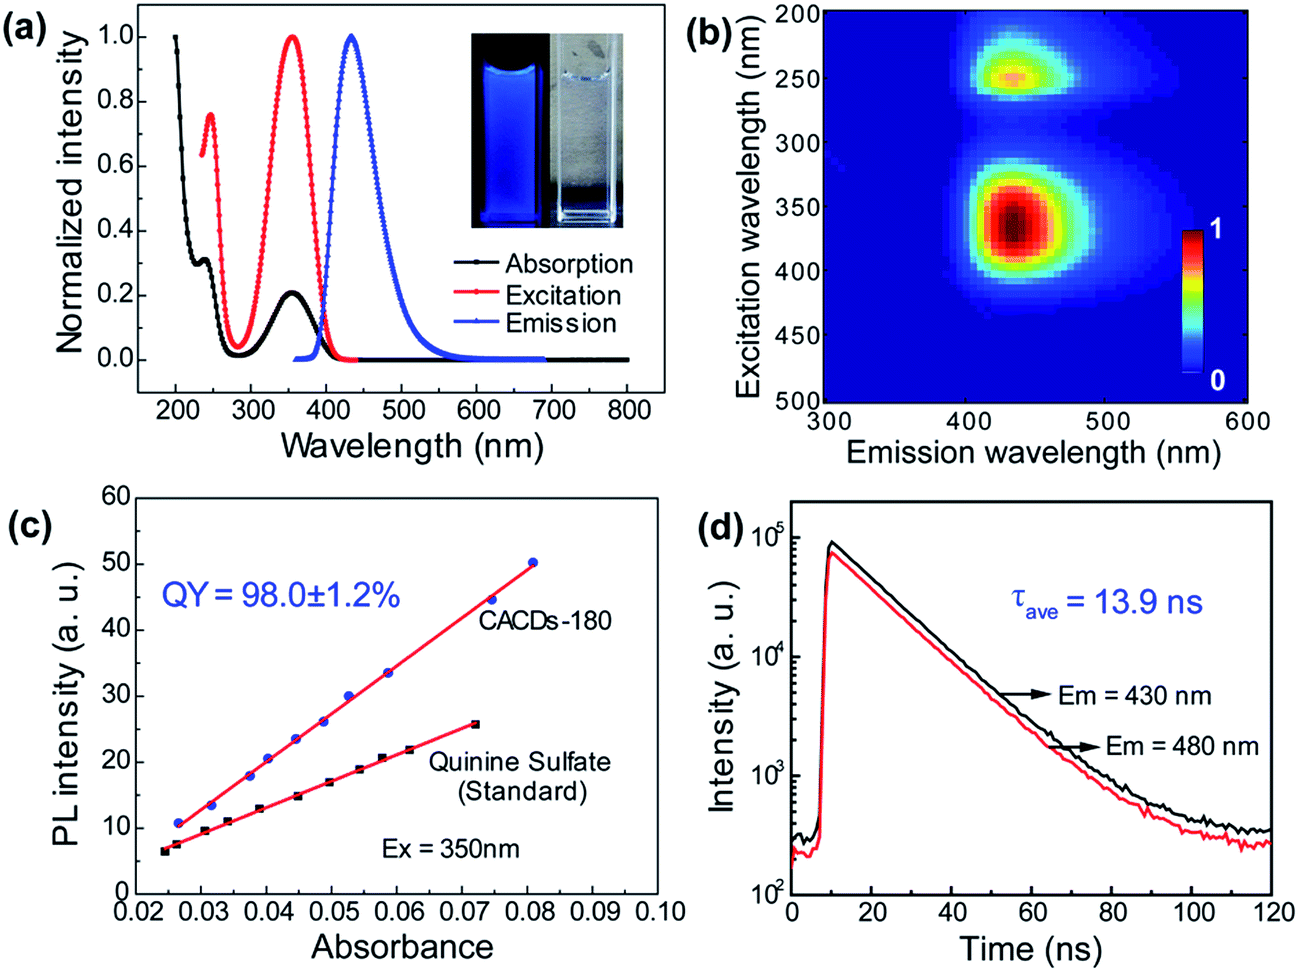 | ||
| Fig. 5 Optical characterization of carbon dots. (a) Absorption, PL excitation and emission spectra of CACDs; inset: photographs of CACDs solution under UV and daylight. (b) PL-excitation contour maps of CACDs in aqueous solutions at room temperature. Intensity rises from blue to green and to red. (c) Fitting line between fluorescence peak area and absorbance of the CACDs. The quinine sulfate solution as a reference is also displayed for QY calculation. (d) PL decay curves at different emission wavelengths. | ||
Density functional theory (DFT) calculations on fluorophore AEIOP are used to study possible relationships between structure and optical properties. The geometries of the fluorophore at the ground state and excited state were optimized at the PBE0/TZVP level, respectively. The frequency calculations at the same level were performed to verify that the structures obtained were local minimum on their potential energy surfaces. The solvent effect was considered with the polarizable continuum model. The AEOIP molecule presents a typical donor–π-conjugated–acceptor structure, showing almost no geometric changes from the ground state S0 to the first excited state S1 (Fig. 6a). The S0 to S1 transition for photoabsorption involves charge transfer from the five-membered ring in the highest occupied molecular orbital (HOMO) to the carboxyl group in the lowest unoccupied molecular orbital (LUMO), through the π-conjugated ring (Fig. 6b and c). The same charge transfer behavior is observed in the S1 to S0 transition for photoemission, exhibiting the typical push–pull process.36 Although there are only subtle geometric differences between the ground and excited states, we notice a relatively large Stokes shift from the photoabsorption peak at 374 to 462 nm for photoemission. This would effectively avoid photon reabsorption37 and hence ensures efficient photoluminescence. Furthermore, the predicted absorbance and PL spectra almost matched the experiment results (Fig. 6d).
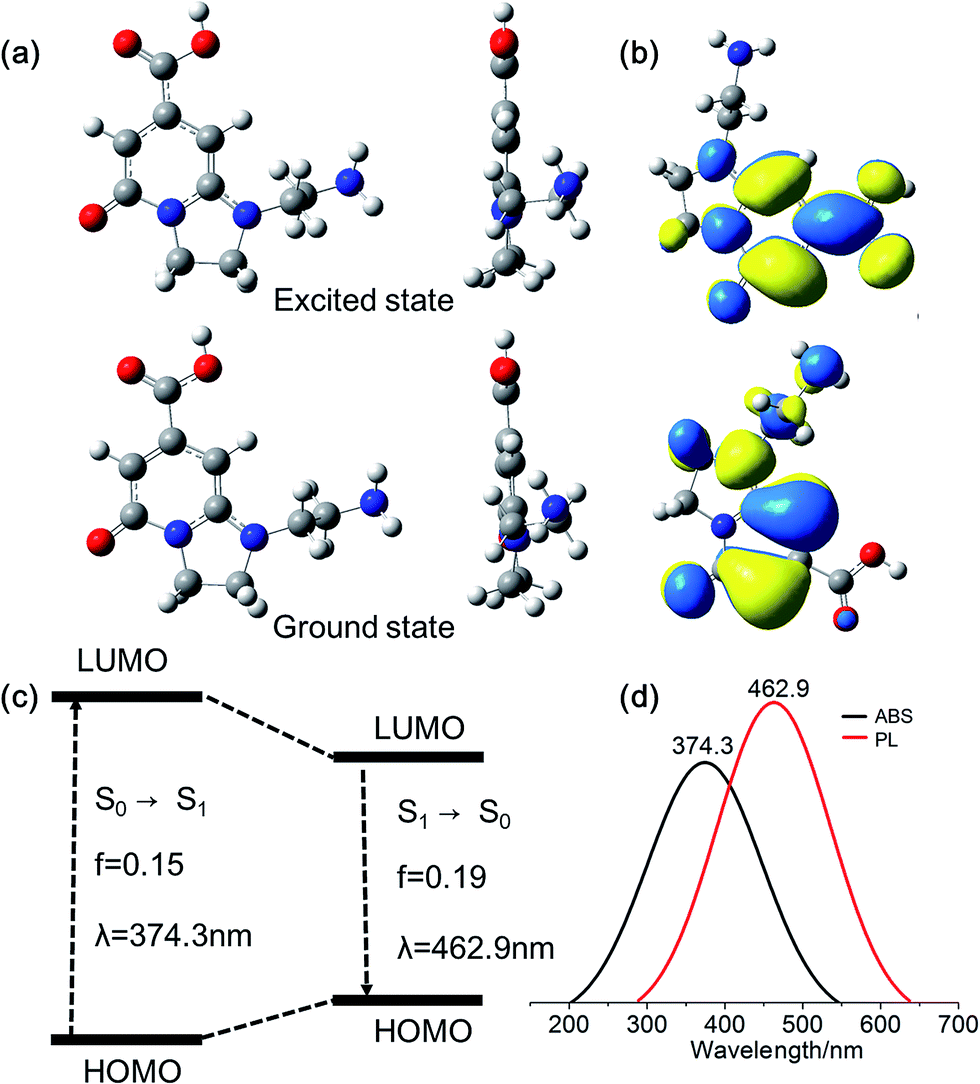 | ||
| Fig. 6 (a) Optimized geometry of AEOIP molecule in solution. (b and c) The electronic transitions between the ground (S0) and excited (S1) states as reflected by wave functions of frontier orbitals (transitions between HOMO and LUMO) in the single AEOIP molecule in aqueous solution. (d) Calculated absorption and fluorescence emission spectra from Gaussian calculations. | ||
Many research reveal that the photophysical properties can be tuned by external factors such as temperature, light and pH in the many molecular self-assembly systems which are mainly governed by hydrogen bonding interactions.38–40 This gave us a hint that the supramolecular interactions in these CACDs can be more favorable in practical applications. As seen in Fig. 7a, the emission intensity exhibits a plateau within the pH range from 3 to 14, but decreases abruptly at the low pH. The pH dependent fluorescence can be understood in terms of extensive protonation–deprotonation of the amide group given that the deprotonated amide groups have high electron-donating efficiency.41 Owing to the intrinsic polarity, the dots are dispersible in many hydrophilic solvents with the solubility in the order of H2O > CH3OH > C2H5OH > DMSO ≈ DMF > CH3COCH3 ≈ THF. Their Stokes shift respond with near linearity to ET(30), a measure of microscopic solvent polarity (Fig. 7b).42 Proton transfer appears to control the excited state properties of fluorophore since there is discontinuity in Stokes shift as a function of protic versus aprotic solvents. CACDs also exhibit high selectivity and specificity for the detection of metal ions owing to their strong affinity with amino groups, making them for sensitive and selective detection of metal ions. Fig. 7c shows that CACDs with Fe(III) system have the highest fluorescence quenching efficiency, as compared with CACDs with other ions including K+, Na+, Ca2+, Mg2+, Ba2+, Cu2+, Mn2+, Co2+, Cr3+, Sr3+, and Sn4+. Good linear relationship (0.04–0.8 mM) exists between PL intensity and Fe3+ concentration in Fig. S14.† As previously reported, when Fe3+ ions are added into the CACDs solution, they can coordinate with the –OH, –NH2, and –COOH groups on the surface of CACDs, and the electrons in the excited state of CACDs will transfer to the half-filled 3d orbits of Fe3+, facilitating nonradiative electron/hole recombination annihilation and leading to significant fluorescence quenching.43–45 Furthermore, continuous irradiation at 365 nm for 3 h resulted in less than a 10% change in its fluorescence emission (Fig. 7d), indicating the CACDs are sufficiently stable photochemically to be used routinely.
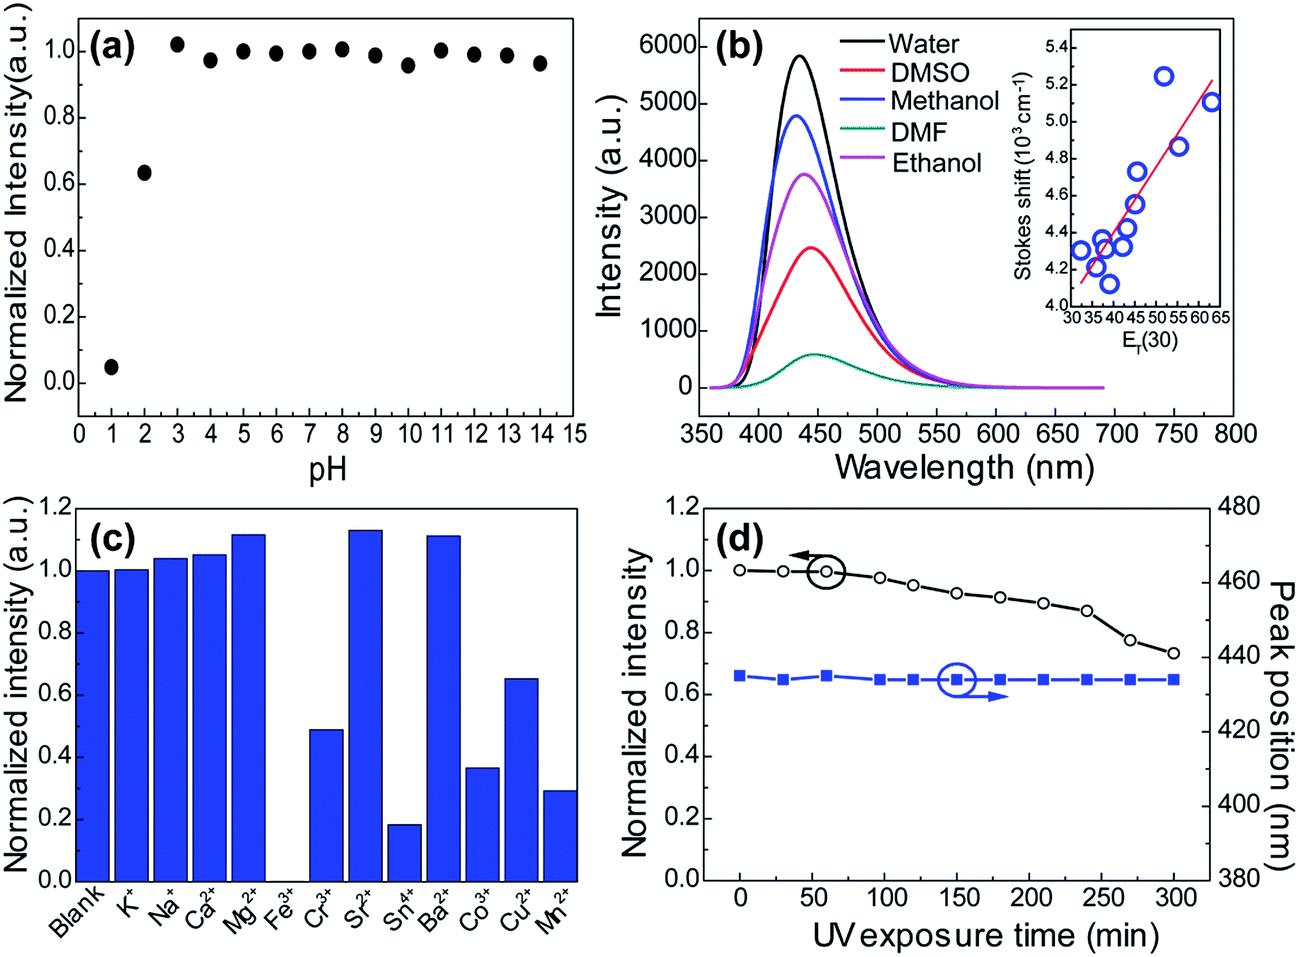 | ||
| Fig. 7 The effect of pH (a), solvent (b), metal ions (c), and UV exposure (d) on the fluorescence intensities of CACDs. Inset in (b): the Stokes shift were compared to published values of ET(30), a measure of microscopic solvent polarity. | ||
Conclusions
In summary, the chemical structure and PL origin of citric acid derived carbon dots (CACDs) is uncovered by special purification and determination methods. The relationship between supramolecular structure and “dots” morphology is analyzed, and the physical model is proposed. The CACDs are prepared by thermal treatment of citric-acid in the presence of DETA under mild and controlled conditions. Through purification by gel permeation chromatography cleanup system, the molecular fluorophore is isolated and its chemical structure is determined, that is, a five-membered ring fused 2-pyridone organics. The individual fluorophore monomer units link together through hydrogen bonding forces to produce dimer, trimer, etc. Moreover, a kind of star-shaped polymer DETA@5CA is also identified. Combining the results of AFM, surface tension and theoretical simulations, it was confirmed that hydrogen bonds are the most important contribution to the self-assemblies of DETA@5CA. Thus, we suggest that the dimeric and trimeric fluorophores coupled with DETA@5CA lead to “dots” topologies in the CACDs solution under the effect of hydrogen bonding. The CACDs thus synthesized exhibit homogeneous and narrowly dispersed luminescence. In aqueous solution, the CACDs exhibit QY as high as 98%. Time-resolved photoluminescence spectroscopy suggests that the CACDs emission originates from a single emissive species. It is also found that CACDs have high sensitivity in various ambient conditions, such as pH, organic solvent and metal ions. In the present systems, molecular fluorophores bonded with supra-molecules are important PL and morphological origin, which is very different with previous sp2-carbon networks and surface defects.Acknowledgements
The authors thank Minghua Lu for MS data analysis and fruitful discussion. This work was supported by the National Natural Science Foundation of China (51403051; 21502042; 21403127; 21403151), Key Project of the Education Department of Henan Province (16A150003) and the Science and Technology Development Program of Henan Province of China (162102210023; 142300410122). Hai-Bei Li thanks the Natural Science Foundation of Shandong Province, China (ZR2014BQ015), YSPSDUWH, and the supercomputing system in the Supercomputing Center, Shandong University, Weihai.References
- X. Wang, G. Sun, N. Li and P. Chen, Chem. Soc. Rev., 2016, 45, 2239 RSC.
- X. Li, M. Rui, J. Song, Z. Shen and H. Zeng, Adv. Funct. Mater., 2015, 25, 4929 CrossRef CAS.
- A. Zhao, Z. Chen, C. Zhao, N. Gao, J. Ren and X. Qu, Carbon, 2015, 85, 309 CrossRef CAS.
- V. Georgakilas, J. A. Perman, J. Tucek and R. Zboril, Chem. Rev., 2015, 115, 4744 CrossRef CAS.
- P. Miao, K. Han, Y. Tang, B. Wang, T. Lin and W. Cheng, Nanoscale, 2015, 7, 1586 RSC.
- C. Ding, A. Zhu and Y. Tian, Acc. Chem. Res., 2014, 47, 20 CrossRef CAS.
- Y. Wang and A. Hu, J. Mater. Chem. C, 2014, 2, 6921 RSC.
- K. Hola, Y. Zhang, Y. Wang, E. P. Giannelis, R. Zboril and A. L. Rogach, Nano Today, 2014, 9, 590 CrossRef CAS.
- N. Dhenadhayalan, K. C. Lin, R. Suresh and P. Ramamurthy, J. Phys. Chem. C, 2016, 120, 1252 CrossRef CAS.
- S. J. Zhu, X. H. Zhao, Y. B. Song, S. Y. Lu and B. Yang, Nano Today, 2016, 11, 128 CrossRef CAS.
- L. Shi, J. H. Yang, H. B. Zeng, Y. M. Chen, S. C. Yang, C. Wu, H. Zeng, O. Yoshihito and Q. Zhang, Nanoscale, 2016, 8, 14374 RSC.
- Y. Zhang, X. Liu, Y. Fan, X. Guo, L. Zhou, Y. Lv and J. Lin, Nanoscale, 2016, 8, 15281 RSC.
- J. Huang, M. Z. Rong and M. Q. Zhang, Phys. Chem. Chem. Phys., 2016, 18, 4800 RSC.
- Y. P. Hu, J. Yang, J. W. Tian and J. S. Yu, J. Mater. Chem. B, 2015, 3, 5608 RSC.
- D. Qu, M. Zheng, L. Zhang, H. Zhao, Z. Xie, X. Jing, R. E. Haddad, H. Fan and Z. Sun, Sci. Rep., 2014, 4, 5291 Search PubMed.
- X. Li, S. Zhang, S. A. Kulinich, Y. Liu and H. Zeng, Sci. Rep., 2014, 4, 4971 Search PubMed.
- Y. Dong, H. Pang, H. B. Yang, C. Guo, J. Shao, Y. Chi, C. M. Li and T. Yu, Angew. Chem., Int. Ed., 2013, 52, 7800 CrossRef CAS.
- Y. Dong, J. Shao, C. Chen, H. Li, R. Wang, Y. Chi, X. Lin and G. Chen, Carbon, 2012, 50, 4738 CrossRef CAS.
- V. Strauss, J. T. Margraf, C. Dolle, B. Butz, T. J. Nacken, J. Walter, W. Bauer, W. Peukert, E. Spiecker, T. Clark and D. M. Guldi, J. Am. Chem. Soc., 2014, 136, 17308 CrossRef CAS.
- S. Ghosh, A. M. Chizhik, N. Karedla, M. O. Dekaliuk, I. Gregor, H. Schuhmann, M. Seibt, K. Bodensiek, I. A. T. Schaap, O. Schulz, A. P. Demchenko, J. Enderlein and A. I. Chizhik, Nano Lett., 2014, 14, 5656 CrossRef CAS.
- Y. Song, S. Zhu, S. Zhang, Y. Fu, L. Wang, X. Zhao and B. Yang, J. Mater. Chem. C, 2015, 3, 5976 RSC.
- S. Wang, Z. Chen, I. Cole and Q. Li, Carbon, 2015, 82, 304 CrossRef CAS.
- W. Kasprzyk, S. Bednarz, P. Zmudzki, M. Galica and D. Bogdal, RSC Adv., 2015, 5, 34795 RSC.
- J. Zhang, L. Yang, Y. Yuan, J. Jiang and S. Yu, Chem. Mater., 2016, 28, 4367 CrossRef CAS.
- H. Peng, Y. Li, C. Jiang, C. Luo, R. Qi, R. Huang, C. Duan and J. Travas-Sejdic, Carbon, 2016, 100, 386 CrossRef CAS.
- M. J. Krysmann, A. Kelarakis, P. Dallas and E. P. Giannelis, J. Am. Chem. Soc., 2012, 134, 747 CrossRef CAS.
- S. Hu, A. Trinchi, P. Atkin and I. Cole, Angew. Chem., Int. Ed., 2015, 54, 2970 CrossRef CAS.
- Q. Hu, M. C. Paau, M. M. F. Choi, Y. Zhang, X. Gong, L. Zhang, Y. Liu and J. Yao, Electrophoresis, 2014, 35, 2454 CrossRef CAS.
- Q. Hu, X. Meng and W. Chan, Anal. Bioanal. Chem., 2016, 408, 5347 CrossRef CAS.
- L. Deng, X. L. Wang, Y. Kuang, C. Wang, L. Luo, F. Wang and X. M. Sun, Nano Res., 2015, 8, 2810 CrossRef CAS.
- L. Shi, N. Sun and L. Zheng, Chem. Commun., 2015, 51, 15700 RSC.
- C. Zhou, X. Cheng, O. Zhao, S. Liu, C. Liu, J. Wang and J. Huang, Soft Matter, 2014, 10, 8023 RSC.
- L. Shi, P. Sun and L. Zheng, Soft Matter, 2016, 12, 8682 RSC.
- (a) Y. Zhao and D. G. Truhlar, Theor. Chem. Acc., 2008, 120, 215–241 Search PubMed; (b) M. J. Frisch, G. W. Trucks, H. B. Schlegel, G. E. Scuseria, M. A. Robb, J. R. Cheeseman, J. A. Montgomery Jr, T. Vreven, K. N. Kudin, J. C. Burant, J. M. Millam, S. S. Iyengar, J. Tomasi, V. Barone, B. Mennucci, G. Scalmani, M. Cossi, N. Rega, G. A. Petersson, H. Nakatsuji, M. Hada, M. Ehara and K. Toyota, et al., Gaussian 09, revision A02, Gaussian Inc., Wallingford, 2009 Search PubMed.
- F. Wang, Z. Xie, B. Zhang, Y. Liu, W. Yang and C. Liu, Nanoscale, 2014, 6, 3818 RSC.
- H. Nie, M. Li, Q. Li, S. Liang, Y. Tan, L. Sheng, W. Shi and S. X. Zhang, Chem. Mater., 2014, 26, 3104 CrossRef CAS.
- F. R. Baptista, S. A. Belhout, S. Giordani and S. J. Quinn, Chem. Soc. Rev., 2015, 44, 4433 RSC.
- X. T. Zheng, A. Ananthanarayanan, K. Q. Luo and P. Chen, Small, 2015, 11, 1620 CrossRef CAS.
- W. Zhang, Y. Liu, X. Meng, T. Ding, Y. Xu, H. Xu, Y. Ren, B. Liu, J. Huang, J. Yang and X. Fang, Phys. Chem. Chem. Phys., 2015, 17, 22361 RSC.
- C. Reichardt, Chem. Rev., 1994, 94, 2319 CrossRef CAS.
- T. Beppu, K. Tomiguchi, A. Masuhara, Y. Pu and H. Katagiri, Angew. Chem., Int. Ed., 2015, 54, 7332 CrossRef CAS.
- W. Zhang, D. Dai, X. Chen, X. Guo and J. Fan, Appl. Phys. Lett., 2014, 104, 091902 CrossRef.
- M. Zhou, Z. L. Zhou, A. H. Gong, Y. Zhang and Q. J. Li, Talanta, 2015, 143, 107–113 CrossRef CAS.
- Y. Zhang, L. Wang, H. Zhang, Y. Liu, H. Wang, Z. Kang and S. Lee, RSC Adv., 2013, 3, 3733–3738 RSC.
- S. Li, Y. Li, J. Cao, J. Zhu, L. Fan and X. Li, Anal. Chem., 2014, 86, 10201–10207 CrossRef CAS.
Footnotes |
| † Electronic supplementary information (ESI) available: Rheological tests, transmission electron microscopy (TEM), FTIR spectra, X-ray photoelectron spectroscopy (XPS), thermogravimetric analysis, chromatographic separation, PL versus concentration, QY measurement methods, QYs versus synthesis conditions, QY in comparison with previously reported values, effect of NaCl and Fe(III) on the PL, and time resolved photoluminescence spectra. See DOI: 10.1039/c7ra02160g |
| ‡ These authors contributed equally to this work. |
| This journal is © The Royal Society of Chemistry 2017 |