 Open Access Article
Creative Commons Attribution 3.0 Unported Licence
Influence of normal load on the three-body abrasion behaviour of monocrystalline silicon with ellipsoidal particle†
Junqin Shi a,
Juan Chena,
Xinqi Weia,
Liang Fang
 *a,
Kun Sun*a,
Jiapeng Sunb and
Jing Han
 c
c
aState Key Laboratory for Mechanical Behavior of Materials, Xi'an Jiaotong University, Xi'an, 710049, China. E-mail: fangl@xjtu.edu.cn; sunkun@mail.xjtu.edu.cn
bCollege of Mechanics and Materials, Hohai University, Nanjing 210098, China
cSchool of Mechanical and Electrical Engineering, China University of Mining and Technology, Xuzhou 221116, China
First published on 15th June 2017
Abstract
Currently, monocrystalline silicon has been widely applied in micro-electro-mechanical systems (MEMSs). It is of importance to reveal the wear behavior of the MEMS and evaluate the planarization of silicon surface in chemical mechanical polishing (CMP). In this study, molecular dynamics simulation was used to investigate the nano three-body abrasion of monocrystalline silicon with a diamond ellipsoidal particle sandwiched between two silicon specimens. The normal load acting on the ellipsoidal particle was varied from 80 nN to 240 nN. Results indicate that the movement pattern of the particle changes from rolling to sliding when the normal load becomes greater than 160 nN. Using the criterion of particle movement pattern by comparing the value of e/h and coefficient of friction, the particle movement pattern can be accurately predicted. The evolution of force in the abrasion process depicts both friction force and normal load fluctuations in sinusoid-like curve for the rolling ellipsoidal particles, whereas the front cutting of particle results in an increase in the friction force, making it greater than the normal force for sliding particles under high velocity. The plastic deformation of monocrystalline silicon is attributed to the phase transformation, which is clearly impacted by the movement pattern of the particle. The rolling of the particle causes substrate deformation with periodical inhomogeneous characteristics, while sliding helps produce a high-quality surface and improves efficiency in the CMP process.
1. Introduction
With the rapid development of ultra-precision manufacture and miniaturized components, micro-electro-mechanical systems (MEMS) have broad applications in sensors, microelectronics, miniaturized structures and photovoltaic industries. As the key component of the MEMS, monocrystalline silicon (Si) has been studied extensively in the recent past.1–3 It is notable that the mechanical property of Si, particularly the relatively poor friction and wear behaviour, has a severe limitation on the integrity and reliability of the surface and subsurface layers of MEMS.4,5 It has been indicated that during the wear process, the initial adhesive wear, with the feature of blunt asperities, can transform into abrasive wear due to the accumulation of wear debris between the MEMS components. This finally results in the failure of the MEMS devices.6,7 This abrasive wear pattern of monocrystalline silicon should be accurately described by the complicated three-body abrasion. The interaction of the abrasive particle with the silicon substrates determines the nature of substrate deformation and the wear characteristics.In addition, chemical mechanical polishing (CMP) technique incorporated in the MEMS fabrication process has been proven to be a useful intermediate fabrication technique to enable the modification of the surface roughness, waviness and flatness.8 During the CMP process, the slurry usually consists of an aqueous solution with specific chemical properties along with abrasive particles, which play a key role in material removal. The abrasive particles are driven over the wafer surface by the relative motion between the wafer and the pad. Microscopic observations of polished surfaces indicated that the mechanical effects of the slurry are caused due to repeated sliding, rolling, or indentation of abrasive particles against the wafer surface.8–10 Clearly, to deeply understand the abrasive wear is of substantial importance to achieve well surface planarization in the CMP process.
Recently, in situ experiments such as X-ray diffraction, Raman spectroscopy and transmission electron microscopy (TEM) have been performed to study the abrasive wear behaviour, particularly the three-body abrasion of monocrystalline silicon.11–14 Trezona and Adachi et al.15,16 studied the dependence of wear behaviour on the normal load and suggested that the wear volume was proportional to normal load for three-body rolling and that the wear mechanism can transform from three-body rolling to two-body grooving with an increase in load. Xie and Bhushan17 conducted a research to understand the mechanism of material removal in the abrasive polishing process. The results indicated that the abrasion increased with an increase in contact pressure, while contact pressure had little effect on the surface roughness. Fang et al.18 pointed out that an increased normal load caused a change in the movement pattern of abrasive particles and thereby resulted in different wear behaviour in three-body abrasion. Furthermore, the ellipsoidal particle was assumed to be the first approximation to simulate a real particle in three-body abrasion, and it is noted that the normal load was a key factor to distinctly influence the movement pattern of the ellipsoidal particle.19 These results help understand the effect of normal load on the three-body abrasion in the wear process of MEMS.
In addition, the wear properties of monocrystalline silicon have been extensively studied at the nanoscale by molecular dynamics (MD) simulation. Zhang et al.20 simulated the amorphous phase transformation of monocrystalline silicon in two-body and three-body abrasions. The amorphous transformation at a relatively small load and the emergence of nanometer twins at a large load were also confirmed by MD simulations.21 Du et al.22 simulated the mechanical properties and deformation mechanism of monocrystalline silicon with the nanoindentation test. They found that Si-III and Si-XII phases with fourfold coordination appeared during the loading stage of nanoindentation process, while Si-II, Si-XII, and amorphous phase were found beneath the indenter. Furthermore, several simulated results showed that the Si-I phase transformed into two types of body-centred-tetragonal phases, i.e. β-Si and Bct5, with fivefold coordination.23,24 Sun et al.25 studied the nanoscale abrasive wear of monocrystalline silicon with spherical particles and found a new phase transformation route, i.e., an initial diamond cubic silicon turns into high density amorphous phase beneath the moving particle and then transforms into low density metastable amorphous phase behind the particle in both two-body and three-body abrasions. They also observed the rolling movement of the spherical particle and concluded that a large elastic recovery prevented the particle from sliding.26 Consequently, phase transformation of monocrystalline silicon is still a research focus due to its complexity and variability, particularly in the complicated CMP process, and most of the simulations are simplified and even neglect the effect of normal load on the abrasion behaviour.20–24
In this study, the effect of normal load on the movement pattern of the particle, the interaction between the particle and specimens, and the resultant phase transformation of monocrystalline silicon were implemented by large-scale MD simulation. An ellipsoidal particle with an axial ratio of 0.50 was used as the approximation for a real abrasive particle, and the normal load varied from 80 nN to 240 nN. The degree of damage or planarization of monocrystalline silicon surface was evaluated. This study aimed to construct a more precise model to elucidate the effect of normal load on wear properties and understand the wear mechanism, which will be beneficial to improve the reliability and life-span of MEMS.
2. Model and simulation details
MD simulations were conducted using the large-scale atomic/molecular massively parallel simulator (LAMMPS).27 The sandwich model for three-body abrasion was constructed as shown in Fig. 1. Both the upper and bottom silicon specimens consisted of 292, 800 atoms with dimensions of 43.40 × 8.10 × 16.30 nm along x-[100], y-[010] and z-[001] directions. The silicon atoms were initially arranged in a diamond cubic structure with a constant lattice parameter of 0.5431 nm. The silicon specimens were composed of three types of atoms: boundary atoms, thermostat atoms and Newtonian atoms. The boundary layer on the bottom specimen was fixed to provide structural stability. The thermostat atoms were kept at a constant temperature of 300 K to mimic the heat dissipation in real wear process. All the atoms in Newtonian layer in each specimen were freely moved in accordance with the Newton motion equations.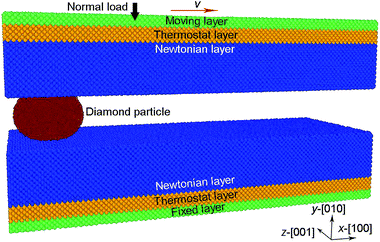 | ||
| Fig. 1 The atomic model of three-body abrasion after the indentation process along y-[010] direction. | ||
During the CMP process, ceria particles are usually added in aqueous polishing solutions, in which ceria particles have a higher hardness compared to monocrystalline silicon.28 It is, therefore, acceptable that the ceria particles are assumed to be rigid. In this research, the rigid diamond ellipsoidal particle, with three semi-axes of 4.0 nm, 2.0 nm and 4.0 nm along the x-, y-, and z-directions, was modelled to facilitate the simulation process. The coordinates of each atom in the ellipsoidal particle were initially formulated in Matlab software according to the perfect diamond structure with a lattice parameter of 0.35667 nm. Subsequently, the ellipsoidal particle was constructed and positioned between the two silicon specimens. To address the effect of normal load on the movement pattern of particles and wear behaviour of monocrystalline silicon, various normal loads (80, 120, 160, 200 and 240 with unit of nN) were adopted.
Interatomic forces between silicon atoms in the specimens were depicted by Tersoff potential that provides the correct cohesive energies for the different phases of silicon and has been widely used to study the deformation behaviour of silicon.29,30 Since the diamond particle was treated as a rigid body, the interactions between carbon atoms were ignored. The interaction between silicon and diamond abrasive was modeled by the widely used Morse potential:31
| V(r) = D(e−2α(r−r0) − 2e−α(r−r0)) | (1) |
In the simulations, periodic boundary conditions were applied in both x- and z-directions, but free boundary was set along the y-direction. The equations of motion were integrated with a velocity-Verlet algorithm with a time step of 1 fs. Initially, the system was relaxed in the NVT ensemble with the Nose–Hoover thermostat35,36 for 100 ps until the whole simulation system reached equilibrium. Subsequently, the indentation process was performed by moving the upper specimen along the y-[010] direction at different load while the bottom specimen was kept motionless. After a 50 ps relaxation, the upper specimen moved horizontally along x-[100] orientation on the (010) crystal plane at a constant velocity of 50 m s−1, but the bottom specimen remained fixed. The sliding of upper specimen lasted for 1000 ps. During the indentation and sliding, all the simulations were implemented in the NVE ensemble with the Langevin thermostat to maintain the temperature of the thermostat layer at 300 K.
3. Results and discussion
3.1 Movement pattern of the abrasive particle
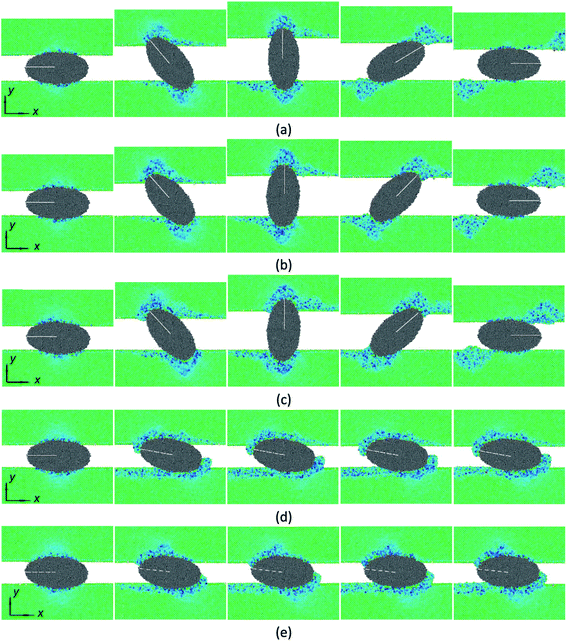
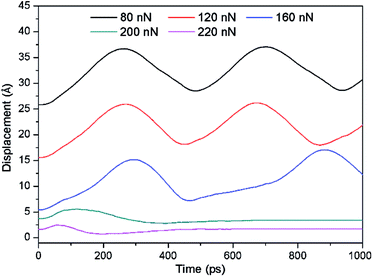
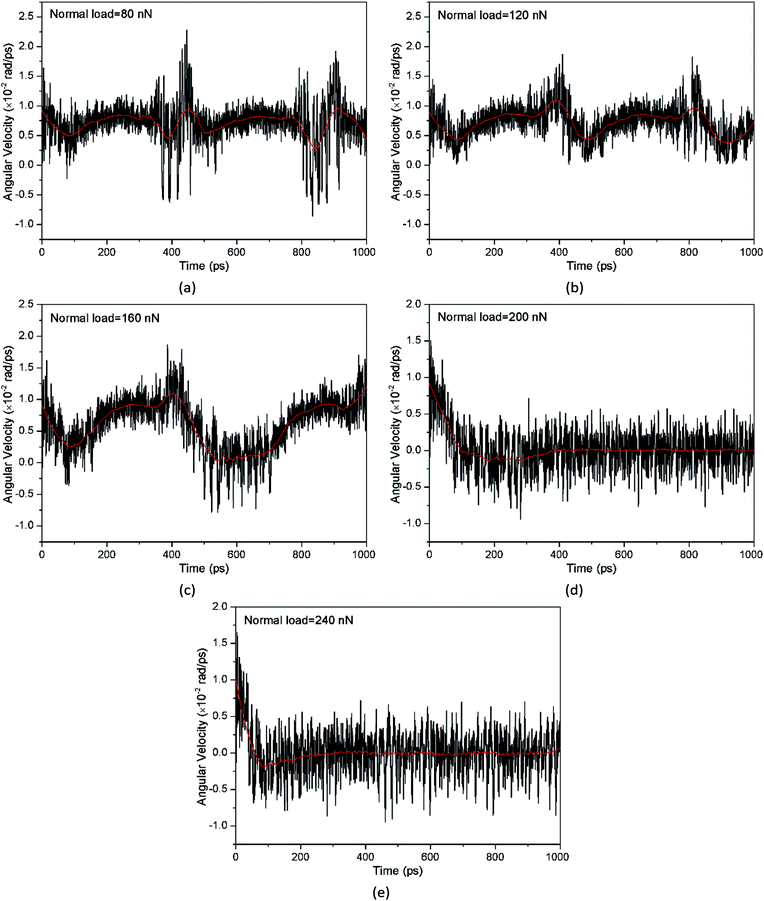
The movement pattern of the abrasive particle is critical in evaluating the wear of materials. In order to describe the movement pattern of ellipsoidal particle, the atomic instantaneous configurations are displayed in Fig. 2. Herein, the semi-major axis was labelled with a white dashed line to depict the particle motion. From Fig. 2(a) to (c), we find that as the normal load increases from 80 nN to 160 nN, the position of the marked semi-major axis varies and the rotation angle between the semi-major axis and x-direction varies from 0° to 180° with increasing simulation time, indicating the rolling of the particle. When the normal load is larger than 160 nN, the particle slides as shown in Fig. 2(d) and (e). As a result, a particle bearing a larger load shows a tendency to slide, which is much easier to groove surface in three-body abrasion. Moreover, it becomes interesting that the particle has a slight rolling movement with small tilt angle at the initial stage and then slides till the end of simulation process, as shown in Fig. 2(d) and (e).In addition, the displacement of the upper specimen along y-direction and the angular velocity of centre of particle were extracted to quantitatively measure the particle movement as shown in Fig. 3 and 4. In Fig. 3, the ordinate values are labelled to examine the amplitude of curves. The coordinates are the same value at t = 0 ps because all the particles moved from the same initial position. We can find that the displacement–time curves show sinusoidal curves but their amplitudes show less evident change as the normal load increases from 80 nN to 160 nN. From Fig. 4(a) to (c), the angular velocity with positive value validates the rolling of the ellipsoidal particle with the normal load smaller than 200 nN, as shown in Fig. 2(a)–(c). In detail, the angular velocity, presenting a fluctuation, manifests the rolling process of the particle, i.e., the increasing angular velocity indicates that the particle falls down from the upright position (that is the semi-major axis perpendicular to x axis) to lying flat, and vice versa. Particularly, for the particle bearing a normal load of 160 nN, its angular velocity becomes very close to zero at around 550–700 ps, indicating the particle's tendency to slide over a period of time, which suggests that this load is close to a critical value causing the change of particle movement pattern from rolling to sliding. When the normal load is larger than 160 nN, the displacement–time curve of the upper specimen shows a slight oscillation and then remains constant (Fig. 3), while the angular velocity of the particle decreases from a nonzero value to zero (Fig. 4(d) and (e)). This indicates that the small tilt angle (about 12° and 8° for normal load 200 nN and 240 nN, respectively) might be helpful for the sliding of particle initially.
It is well known that the 50 ms−1 velocity of the upper specimen is much higher than the experimentally relevant velocities. In order to bring the simulated results closer to the experimental results, two additional simulations were performed under the upper specimen velocity of 5 m s−1. Fig. 5 shows the atomic instantaneous configurations at a normal load of 120 nN and 200 nN. In Fig. 5(a), the particle shows an unceasing rolling movement in the whole simulation process, although its rotation is very slow. Contrarily, the particle remains sliding after an initial rolling as the normal load is 200 nN in Fig. 5(b), similar to that of the sliding movement in Fig. 2(d) and (e). The results are further validated by the displacement of the upper specimen and angular velocity in Fig. S1 and S2 (ESI).† Therefore, the influence of normal load on the movement pattern of ellipsoidal particle is still tenable with the decrease in the velocity of the upper specimen.
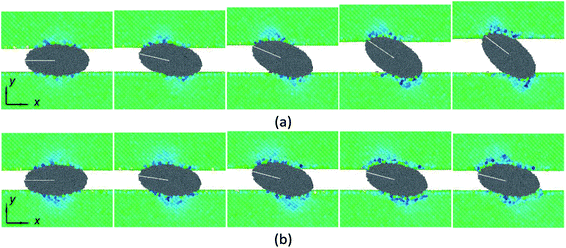 | ||
| Fig. 5 Atomic instantaneous configurations with different normal load (a) 120 nN (at 0, 250, 500, 750 and 1000 ps), (b) 200 nN (at 0, 250, 500, 750 and 1000 ps). Atomic colour is same as that in Fig. 2. | ||
The prediction of the movement pattern of particle is critical in determining the morphology of worn surface and thereby in predicting the change of wear mechanism. The criterion for movement pattern of particle has been established to quantitatively characterize the correlation between theoretical and experimental or simulated studies.18,37–39 Fig. 6 depicts the force between the moving ellipsoidal particle and the bottom silicon specimen. The interaction between the particle and the upper specimen is omitted due to the system symmetry. Point S is assumed to be a central contact point of distributed forces on the particle surface, and point O, the centroid of the ellipsoidal particle. This simplified model has been reported by the present authors.19,26 N and F are normal load and friction force acting on the particle by the surface of the specimen, and v represents the movement direction of the upper specimen. Thus, based on the force equilibrium correlation, the aforementioned criterion can be described by the following formulas:18,19,37–39
| e/h ≥ μ (for sliding particle) | (2) |
| e/h < μ (for rolling particle) | (3) |
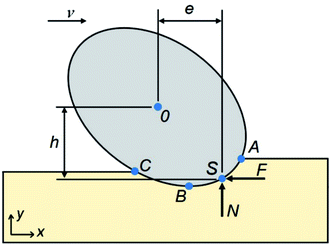 | ||
| Fig. 6 Schematic of forces on an ellipsoidal particle in three-body abrasion. A, B, and C are the contact points between the particle and specimen surface. | ||
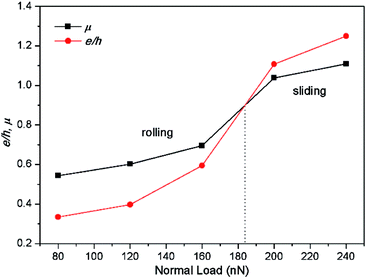
The coefficient of friction (μ) was calculated from friction force and normal load, and the e/h value was calculated from the modified equation (see ESI†).19 During the calculation of the e/h, the friction force and normal force were both assumed to be equally distributed at the contact zone (that is ASBC area in Fig. 6) between the particle and specimen surface. Fig. 7 presents the curves of e/h and coefficient of friction vs. the simulated time. The e/h is clearly smaller than μ but their difference seems to reduce with the increased normal load for the rolling particle. However, the opposite trend occurs for the sliding particle as shown in Fig. 7(d) and (e). The average value of μ and e/h, as a function of normal load, was calculated and is shown in Fig. 8. It is clear that both μ and e/h increase with increasing normal load, but e/h exceeds μ when the normal load is larger than about 185 nN. Therefore, based on the criterion of movement pattern of particle, there exists a critical normal load (about 185 nN) for ellipsoidal particle with certain moving conditions in three-body abrasion. When the normal load begins with a small value and then increases to pass over this critical value, the particle movement changes from rolling to sliding.
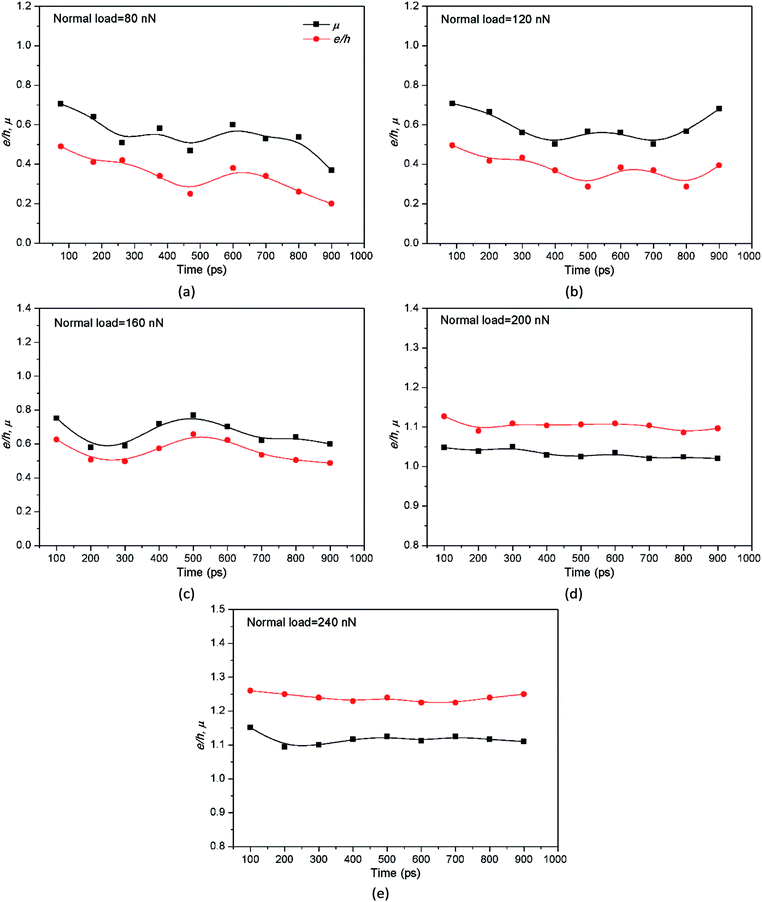 | ||
| Fig. 7 Coefficient of friction (μ) and e/h value vs. time at different normal load: (a) 80 nN, (b) 120 nN, (c) 160 nN, (d) 200 nN and (e) 240 nN. | ||
3.2 Evolution of friction force and normal force
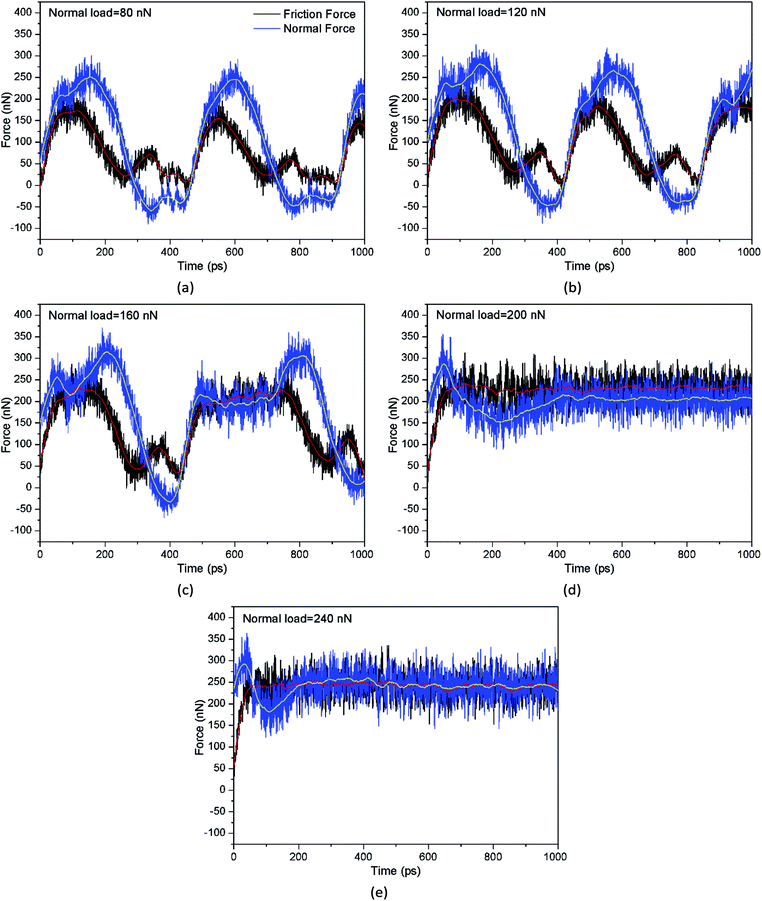
It is well known that the particle movement is controlled by the friction force and normal force. Therefore, the analysis of the two forces, as driving and resistant forces, is necessary to predict the movement pattern of the ellipsoidal particle. Fig. 9 shows the evolution of friction force and normal force. For the rolling process of ellipsoidal particles as shown in Fig. 9(a)–(c), both friction force and normal force display fluctuation, approximately in a sinusoid-like curve. The periodical change of force corresponds to the different stages of the particle rolling. When the ellipsoidal particle falls down from upright position, the normal force decreases faster than friction force, and sometimes the normal force turns to a negative value due to interatomic attractive force. Friction force is the driving force and normal force is the resistant force whether the particle is in the rising or falling stage during rolling. Thus, it can be seen that the period of force–time curve is smaller for friction force than that for normal force, particularly in the first half of the period, which suggests that the change of friction force occurs prior to the normal force. For the sliding particles in Fig. 9(d) and (e), the friction force increases rapidly and then maintains a dynamic equilibrium, while the normal force displays an evident fluctuation at the early movement stage and finally remains constant. This fluctuation of normal force reflects on the initial rolling of particle as shown in Fig. 2(d) and (e). It is also notable that as the front portion of ellipsoidal particle cuts the specimen surface, large quantities of Si atoms accumulate in the front of the particle (see Fig. 2(d) and (e)), which increases friction force substantially. Hence, the friction force increases significantly and even becomes greater than the normal force, as shown in Fig. 9(d) and (e).Furthermore, for the 5 m s−1 velocity of upper specimen, although the movement pattern of ellipsoidal particle changes from rolling to sliding as the normal load increases from 120 nN to 200 nN, the force evolution shows the same trend. Namely, the friction force increases from zero and then remains constant, while the normal force remains constant with an increase in time, as shown in Fig. S3 (ESI).† This, different from the cases under high velocity as shown in Fig. 9, is because the low velocity leads to a steadier movement of the particle.
By analysing the moving process of the particle, we considered that there is a critical angle between semi-major axis and x-direction, which changes with a change in normal load. If the initial rolling of the particle passes over the critical angle, it will continue to roll rather than begin to slide. Consequently, in a short period of time, friction force moves towards zero, while the normal force changes from repulsion to attraction, as shown in Fig. 9(a)–(c). This indicates that the normal load can induce a change in the interactive force between the particle and the monocrystalline silicon specimens and thereby affect the movement pattern.
3.3 Phase transformation of monocrystalline silicon
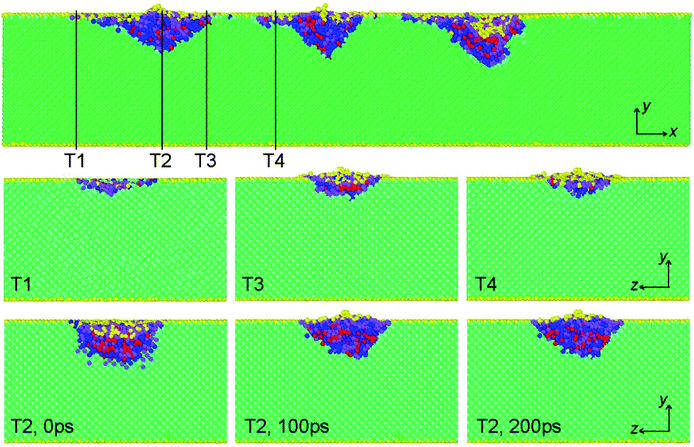
Combining experiments with MD simulations, it is notable that the plastic deformation of silicon determined by dislocation or phase transformation depends on the shape and dimension of silicon.40 At the same time, the wear mechanisms of materials are commonly composed of ploughing and cutting at the macroscale.25 Now, the wear or plastic deformation mechanism of monocrystalline silicon at nanoscale becomes interesting and complicated due to the varying external load. In the whole simulation process, five phases (Si-I, Si-II, Si-III, Si-XII and Bct5) were observed as reported in the experiment and simulations.21,26,41,42 The coordination number (CN) analysis and diamond structure identification were adopted to identify different phases.In the three-body abrasion process as shown in Fig. 2, the phase transformation of monocrystalline silicon varies at different moving stages for the ellipsoidal particle. Particularly, when the ellipsoidal particle rolls at the upright position the phase transformation becomes larger in quantity than that while lying flat. On the contrary, the phase transformation (occurring around particle) induced by particles with sliding movement shows much less change in quantity during the sliding processes. In order to deeply compare the phase distributions of monocrystalline silicon after the rolling or sliding of particles, the snapshots of atomic configurations were observed and are exhibited in Fig. 10 and 11 for the particle with normal load 120 nN and 240 nN, respectively. For clarity, four regions, i.e. initial indentation region, scratched region, particle occupying region and cutting region, were labelled to identify the phase distribution.
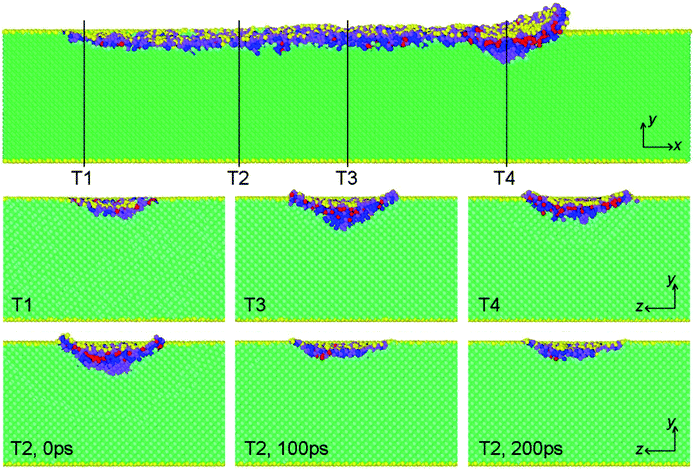 | ||
| Fig. 11 Cross-section view of phase distribution induced by sliding of particle with normal load 240 nN. T1 corresponds to the central position of indentation, T2–T4 correspond to different positions during particle sliding. (Top) View from z direction; (middle and bottom) view from x direction. Atomic colour is same as that in Fig. 10. | ||
In the initial indentation region (T1), the Si-II phase with six-fold coordination and the Bct5 phase with fivefold coordination appear interactively beneath the particle; some surface atoms (Si-I phase) appear beneath the particle and separate the Si-II and Bct5 atoms, and the Si-III/Si-XII phase with four-fold coordination transformed by the initial diamond cubic structure appears in a deeper position. As shown in the snapshot of T1 region in Fig. 10 and 11, after the particle moves away from the indentation region, almost all the Si-II and Si-III/Si-XII atoms and most of Bct5 atoms vanish and transform into the original Si-I atoms. The phase transformation occurring after the departure of the particle is also probed by examining the atom number difference as shown in Fig. 12. Within a period of time of 20 ps after the particle starts to move off, the difference between both transformational Si-II and Bct5 atoms is less than zero, whereas that of Si-III/Si-XII is greater than zero, which means that a part of Si-II and Bct5 atoms transforms into Si-III/Si-XII atoms rather than Si-I atoms. A similar result was reported by Lin et al.,43 in which the Si-I phase transforms into Si-II phase under a load, and Si-II undergoes further phase transformation to a mixed-phase of Si-III and Si-XII at a low unloading rate, while it transforms into the Si-I phase at a rapid unloading rate.
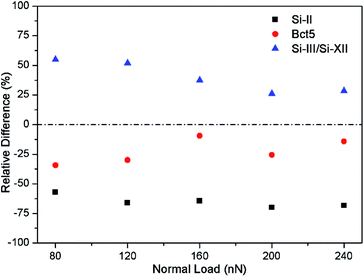 | ||
| Fig. 12 Number difference of the transformation atoms induced by indentation to the remaining atoms at the instant of 20 ps from the particle starting to move. | ||
Clearly, the phase transformation in three-body abrasion differs from the phase transformation induced by indentation process.26 The effect of particle movement pattern on the phase transformation of monocrystalline silicon is predominant in the scratched region. With respect to the particle rolling, the deformation of specimens has a clear difference at different rolling stages and exhibits a periodical property, for instance, the depth of deformed region and the number of deformed atoms for the upright position (see T2 region in Fig. 10) of the ellipsoidal particle are much larger than that for the particle lying flat (see region between T3 and T4 in Fig. 10). On the contrary, the deformation of specimens for the sliding particle is nearly homogeneous in the entire scratched region as shown in Fig. 11. During moving process, sliding particle cuts or ploughs the substrates, resulting in more atoms being accumulated at the front but much lesser number of atoms deform beneath the particle, compared with the rolling particle. The phase transformation processes of deformed region (T2), evolving with time after particle starts to move off, are displayed at the bottom of Fig. 10 and 11. It can be seen that the volume decrement of the deformed region, where particle holds upright position for rolling particle with normal load 120 nN, is smaller than that for sliding particle with normal load 240 nN after the evolution of 100 ps, but the deformed volume for both of them shows unobvious change with an increase in the evolution time. Furthermore, after the initial abrasion, a fraction of Bct5 and Si-II atoms transform into Si-I or Si-III/Si-XII atoms, while the other Si-II and Bct5 atoms are still retained for the rolling particle as shown in Fig. 10. However, for the sliding particle, most of Si-II and Bct5 atoms transform to Si-I atoms, while several layers of Si-III/Si-XII atoms remain in the scratched region due to the release in pressure, as shown in Fig. 11.
All these results indicate that the sliding particle creates more homogenous surface structure than the rolling particle, which causes periodical damage to the specimen surfaces. Clearly, the normal load acting either during indentation process or abrasion process has a significant influence on the plastic deformation of monocrystalline silicon.
4. Damage evaluation of monocrystalline silicon
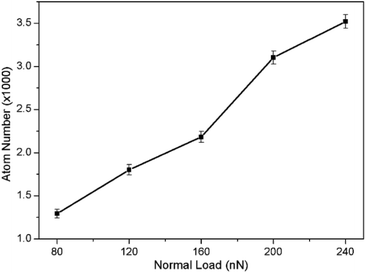
It is of great importance to evaluate the degree of damage or planarization of monocrystalline silicon surface/subsurface in the CMP process. The damage induced by phase transformation is dramatically affected by normal load. For rolling particles, the total number of phase transformation atoms during abrasion and the number of remaining transformation atoms (as shown in Fig. 13) in the scratched region increase with the normal load. Moreover, Fig. 10 demonstrates that the deformation of monocrystalline silicon exhibits a clear periodicity, namely, the number of phase transformation atoms and the depth of deformed region for ellipsoidal particle in upright position are greater than that in the lying flat state. This indicates that with the increase of normal load, the rolling prominently damages the specimens. However, the effects of normal load on the number of phase transformation atoms, as shown in Fig. 13, and the depth of deformed region are much smaller for sliding particles, and the degree of damage of the specimens is nearly homogeneous in the entire scratched region (see Fig. 11). Consequently, with regard to plastic deformation reflected by phase transformation, the rolling of ellipsoidal particle results in larger damage to monocrystalline silicon compared to the sliding particle. Therefore, we concluded that the sliding movement of ellipsoidal particle in abrasion process is more helpful in producing high-quality surface of silicon wafer and improving the polishing efficiency in CMP process.5. Conclusions
A large-scale MD simulation was carried out to study the influence of normal load on the abrasive movement pattern in three-body abrasion of monocrystalline silicon. Firstly, the particle movement properties were analysed. The results indicate that the particle rolls when the normal load increases from 80 nN to 160 nN under the constant driving force of upper specimen, and the particle bearing a larger load has a tendency to change from rolling to sliding during rolling process, which is much easier to groove the specimen surface in three-body abrasion. When the normal load is larger than the critical load of 185 nN, the particle slides with rolling for a short time initially during the simulation process. Using the criterion of movement pattern, the movement pattern of the particle can be predicted by comparing the value of e/h and coefficient of friction. Second, the evolution of force in the abrasion process shows that both friction force and normal force keep fluctuating approximately in sinusoid-like curve for the rolling ellipsoidal particles under high moving velocity. When the ellipsoidal particle falls down from upright position, the friction force moves towards zero, while the normal force changes from repulsion to attraction. For the sliding particles, the front cutting of the particle causes the accumulation of large quantities of Si atoms, resulting in a significant increase in the friction force, which becomes greater than the normal force. Furthermore, as the velocity of upper specimen is down to 5 m s−1 closer to experimental conditions, the movement pattern of particle still changes from rolling to sliding with the normal load increasing from 120 nN to 200 nN, and the motion of the particle becomes steadier. Third, the phase transformation of monocrystalline silicon was found to be impacted clearly by the movement pattern of the particle. In the initial indentation region, a part of Si-II and Bct5 atoms transform into Si-III/Si-XII atoms rather than Si-I atoms at the early 20 ps after the particle starts to move off. In the moving region, the particle rolling causes specimen deformation with a periodical and inhomogeneous property, while the deformation for the sliding particle is nearly homogeneous. After three-body abrasion, a fraction of Bct5 and Si-II atoms transforms into Si-I or Si-III/Si-XII atoms, while the other Si-II and Bct5 atoms are still retained for the rolling particle. For the sliding particle, most of Si-II and Bct5 atoms transform to Si-I atoms, while several layers of Si-III/Si-XII atoms remain in the scratched region due to the release in pressure. Finally, the degree of damage or planarization of monocrystalline silicon was evaluated. The sliding movement caused by large normal load is more helpful to produce high-quality surface as compared to the rolling. The significant results will be beneficial in evaluating the effect of normal load acting on ellipsoidal particle and thereby in improving the polishing efficiency in CMP process. In addition, the moisture, as an important factor, plays a critical role in the polishing process by altering the friction and wear environment in both chemical and physical perspectives. Therefore, we will perform additional simulations, constructing a more real CMP environment, to obtain a deeper understanding of the effect of water on the friction and wear behaviour of silicon surface at nanoscale.Acknowledgements
This study was supported by the National Natural Science Foundation of China [grant numbers 51375364, 51475359, 51605139, 51505479] and the Natural Science Foundation of Shaanxi Province of China [2014JM6219].References
- H. Huang and J. W. Yan, Scr. Mater., 2015, 102, 35–38 CrossRef CAS.
- L. C. Zhang and C. Y. Tang, Wear, 2013, 302, 929–936 CrossRef CAS.
- L. Zhang, H. W. Zhao, Y. H. Yang, H. Huang, Z. C. Ma and M. K. Shao, Appl. Phys. A, 2014, 116, 141–150 CrossRef CAS.
- D. E. Kim and S. I. Oh, Nanotechnology, 2006, 17, 2259–2265 CrossRef CAS.
- G. Subhash, A. D. Corwin and M. P. de Boer, Tribol. Lett., 2011, 41, 177–189 CrossRef CAS.
- D. H. Alsem, M. T. Dugger, E. A. Stach and R. O. Ritchie, J. Microelectromech. Syst., 2008, 17, 1144–1145 CrossRef CAS.
- S. Shen, Y. Meng and W. Zhang, Tribol. Lett., 2012, 47, 455–466 CrossRef CAS.
- T. Kasai and B. Bhushan, J. Phys.: Condens. Matter, 2008, 20, 225011 CrossRef.
- J. F. Luo and D. A. Dornfeld, IEEE Trans. Semicond. Manuf., 2001, 14, 112–133 CrossRef.
- J. F. Luo and D. A. Dornfeld, IEEE Trans. Semicond. Manuf., 2003, 16, 45–56 CrossRef.
- K. Anantheshwara, A. J. Lockwood, R. K. Mishra, B. J. Inkson and M. S. Bobji, Tribol. Lett., 2012, 45, 229–235 CrossRef CAS.
- D. R. Clarke, M. C. Kroll, P. D. Kirchner and R. F. Cook, Phys. Rev. Lett., 1988, 60, 2156–2159 CrossRef CAS PubMed.
- A. B. Mann, D. Van Heerden, J. B. Pethica, P. Bowes and T. P. Weihs, Philos. Mag. A, 2002, 82, 1921–1929 CAS.
- J. E. Bradby, J. S. Williams and M. V. Swain, Phys. Rev. B: Condens. Matter Mater. Phys., 2003, 67, 085205 CrossRef.
- R. I. Trezona, D. N. Allsopp and I. M. Hutchings, Wear, 1999, 225–229, 205–214 CrossRef CAS.
- K. Adachi and I. M. Hutchings, Wear, 2003, 255, 23–29 CrossRef CAS.
- Y. S. Xie and B. Bhushan, Wear, 1996, 200, 281–295 CrossRef CAS.
- L. Fang, X. L. Kong, J. Y. Su and Q. D. Zhou, Wear, 1993, 162–164, 782–789 CrossRef CAS.
- L. Fang, J. Zhao, B. Li and K. Sun, J. Mater. Process. Technol., 2009, 209, 6048–6056 CrossRef CAS.
- L. Zhang and H. Tanaka, Tribol. Int., 1998, 31, 425–433 CrossRef CAS.
- K. Mylvaganam and L. C. Zhang, Scr. Mater., 2011, 65, 214–216 CrossRef CAS.
- X. C. Du, H. W. Zhao, L. Zhang, Y. H. Yang, H. L. Xu, H. S. Fu and L. J. Li, Sci. Rep., 2015, 5, 16275 CrossRef CAS PubMed.
- P. Eyben, F. Clemente, K. Vanstreels, G. Pourtois, T. Clarysse, E. Duriau, T. Hantschel, K. Sankaran, J. Mody, W. Vandervorst, K. Mylvaganam and L. C. Zhang, J. Vac. Sci. Technol., B: Microelectron. Nanometer Struct.--Process., Meas., Phenom., 2010, 28, 401–406 CAS.
- D. E. Kim and S. I. Oh, J. Appl. Phys., 2008, 104, 013502 CrossRef.
- J. P. Sun, L. Fang, J. Han, Y. Han, H. W. Chen and K. Sun, Wear, 2013, 307, 119–126 CrossRef CAS.
- J. P. Sun, L. Fang, J. Han, Y. Han, H. W. Chen and K. Sun, Comput. Mater. Sci., 2014, 82, 140–150 CrossRef CAS.
- S. Plimpton, J. Comput. Phys., 1995, 117, 1–19 CrossRef CAS.
- Y. Chen, Z. N. Li and N. M. Miao, Tribol. Int., 2015, 82, 211–217 CrossRef CAS.
- J. Tersoff, Phys. Rev. B: Condens. Matter Mater. Phys., 1989, 39, 5566–5568 CrossRef.
- J. Tersoff, Phys. Rev. Lett., 1986, 56, 632–635 CrossRef CAS PubMed.
- P. Morse, Phys. Rev., 1929, 34, 57–64 CrossRef CAS.
- W. C. D. Cheong and L. C. Zhang, Nanotechnology, 2000, 11, 173–180 CrossRef CAS.
- F. Z. Fang, H. Wu and Y. C. Liu, Int. J. Mach. Tool. Manufact., 2005, 45, 1681–1686 CrossRef.
- H. Zhao, C. Shi, P. Zhang, L. Zhang, H. Huang and J. Yan, Appl. Surf. Sci., 2012, 259, 66–71 CrossRef CAS.
- S. Nose, J. Chem. Phys., 1984, 81, 511–519 CrossRef CAS.
- W. G. Hoover, Phys. Rev. A: At., Mol., Opt. Phys., 1986, 34, 2499–2500 CrossRef.
- L. Fang and Q. D. Zhou, TriboTest, 1995, 2, 47–53 CrossRef.
- L. Fang, X. L. Kong and Q. D. Zhou, Wear, 1992, 159, 115–120 CrossRef.
- L. Fang, Q. D. Zhou and Q. C. Rao, Wear, 1998, 218, 188–194 CrossRef.
- D. Chrobak, N. Tymiak, A. Beaber, O. Ugurlu, W. W. Gerberich and R. Nowak, Nat. Nanotechnol., 2011, 6, 480–484 CrossRef CAS PubMed.
- L. L. Boyer, E. Kaxiras, J. L. Feldman, J. Q. Broughton and M. J. Mehl, Phys. Rev. Lett., 1991, 67, 715–718 CrossRef CAS PubMed.
- K. Mylvaganam, L. C. Zhang, P. Eyben, J. Mody and W. Vandervorst, Nanotechnology, 2009, 20, 305705 CrossRef CAS PubMed.
- Y. H. Lin, S. R. Jian, Y. S. Lai and P. F. Yang, Nanoscale Res. Lett., 2008, 3, 71–75 CrossRef CAS.
Footnote |
| † Electronic supplementary information (ESI) available: The calculation of e/h value. See DOI: 10.1039/c7ra02148h |
| This journal is © The Royal Society of Chemistry 2017 |

