 Open Access Article
Highly effective K-Merlinoite adsorbent for removal of Cs+ and Sr2+ in aqueous solution
Yuki Kakutania,
Patcharaporn Weerachawanasakb,
Yoshiya Hirataa,
Makoto Sanoab,
Toshimitsu Suzukia and
Takanori Miyake *ab
*ab
aGraduate School of Science and Engineering, Environmental and Urban Major, Kansai University, 3-3-35 Yamate, Suita, Osaka 564-8680, Japan. E-mail: tmiyake@kansai-u.ac.jp; Fax: +81-6-6388-8869; Tel: +81-6-6368-0918
bOrganization for Research and Development of Innovative Science and Technology, Kansai University, 3-3-35 Yamate, Suita, Osaka 564-8680, Japan
First published on 15th June 2017
Abstract
K-Merlinoite or “K-MER” was successfully synthesized and firstly employed as an adsorbent for the removal of Cs+ and Sr2+ cations in aqueous solution by batch operation. The optimum conditions to synthesize K-MER were hydrothermal temperature of 250 °C and a hydrothermal time of 8 h. As revealed by XPS, TG, NMR, and ICP analyses, the composition of K-MER synthesized under optimum conditions was “K10.9Al11.2Si20.9O61.6·17.8H2O”, which corresponded with the typical formula of Merlinoite zeolite. 27Al MAS NMR indicated that no octahedrally coordinated aluminum existed suggesting very high purity of K-MER. The calculated theoretical ion-exchange capacity was 4.2 mmol g−1, assuming exchange of the total amount of potassium. In aqueous solution, K-MER exhibited an excellent Cs+ (≥90%) and Sr2+ (≥65%) removal performance with the maximum exchange capacity of 3.08 meq. g−1 for Cs+ and 2.01 meq. g−1 for Sr2+. K-MER showed higher adsorption for Cs+ than Sr2+ when performed using the same adsorption conditions. Coexisting monovalent cations, Na+ and K+, significantly influenced Cs+ removal more than divalent cations, Ca2+ and Mg2+, and they were in the order of K+ > Na+ > Ca2+ > Mg2+. The most important factor for competitive adsorption between Cs+ and the coexisting cation was the hydrated ionic size. Cs+ became more difficult to adsorb when Cs+ was interfered by a coexisting cation of close size. Although the efficiency of Cs+ removal by K-MER decreased around 50% in artificial seawater compared with that in the aqueous solution, K-MER was a promising material for Cs+ and Sr2+ removal.
1. Introduction
In the past years, serious accidents at nuclear power plants have occurred in Pennsylvania in 1979, Chernobyl in 1986, and the latest accident in Fukushima in 2011.1,2 Large amounts of radioactive elements, especially abundant fission products of uranium such as 137Cs and 90Sr were released and contaminated soil, forests, and water. Both 137Cs and 90Sr are very harmful to health because they are beta-gamma emitters, which have a long half-life of around 30 years.3,4 In addition, several processes from nuclear facilities such as power plants, fuel processing, nuclear weapon testing, or remediation etc. generate significant volumes of radioactive elements.5 Accumulation of these radioactive elements in plants and animals causes critical environmental and human health problems such as skin cancer and leukemia. Therefore, 137Cs and 90Sr should be removed as soon as possible.Various techniques have been introduced to remove Cs+ and Sr2+ in aqueous solution such as precipitation,6 evaporation,3 solvent extraction,7 and adsorption via the ion-exchange.8–11 Among these methods, adsorption via the ion-exchange is one of the most interesting techniques because it provides high efficiency and selectivity to remove radioactive elements, easy operation, low cost management, and environmental friendliness. Several effective materials have been developed and applied as the adsorbents such as clay mineral,12 resin,13 graphene oxide,2 titanium dioxide,14 silica gel,15 sodium titanates,16 zirconium phosphate,10 ETS-1,17 zeolites,18–20 etc. Among these materials, zeolites are versatile inorganic materials and frequently used as the adsorbent in radioactive waste because generally zeolites contain some cations such as Na+ and K+ for charge-compensation, which can be easily cation-exchanged to facilitate high adsorption activity. Additionally, suitable aperture dimension of zeolites has an effect to achieve highly selective adsorption. Many researchers have reported Cs+ and Sr2+ removal in aqueous solution with various types of zeolites such as Zeolite A, Faujasite X, Faujasite Y, Clinoptilolite, and Modernite.3,4,18,21,22 However, a particular problem for Cs+ and Sr2+ removal using zeolite is the impurities of zeolites or coexisting cations that simultaneously compete with Cs+ and Sr2+ cation. These affected in remarkable decreasing of adsorption and ion-exchange efficiency. Similarly, the adsorption efficiency of zeolite was often reduced when applied as the adsorbent in seawater medium. Therefore, the highly effective adsorbents, which possess an excellent Cs+ and Sr2+ removal performance with high selectivity, have been developed and continuously studied.
In the present work, highly effective K-Merlinoite zeolite (hereafter denoted as K-MER) was synthesized and firstly employed as the adsorbent for Cs+ and Sr2+. K-MER is known as a natural zeolite, which appears in K2O–Al2O3–SiO2–H2O system. It has been investigated in wide applications such as membrane for gas separation, catalyst support, fertilizer in agriculture field, and ion-exchange material.23–27 However, K-MER has never been reported as an adsorbent to remove Cs+ and Sr2+ cations. Thus, the objective of this work is to synthesize a highly effective K-MER for Cs+ and Sr2+ removal and then to focus on an evaluation of the influence of coexisting cations (Na+, K+, Ca2+, Mg2+) on the Cs+ adsorption behavior in water medium. Moreover, Cs+ adsorption in artificial seawater for K-MER was also evaluated.
2. Experimental
2.1 Materials
Amorphous silica (Aerosil 200 with a specific surface area of 200 m2 g−1) was obtained from Evonik Japan. KOH (min. 85.0%), Al(NO3)3·9H2O (min. 99.9%), CsNO3 (min. 90.0%), and Sr(NO3)2 (min. 98.0%) were obtained from Wako Pure Chemical Industries, Ltd. The artificial seawater whose composition is given in Table 1 was purchased from Nihon Pharmaceutical. Co. Ltd. All chemicals were analytical grade and used without further purification.| Chemical | Concentration (ppm) | wt% |
|---|---|---|
| a Other chemicals: LiF, KI, CoCl2·6H2O, AlCl3·6H2O, FeCl3·6H2O, Na2WO4·2H2O, (NH4)6Mo7O24·4H2O, and MnCl2·4H2O. | ||
| NaCl | 20![[thin space (1/6-em)]](https://www.rsc.org/images/entities/char_2009.gif) 747 747 |
57.70 |
| MgCl2·6H2O | 9474 | 26.35 |
| Na2SO4 | 3505 | 9.75 |
| CaCl2·2H2O | 1326 | 3.69 |
| KCl | 597 | 1.66 |
| NaHCO3 | 171 | 0.48 |
| KBr | 85 | 0.24 |
| Na2B4O7·10H2O | 34 | 0.09 |
| SrCl2 | 12 | 0.03 |
| NaF | 3 | 0.01 |
| Othersa | 1 | 0.00 |
2.2 Synthesis of K-MER
K-MER adsorbents were prepared by the conventional hydrothermal method. A 2.03 g portion of SiO2 powder was dispersed in 45 mL of 4 M KOH and was left to stir at 50 °C for 10 min. Then, 6.36 g of Al(NO3)3·9H2O dissolved in 45 mL of distilled water was added and the mixture was continuously stirred at 50 °C for 10 min. The resulting mixture was transferred into a Teflon autoclave and then the autoclave was immediately put in an oven at designated temperature and for a fixed time. The effect of various hydrothermal temperature and hydrothermal time as shown in Table 2 were studied to optimize the synthesis condition of K-MER. After the hydrothermal treatment, the resulting powder was washed twice with distilled water and then once with ethanol. Finally, the obtained material was dried in the oven at 70 °C overnight.| Temperature (°C) | Time (h) |
|---|---|
| a Component: SiO2 33.9 mmol, Al(NO3)3·9H2O 16.9 mmol, KOH 180 mmol, and H2O 45 mL. | |
| 150 | 8 |
| 200 | 8 |
| 250 | 8 |
| 250 | 24 |
| 250 | 168 (7 days) |
| 250 | 336 (14 days) |
2.3 Characterization of K-MER adsorbents
The XRD patterns of K-MER adsorbents were measured by X-ray diffractometer (Rigaku Corp.) in the range of 2θ from 5 to 70° using Cu Kα radiation with a Ni filter at 40 kV and 20 mA. The morphology of K-MER was analyzed by the scanning electron microscope (SEM, Hitachi FE-SEM S4000). The elemental analysis was performed by X-ray photoelectron spectroscopy (JPS-9000, JEOL Ltd.) using Mg Kα X-ray source. The sample was pre-evacuated under 3.8 × 10⁻⁶ Pa. The C 1s peak was taken as an internal standard at 285.0 eV. The chemical compositions were also determined by inductively coupled plasma spectroscopy (ICPS-7510, Shimadzu Corp). Briefly, 10.0 mg of sample was digested in 5 mL of hydrofluoric acid and then diluted with distilled water in 50 mL of volumetric flask. The Si/Al atomic ratio was confirmed by 29Si and 27Al solid-state magic-angle spinning NMR (JNM-ECA 400WB). Thermogravimetric analysis (TG) was carried out using Thermoplus TG 8120 (Rigaku Corp.).2.4 Cs+ and Sr2+ removal by the batch operation
Typically, Cs+ or Sr2+ removal was performed in 100 mL Erlenmeyer flask as a batch reactor. Prior to the adsorption, various concentrations of Cs+ (0.075–7.5 meq. L−1) or Sr2+ (0.075–9.83 meq. L−1) solutions were prepared by dissolving CsNO3 or Sr(NO3)2 in distilled water. Then, the solution was adjusted its pH to 7.0 by using a small amount of 0.01 M HCl or 0.01 M NaOH solution. Briefly, 50 mg of adsorbent and 50 mL of CsNO3 or Sr(NO3)2 solution was placed into the flask. The adsorption was carried out at room temperature under stirring with a magnetic bar in the flask with a stirring speed at 300 rpm for different contact times (0.5–24 h). After adsorption, the adsorbent was separated from Cs+ or Sr2+ solution by centrifugation. The initial and final concentrations of Cs+ or Sr2+ solutions were analyzed by atomic absorption spectrophotometer (AAS-Z-2010, Hitachi). Prior to analysis, both solutions were diluted with 0.1 wt% of KCl solution. The differences between the initial and final concentrations could be ascribed to the amounts of Cs+ or Sr2+ removed by the adsorbent. The experimental error from atomic absorption technique is ±5%.To investigate the influence of coexisting cations on the Cs+ removal performance, the Cs+ solution was added with different electrolyte ions (Na+, K+, Ca2+, Mg2+). The initial concentration of Cs+ was fixed at 0.75 meq. L−1 (100 ppm), and those of coexisting cations were ranged from 3.75–75.0 meq. L−1. Furthermore, to evaluate the efficiency of K-MER on Cs+ removal in seawater medium, the adsorption of Cs+ was performed in artificial seawater with various Cs+ concentrations at 0.075–0.75 meq. L−1 (10–100 ppm).
The Langmuir equation (eqn (1)) was applied to evaluate the adsorption behavior and calculate the maximum exchange capacity of the adsorbent.
 | (1) |
The distribution coefficient (Kd) was determined by eqn (2).
 | (2) |
3. Results and discussion
3.1 Optimum conditions for synthesis of K-MER adsorbents
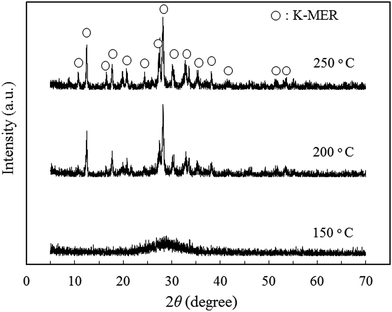
In order to investigate the optimum synthesis conditions of K-MER adsorbent by the hydrothermal method, K-MER adsorbents were prepared by changing hydrothermal temperature and hydrothermal time. Fig. 1 shows the XRD patterns of K-MER adsorbents synthesized at various hydrothermal temperatures from 150 to 250 °C for 8 h. Increasing of the hydrothermal temperature effected to gradually generate crystal form of K-MER. The broad peak of product synthesized at 150 °C showed only amorphous phase. By increasing the hydrothermal temperature to 200 °C and 250 °C, the crystal structure of K-MER could be formed. Complete formation of K-MER structure was obtained at 250 °C because it had the sharpest and highest relative intensities of XRD peaks corresponding to K-MER structure reported in ref. 28 and 29. This suggested that the hydrothermal temperature had a significant effect to structure formation of K-MER. K-MER is one of the naturally occurring zeolites and is generally known to be a crystalline form of pure K2O–Al2O3–SiO2–H2O system. Typically, it is represented in a formula of K10Al10Si22O64·xH2O.29,30In order to investigate the optimum hydrothermal time, the hydrothermal temperature was fixed at 250 °C and the hydrothermal time was varied. Fig. 2 shows the XRD patterns of K-MER adsorbents synthesized at 250 °C at various hydrothermal times. Longer hydrothermal times from 8 to 336 h caused gradual phase transformation from K-MER to Kalsilite. The characteristic XRD peaks of K-MER became smaller with the hydrothermal time from 8 to 24 h. Afterward, the characteristic peaks of Kalsilite was firstly observed at 168 h and then complete transformation of K-MER to Kalsilite could be achieved at 336 h. Kalsilite is one of aluminosilicate materials similar to zeolite and an ideal composition is reported as KAlSiO4.31 Although this material has some similarities to zeolites, Kalsilite is not a zeolite because Kalsilite is non-porous and the interstitial alkali-metal cations are not exchangeable under the conventional conditions.31 This may imply that Kalsilite is not a good material for Cs+ removal. Therefore, the optimum synthesis conditions of K-MER in this work, which afforded the highest quality without other phase contamination, were hydrothermal temperature of 250 °C and hydrothermal time of 8 h.
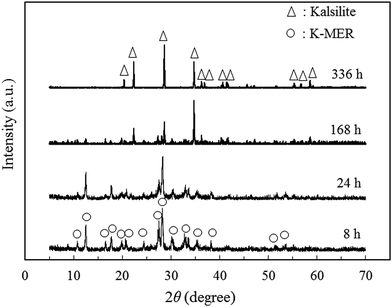 | ||
| Fig. 2 XRD patterns of K-MER adsorbents hydrothermally synthesized at 250 °C at various hydrothermal times. | ||
3.2 Characterization of K-MER synthesized at optimum conditions
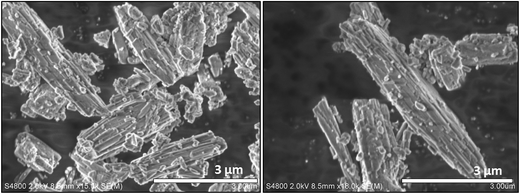
Hereafter, K-MER synthesized at optimum conditions (250 °C, 8 h) was analyzed by SEM, XPS, ICP, TG analysis and NMR techniques.The morphology of K-MER was observed by SEM (Fig. 3). The morphology of K-MER showed the typical crystal habit of natural Merlionite; the bundle of tetragonal prismatic crystal shape. The crystallite size of K-MER was approximately around 0.1–0.2 μm in width with different length.30,32
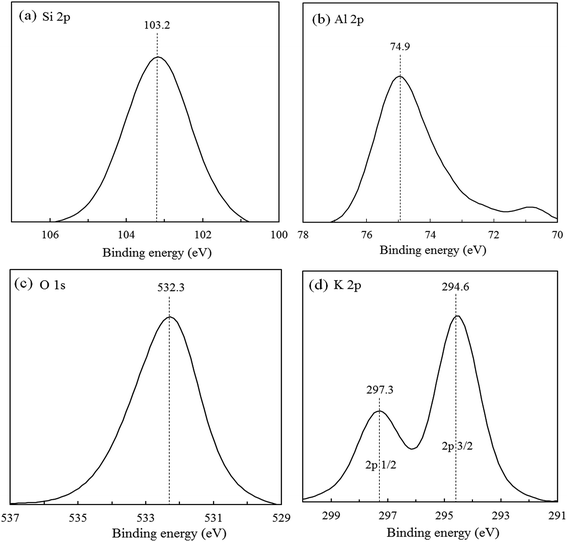
The electronic state and chemical composition of K-MER were determined by XPS techniques. Fig. 4 illustrates the XPS spectra of (a) Si 2p, (b) Al 2p, (c) O 1s, and (d) K 2p. One symmetric peak of Si 2p at binding energy (B.E.) 103.2 eV was observed, which was assigned to Si4+ species in Merlinoite framework and suggesting quite energetically homogeneous environment of silicon atom. The Al 2p peak was also observed at B.E. around 74.9 eV. The peak of O 1s appeared at B.E. around 532.3 eV. Finally, the existence of K was confirmed by the two peaks of K 2p3/2 and K 2p1/2 at B.E. 294.6 and 297.3 eV, respectively. Furthermore, the atomic composition of K-MER from XPS is summarized in Table 3. The atomic compositions of K, Al, Si, and O were calculated in the ratio of n (K)![[thin space (1/6-em)]](https://www.rsc.org/images/entities/char_2009.gif) :
:![[thin space (1/6-em)]](https://www.rsc.org/images/entities/char_2009.gif) n (Al)
n (Al)![[thin space (1/6-em)]](https://www.rsc.org/images/entities/char_2009.gif) :
:![[thin space (1/6-em)]](https://www.rsc.org/images/entities/char_2009.gif) n (Si)
n (Si)![[thin space (1/6-em)]](https://www.rsc.org/images/entities/char_2009.gif) :
:![[thin space (1/6-em)]](https://www.rsc.org/images/entities/char_2009.gif) n (O) = 10.4 (K)
n (O) = 10.4 (K)![[thin space (1/6-em)]](https://www.rsc.org/images/entities/char_2009.gif) :
:![[thin space (1/6-em)]](https://www.rsc.org/images/entities/char_2009.gif) 10.7 (Al)
10.7 (Al)![[thin space (1/6-em)]](https://www.rsc.org/images/entities/char_2009.gif) :
:![[thin space (1/6-em)]](https://www.rsc.org/images/entities/char_2009.gif) 20.0 (Si)
20.0 (Si)![[thin space (1/6-em)]](https://www.rsc.org/images/entities/char_2009.gif) :
:![[thin space (1/6-em)]](https://www.rsc.org/images/entities/char_2009.gif) 59.0 (O). It could be expressed in the composition of K10.9Al11.2Si20.9O61.6, which corresponds very well with the typical formula of K10Al10Si22O64·xH2O.29,30 The Si/Al ratio from XPS analysis was found to be 1.87, which represents the Si/Al ratio of K-MER at near surface. However, this result was coinciding with Si/Al ratio from bulk analysis using ICP (Si/Al = 1.83). This coincidence might be because of uniform structure of synthesized K-MER.
59.0 (O). It could be expressed in the composition of K10.9Al11.2Si20.9O61.6, which corresponds very well with the typical formula of K10Al10Si22O64·xH2O.29,30 The Si/Al ratio from XPS analysis was found to be 1.87, which represents the Si/Al ratio of K-MER at near surface. However, this result was coinciding with Si/Al ratio from bulk analysis using ICP (Si/Al = 1.83). This coincidence might be because of uniform structure of synthesized K-MER.
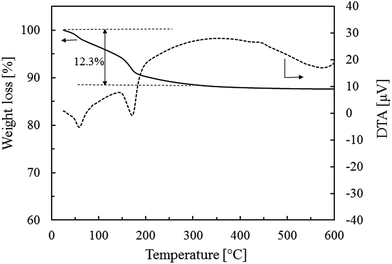
In order to elucidate the amount of water in K-MER, TG analysis was performed from 20 to 600 °C under air flow of 180 mL-STP per min and the result is demonstrated in Fig. 5. The weight loss appeared in two steps. The first one was from 25 to 150 °C, which originated from desorption of water on the surface of K-MER. The second one was from 150 to 300 °C, which was attributed to desorption of water adsorbed in the small pore of K-MER.33 Thereafter, no weight loss was observed from 300 to 600 °C suggesting high thermal stability of K-MER. The water contents in K-MER calculated from the total weight loss during 25 to 300 °C was 12.3%, which was equivalent to 17.8 mol of H2O in one unit cell of K-MER. Therefore, it can be concluded that the exact molecular formula for K-MER in this work is K10.9Al11.2Si20.9O61.6·17.8H2O. Additionally, the ion-exchange capacity of K-MER calculated by assuming exchange of the total amount of potassium in K-MER was found to be 4.2 mmol g−1.
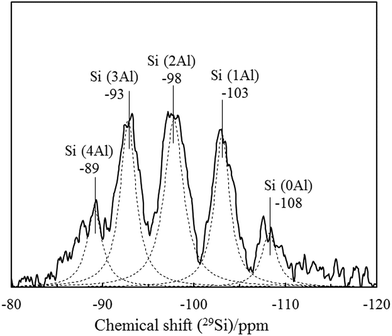
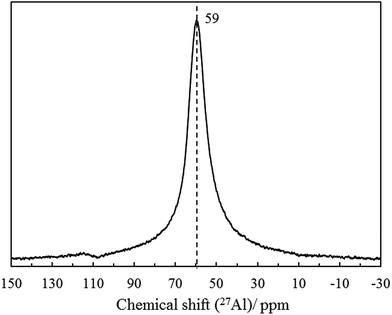
29Si and 27Al MAS NMR were measured to observe the nearest neighbor coordination environment of silicon and aluminum and to confirm purity and Si/Al ratio of K-MER. Fig. 6 shows 29Si MAS NMR spectra of K-MER. There are five well deconvoluted peaks at δ −108, −103, −98, −93, and −89 ppm, which are Si(nAl) species with n = 4, 3, 2, 1, and 0, respectively, suggesting clearly five possible silicon environment.30 Furthermore, the 27Al MAS NMR spectra of K-MER (Fig. 7) showed only one symmetric peak at δ 59 ppm, which means that only tetrahedrally coordinated aluminum existed in K-MER. No octahedrally coordinated aluminum was detected around 0–25 ppm suggesting high purity of K-MER.34,35 The Si/Al ratio calculated based on the deconvolution spectra was 1.90, which was consistent with those evaluated by XPS (Si/Al = 1.87) and ICP (Si/Al = 1.83) analyses.
From the results above, K-MER was successfully prepared by the hydrothermal method with the optimum synthesis conditions at 250 °C and for 8 h. The characteristics of K-MER in this work were in good agreement with those of Merlinoite reported by other groups.28–30 Therefore, it can be concluded that K-MER in this work is of high purity.
3.3 Effect of synthesis conditions of K-MER on Cs+ removal performance
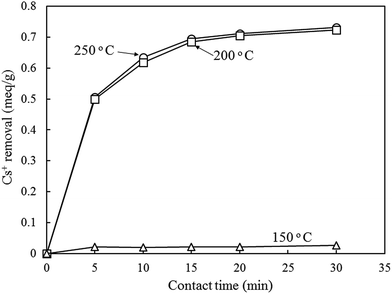
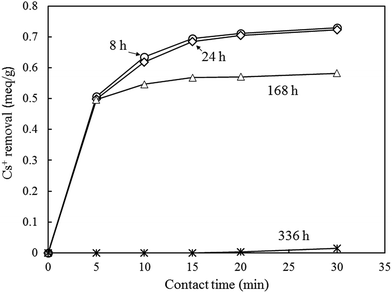
The effect of synthesis conditions of K-MER such as hydrothermal temperature and hydrothermal time on Cs+ removal performance was investigated. The overall adsorption isotherms of Cs+ removed are presented in this part.3.4 Ion-exchange capacity of K-MER for Cs+ and Sr2+
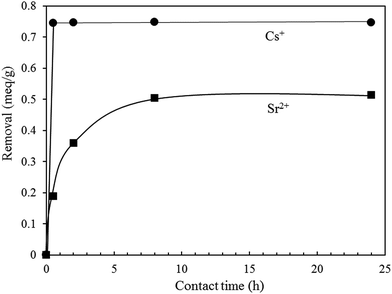
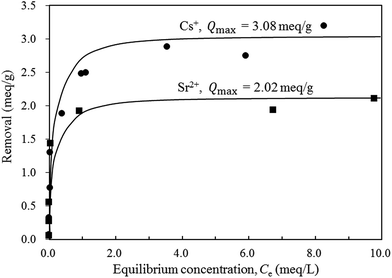
Firstly, the effect of contact time on Cs+ and Sr2+ removal was investigated and the results are shown in Fig. 10. In this study, Cs+ and Sr2+ removals were tested at 0.75 meq. L−1 at room temperature. Surprisingly, K-MER showed the excellent Cs+ uptake of 100% in only 0.5 h. Meanwhile, for Sr2+ uptake, K-MER showed a moderate uptake of around 66%. The rate of Sr2+ ion-exchange was slow and it took 8 h to reach the equilibrium adsorption. Differences in the ion-exchange capacities and rates can be explained as follows: hydrated Sr2+ species have a larger size and are slow to diffuse and occupied larger space to prevent further ion-exchange.As 24 h was sufficient to reach equilibrium adsorption, the adsorption isotherms were studied at 24 h. Fig. 11 shows the adsorption isotherms for Cs+ and Sr2+. K-MER adsorbent showed similar trends for Cs+ and Sr2+ removal, but different overall performances were found. At low concentrations of Cs+ and Sr2+ cations (≤0.05 meq. L−1), total amounts of Cs+ and Sr2+ cations could be removed. When the concentration was increased from 0.05 to ca. 10 meq. L−1, Cs+ and Sr2+ removals were significantly different. It was observed that K-MER exhibited higher Cs+ removal than Sr2+ removal, and the highest Cs+ and Sr2+ uptakes were around 3.1 meq. g−1 and 2.0 meq. g−1, respectively.
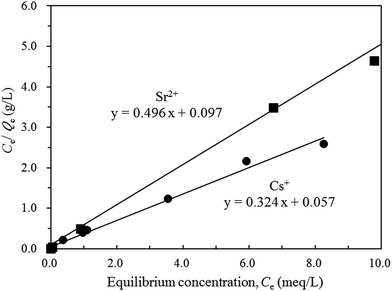
In order to estimate the maximum amounts of Cs+ and Sr2+ removal (Qmax) for K-MER, the Langmuir equation (eqn (1)) was employed and the Langmuir plots for Cs+ and Sr2+ removals are illustrated in Fig. 12. All the experimental data fit very well with the Langmuir adsorption model. The maximum amounts of Cs+ and Sr2+ removal could be obtained from the reciprocals of the relevant slopes and they were 3.08 and 2.02 meq. g−1 for Cs+ and Sr2+, respectively. The lower exchange capacity of Cs+ and Sr2+ for K-MER than the theoretical value, 4.2 meq. g−1, might be because some potassium in K-MER framework were difficult to be exchanged. Many groups have discussed and reported the crystal structure of Merlinoite including the potassium position. Belhekar et al.28 have reported that Merlinoite has two-dimensional pore structure with eight-membered oxygen rings (8MR) 5.1 × 3.4 and 3.1 × 3.5 Å. There are two types of cations sites: one surrounded by two 8MRs and the other in the larger cavity located in the niche in the double crankshaft. Further details of Merlinoite structure were revealed by Barrett et al.33 Merlinoite topology is comprised of an interconnected set of 8MR channels in different dimensions, ([100] 3.1 × 3.5 Å, [010] 2.7 × 3.6 Å, [001] 3.4 × 5.1 Å + 3.3 × 3.3 Å), and potassium occupies two kinds of sites. Skofteland et al.29 pronounced Merlionite structure more clearly as follows: Merlinoite has two types of 8MRs; the flat double 8MRs and the buckled 8MRs. The buckled 8MRs form the four windows into the Merlionite cage. In the hydrated Merlinoite, two potassium sites are mentioned; one is in the double 8MRs and the other one is in the Merlinoite cage. Therefore, considering two kinds of potassium sites, K+ in the double 8MRs are more difficult to be exchanged because K+ is surrounded by the double 8MRs. If K+ in this site remains, then roughly two K+ in the unit cell cannot be exchanged. This is in good agreement with ca. 3 mmol g−1 of exchange capacity against ca. 4 mmol g−1 of total exchange of K+.
3.5 Selective adsorption of Cs+ and Sr2+ cations
As indicated above, higher adsorption was found on Cs+ rather than Sr2+ (Fig. 10). Many literatures stated that the adsorption selectivity sequence depended on the ionic and hydrated ionic radius of cation.36–38 The ionic radii of K+, Cs+, and Sr2+ are 1.38, 1.67, and 1.18 Å, respectively. If the cation size is compared, Sr2+ is smaller and closer to K+ than Cs+, and therefore Sr2+ should be easier to exchange with K+ rather than Cs+ and should provide higher Sr2+ uptake. However, the results did not agree with this idea. One of other important factors is the influence of hydrated ionic radii. Hydrated ionic radii of alkali and alkaline earth metals, which have strong correlation with the number of coordinated water, temperature, and rate to form hydrated shell, have been reported as follows; K+ 2.65–2.97 Å, Cs+ 2.95–3.21 Å, and Sr2+ 2.60–4.78 Å.39,40 Hydrated radii of Cs+ and Sr2+ are similar in size compared with that of K+. However, hydration shell of Sr2+ is flexible in nature with a fast ligand exchange rate between the first and second hydration shell. Thus, a large hydrated Sr2+ radius around ca. 4.78 Å is reported and this may be related to low Sr2+ adsorption.The distribution coefficient (Kd) was calculated by eqn (2) to confirm the adsorption selectivity of Cs+ and Sr2+. The Kd value is the ratio of metal ions adsorbed in meq. g−1 to metal ions remaining in the solution in meq. L−1, and therefore it could be a crucial indicator to determine the selectivity of Cs+ and Sr2+ adsorption. The Kd values for Cs+ and Sr2+ of K-MER were 84.9 L g−1 and 2.2 L g−1, respectively. This large difference in Kd values explains that K-MER was more selective to Cs+ than Sr2+ and provided the excellent Cs+ uptake.
3.6 Influence of coexisting cations on Cs+ removal performance of K-MER
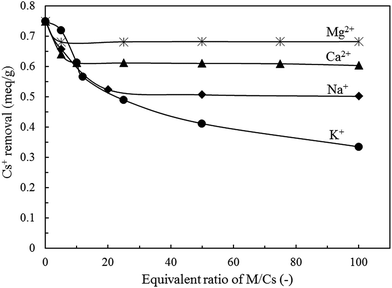
To evaluate the influence of coexisting cations on the Cs+ adsorption behavior, Cs+ adsorption was determined in the presence of Na+, K+, Mg2+, or Ca2+ which were four major cations dissolved in seawater. The initial Cs+ concentration was fixed at 0.75 meq. L−1 (100 ppm) whereas concentration of each cation was in the range of 5–100 times of Cs+. Fig. 13 exhibits the influence of Na+, K+, Ca2+, and Mg2+ on the Cs+ removal performance of K-MER adsorbent. At low equivalent ratio (M/Cs = 5), K-MER kept high ability to remove Cs+ more than 85% for all coexisting cations. Increasing of M/Cs equivalent ratio from 10 to 100 times influenced Cs+ adsorption efficiency. The presence of Mg2+ cation slightly affected Cs+ adsorption efficiency with less than 10% reduction. Ca2+ affected to reduce around 20% of Cs+ adsorbed. On the other hand, the presence of Na+ and K+ strongly decreased Cs+ adsorption efficiency by around 33% and 56%, respectively. It should be noted that monovalent cation (Na+, K+) had strongly influenced to reduce Cs+ adsorption efficiency more than divalent cation (Ca2+, Mg2+). These results might be due to the difference in hydrated ionic sizes; Na(H2O)6+ 2.4 Å, K(H2O)7+ 2.8 Å, Cs(H2O)8+ 3.1 Å, Ca(H2O)42+ 3.5 Å, and Mg(H2O)62+ 4.0 Å. Smaller than and closer to K+ is easier to exchange. As the order of hydrated ionic size for four cations is Mg2+ > Ca2+ > Cs+ > K+ > Na+, therefore K+ in K-MER could be easily exchanged with similar hydrated cation, namely K+, Cs+ and Na+. Thus, the presence of Na+ and K+ has significantly influenced on removal performance when the equivalent ratio of M/Cs was more than 10. On the other hand, less influence was found with coexisting Ca2+ and Mg2+ cations.3.7 Cs+ removal in artificial seawater
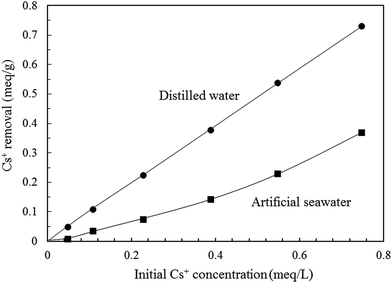
K-MER was applied to remove Cs+ in artificial seawater that contained a large amount of matrix ions as given in Table 1. The major cations in artificial seawater were Na+ (68.0 wt% as NaCl, Na2SO4, NaHCO3, Na2B4O7·10H2O, and NaF), Mg2+ (26.4 wt% as MgCl2·6H2O), Ca2+ (3.7 wt% as CaCl2·2H2O), and K+ (1.9 wt% as KCl and KBr). At first, in order to clearly observe Cs+ adsorption behavior of K-MER in artificial seawater, Cs+ removal was tested at different contact times (5–30 min), at room temperature and with initial Cs+ concentration of 0.75 meq. L−1. As shown in Fig. 14, Cs+ removal reached an equilibrium in 15 min in both distilled water and artificial seawater. At equilibrium, the maximum Cs+ removed were 89% and 51% for distilled water and artificial seawater, respectively. Although the Cs+ removal performance for K-MER in artificial seawater was significantly reduced compared with that in distilled water, it could be remarked that K-MER is still one of the promising adsorbents because it possesses more than 50% removal in seawater. Fig. 15 shows the adsorption of Cs+ in artificial seawater and in distilled water. Cs+ removal in both media dramatically increased when Cs+ concentrations were increased. Cs+ uptakes in distilled water attained about 92–97% in every Cs+ concentration. On the other hand, Cs+ uptakes in artificial seawater medium varied from 10–49% depending on Cs+ concentration; lower removal at high Cs+ concentration.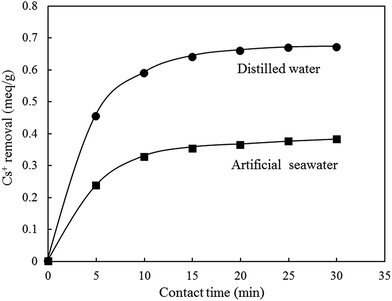 | ||
| Fig. 14 Adsorption of Cs+ in artificial seawater with K-MER. Adsorption conditions: initial Cs+ concentration 0.75 meq. L−1, solution 50 mL, pH 7.0, adsorbent 0.050 g, and room temperature. | ||
3.8 The characteristic of K-MER adsorbent after adsorption of Cs+
In order to clarify the Cs+ adsorption on K-MER, the structure of K-MER after Cs+ adsorption was investigated by XRD analysis. In addition, the reverse exchange of Cs+ to K+ was performed to understand if the K-MER structure is preserved. Fig. 16 shows XRD patterns of (a) K-MER (250 °C, 8 h), (b) K-MER after Cs+ adsorption, and (c) K-MER after reverse exchange of Cs+ to K+. According to XRD results, the crystallinity of K-MER seemed lower after Cs+ adsorption compared with the original K-MER (250 °C, 8 h). It was indicated that reverse exchange of Cs+ to K+ recovered crystallinity of K-MER. This result suggested that the structure of K-MER was not destroyed during the exchange process. Thus, K-MER is one of the promising materials to remove Cs+ in aqueous solution.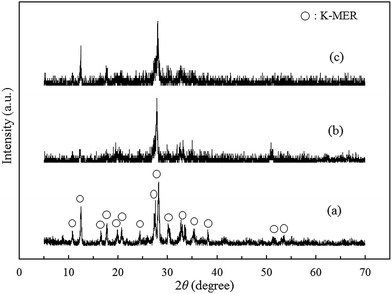 | ||
| Fig. 16 XRD patterns of (a) K-MER (250 °C, 8 h), (b) K-MER after adsorption of Cs+, and (c) K-MER after reverse adsorption of Cs+ to K+. | ||
4. Conclusions
K-Merlinoite of high purity was successfully synthesized by the hydrothermal method with the optimum condition at 250 °C for 8 h. K-Merlinoite exhibited an excellent Cs+ and Sr2+ removal performance with a maximum ion-exchange capacity of 3.08 meq. g−1 for Cs+ and 2.01 meq. g−1 for Sr2+. Coexisting monovalent cations significantly influenced on Cs+ uptake while coexisting divalent cations gave a limited effect on Cs+ removal. Moreover, K-Merlinoite showed an ability to remove Cs+ in artificial seawater. Therefore, K-Merlinoite is an effective and promising adsorbent for Cs+ and Sr2+.Acknowledgements
This work was partly supported by “Strategic Project to Support the Formation of Research Bases at Private Universities”: Matching Fund Subsidy from MEXT (Ministry of Education, Culture, Sports, Science and Technology of Japan), 2012–2016.Notes and references
- B. Filipowicz, M. Pruszyński, S. Krajewski and A. Bilewicz, J. Radioanal. Nucl. Chem., 2014, 301, 889–895 CrossRef CAS PubMed.
- A. Y. Romanchuk, A. S. Kuzenkova, A. S. Slesarev, J. M. Tour and S. N. Kalmykov, Solvent Extr. Ion Exch., 2016, 34, 594–602 CrossRef CAS.
- M. W. Munthali, E. Johan, H. Aono and N. Matsue, Journal of Asian Ceramic Societies, 2015, 3, 245–250 CrossRef.
- D. Banerjee, U. Sandhya, S. Pahan, A. Joseph, A. Ananthanarayanan and J. G. Shah, J. Radioanal. Nucl. Chem., 2017, 311, 893–902 CrossRef CAS.
- C. Delchet, A. Tokarev, X. Dumail, G. Toquer, Y. Barre, Y. Guari, C. Guerin, J. Larionova and A. Grandjean, RSC Adv., 2012, 2, 5707–5716 RSC.
- K. Shakir, M. Sohsah and M. Soliman, Sep. Purif. Technol., 2007, 54, 373–381 CrossRef CAS.
- E. Makrlík and P. Vaňura, J. Radioanal. Nucl. Chem., 2013, 295, 911–914 CrossRef.
- A. M. El-Kamash, J. Hazard. Mater., 2008, 151, 432–445 CrossRef CAS PubMed.
- X.-H. Fang, F. Fang, C.-H. Lu and L. Zheng, Nucl. Eng. Technol., 2017, 49, 556–561 CrossRef CAS.
- A. I. Bortun, L. N. Bortun and A. Clearfield, Solvent Extr. Ion Exch., 1997, 15, 909–929 CrossRef CAS.
- S. P. Mishra, S. S. Dubey and D. Tiwari, J. Radioanal. Nucl. Chem., 2004, 261, 457–463 CrossRef CAS.
- B. Yıldız, H. N. Erten and M. Kış, J. Radioanal. Nucl. Chem., 2011, 288, 475–483 CrossRef.
- S. V. S. Rao, R. Lekshmi, A. G. S. Mani and P. K. Sinha, J. Radioanal. Nucl. Chem., 2010, 283, 379–384 CrossRef CAS.
- A. Bilewicz, R. Dybczynski and J. Narbutt, J. Radioanal. Nucl. Chem., 1991, 148, 359–371 CrossRef CAS.
- K. Terada, H. Hayakawa, K. Sawada and T. Kiba, Talanta, 1970, 17, 955–963 CrossRef CAS.
- N. Li, L. Zhang, Y. Chen, M. Fang, J. Zhang and H. Wang, Adv. Funct. Mater., 2012, 22, 835–841 CrossRef CAS.
- H. Liu, A. Yonezawa, K. Kumagai, M. Sano and T. Miyake, J. Mater. Chem. A, 2015, 3, 1562–1568 CAS.
- P. Rajec and K. Domianová, J. Radioanal. Nucl. Chem., 2008, 275, 503–508 CrossRef CAS.
- O. Y. Golubeva and M. V. Mokeev, Glass Phys. Chem., 2016, 42, 566–575 CrossRef CAS.
- E. H. Borai, R. Harjula, L. Malinen and A. Paajanen, J. Hazard. Mater., 2009, 172, 416–422 CrossRef CAS.
- R. O. A. Rahman, H. A. Ibrahim, M. Hanafy and N. M. A. Monem, Chem. Eng. J., 2010, 157, 100–112 CrossRef.
- G. Atun and N. Bodur, J. Radioanal. Nucl. Chem., 2002, 253, 275–279 CrossRef CAS.
- J. Li, X. Zhuang, O. Font, N. Moreno, V. R. Vallejo, X. Querol and A. Tobias, J. Hazard. Mater., 2014, 265, 242–252 CrossRef CAS.
- Z. Y. Yeo, S.-P. Chai, P. W. Zhu, S.-K. Mah and A. R. Mohamed, New J. Chem., 2015, 39, 4135–4140 RSC.
- C. Colella, D. Caputo, B. de Gennaro and E. Torracca, in Stud Surf. Sci. Catal., ed. M. C. E. van Steen and L. H. Callanan, Elsevier, 2004, vol. 154, Part B, pp. 1920–1928 Search PubMed.
- A. Medina, P. Gamero, J. M. Almanza, A. Vargas, A. Montoya, G. Vargas and M. Izquierdo, J. Hazard. Mater., 2010, 181, 91–104 CrossRef CAS.
- P. Worathanakul, D. Trisuwan, A. Phatruk and P. Kongkachuichay, Colloids Surf., A, 2011, 377, 187–194 CrossRef CAS.
- A. A. Belhekar, A. J. Chandwadkar and S. G. Hegde, Zeolites, 1995, 15, 535–539 CrossRef CAS.
- B. M. Skofteland, O. H. Ellestad and K. P. Lillerud, Microporous Mesoporous Mater., 2001, 43, 61–71 CrossRef CAS.
- A. Bieniok, K. Bornholdt, U. Brendel and W. H. Baur, J. Mater. Chem., 1996, 6, 271–275 RSC.
- J. G. Thompson, A. Melnitchenko, S. R. Palethorpe and R. L. Withers, J. Mater. Chem., 1997, 7, 673–679 RSC.
- R. W. Tschernich, Zeolites of the World, Geoscience Press, 1992 Search PubMed.
- P. A. Barrett, S. Valencia and M. A. Camblor, J. Mater. Chem., 1998, 8, 2263–2268 RSC.
- J. Skibsted, M. T. Pedersen and J. Holzinger, J. Phys. Chem. C, 2017, 121, 4011–4017 CAS.
- C. Wan, M. Y. Hu, N. R. Jaegers, D. Shi, H. Wang, F. Gao, Z. Qin, Y. Wang and J. Z. Hu, J. Phys. Chem. C, 2016, 120, 23093–23103 CAS.
- A. D
![[a with combining cedilla]](https://www.rsc.org/images/entities/char_0061_0327.gif) browski, Z. Hubicki, P. Podkościelny and E. Robens, Chemosphere, 2004, 56, 91–106 CrossRef.
browski, Z. Hubicki, P. Podkościelny and E. Robens, Chemosphere, 2004, 56, 91–106 CrossRef. - J. T. T. Foster, Y. Hu and T. H. Boyer, Sep. Purif. Technol., 2017, 175, 229–237 CrossRef CAS.
- S. A. Abo-Farha, A. Y. Abdel-Aal, I. A. Ashour and S. E. Garamon, J. Hazard. Mater., 2009, 169, 190–194 CrossRef CAS.
- P. D'Angelo, V. Migliorati, F. Sessa, G. Mancini and I. Persson, J. Phys. Chem. B, 2016, 120, 4114–4124 CrossRef.
- J. Mähler and I. Persson, Inorg. Chem., 2012, 51, 425–438 CrossRef PubMed.
| This journal is © The Royal Society of Chemistry 2017 |

