 Open Access Article
Creative Commons Attribution 3.0 Unported Licence
Influence of support on the catalytic properties of Pt–Sn–K/θ-Al2O3 for propane dehydrogenation†
Yu Shi ab,
Xianru Liab,
Xin Rongab,
Bin Guab,
Huangzhao Weia and
Chenglin Sun*a
aDalian National Laboratory for Clean Energy, Dalian Institute of Chemical Physics, Chinese Academy of Sciences, Dalian, Liaoning 116023, PR China. E-mail: clsun@dicp.ac.cn; Fax: +86 84699965; Tel: +86 84379133
bUniversity of Chinese Academy of Sciences, Beijing 100049, PR China
First published on 4th April 2017
Abstract
A study on the performance of Pt(0.3 wt%)Sn(0.2 wt%)K(0.5 wt%) catalysts supported on four different θ-Al2O3 for propane dehydrogenation is reported in this study. The θ-Al2O3 used as supports were prepared by four different methods as (a) calcination of the commercial γ-Al2O3 at 1223 K for 12 h, (b) synthesis by hydrochloric acid reflux method, (c) precipitation of Al(NO3)3·9H2O with ammonia solution and (d) extrusion use pseudo-boehmite powder, respectively. They were characterized by using XRD, BET, SEM, H2-TPR, NH3-TPD, CO-chemisorption, XPS and TG-DTA methods to study which characteristics of the carrier will affect the performance of the catalyst. The results show that high acidity and strong interactions of the Sn support can improve the propane dehydrogenation activity of the catalyst, large pore volume and large pore diameter can enhance the stability of the catalyst. Al2O3 synthesized by method (b) has the largest pore volume, pore diameter, relatively high surface acidity and strong interaction with Sn, which meant the catalyst with the support prepared by method (b) showed the highest propane conversion and superior selectivity. The average conversion is 38.6% and the average selectivity is 95.2% during the reaction time of 25 h.
Introduction
There is growing interest in the catalytic dehydrogenation of propane due to the high demand for propylene.1 Propylene is important in the production of various basic compounds, such as propylene oxide, polypropylene, cumene, acrylonitrile, isopropylic alcohol, etc.2–5 In alkylation and oligomerization reactions, propylene is also used to produce clean fuel with a high octane number, an alkylate-blended, etc.6 To achieve high yields of propylene, high reaction temperatures (823–883 K) and low pressures are always required since the propane dehydrogenation (PDH) is highly endothermic ( = +124 kJ mol−1) and equilibrium limited. Thus, the deactivation of catalyst caused by coke formation is unavoidable.7 To overcome this problem, more efficient catalysts with high-activity, high-selectivity and high-stability are under developed to enhance the propylene yield.
The platinum–tin–potassium-supported catalysts have drawn intense attention in paraffin dehydrogenation reactions.8–12 Over the platinum-based catalysts, it is benefit to improve the stability and selectivity while suppressing hydrogenolysis reactions, cracking and coke formation process. The addition of alkali metal K can generally neutralize some acid sites of the support. The interaction between metal Pt and Sn, the valence of Sn, the properties of the support and the interactions between metal and support strongly influence the catalytic properties of PtSnK trimetallic catalysts. Sn0 may be a poison, while it could also acts as a promoter as Sn4+ or Sn2+.13,14 Moreover, suitable textural properties of the support and strong interactions between loaded metals and support are beneficial for the improvement of catalyst performance for propane dehydrogenation.15,16 Zhang et al.17 found uniform pore size distribution and a relatively large surface area of the support were favorable for the improvement of the dispersion of active metallic particles. Supports which with large pore size is beneficial for coke to cover the external surface of the support first instead of the metallic surface. There are many papers studied the influence of different supports on the alkane dehydrogenation process,17–22 the supports they studied include ZSM-5, SBA-15, SiO2, spinels (ZnAl2O4, MgAl2O4), γ-Al2O3, etc. But the effects of the preparation methods of θ-Al2O3 supports on the catalytic propane dehydrogenation performances have not yet been reported so far. In addition, θ-Al2O3 was selected as support by UOP Oleflex process in the industry. So, the study about the influence of different θ-Al2O3 support on the catalytic propane dehydrogenation is necessary.
In this paper, four different synthesis ways of θ-Al2O3 supports have been employed, and were applied as Pt based catalyst supports for propane dehydrogenation. The performance of these catalysts on propane dehydrogenation was systematically compared. Many physicochemical characterization methods were applied to demonstrate the influence of synthesize routes on the properties of θ-Al2O3 supports and further clarify the influence on PtSnK propane dehydrogenation catalysts, then the most suitable support was selected.
Experimental
Preparation of different alumina supports
Four kinds of θ-Al2O3 supports (20–40 mesh) were used in this work. Among them, Al2O3-A support was prepared by calcining the commercial γ-Al2O3 at 1223 K for 12 h. Al2O3-B support is synthesized by HCl reflux method. Aluminum foil (99.999%, 40 g) and HCl (11%, 307 g) were mixed under a rotating rate of 50 rpm and slowly heated to 95 °C. When the aluminum foil began to dissolve, the rotating rate was adjusted to 300 rpm. The alumina sol was obtained until the aluminum foil was completely dissolved. Hexamethylenetetramine (HMT) solution (40%, 24 g) was then added to the above alumina sol (70 g). After being well mixed, the mixture was dropped into the oil column. The alumina spheres were then aged at 140 °C for 17 h in an autoclave, which were further treated by washing, drying and calcining at 1223 K for 12 h. Al2O3-C support is synthesized by ammonia precipitation method. Ammonia (8%) was dropped into aluminum nitrate solution (1 mol L−1) at 40 °C and 300 rpm until the pH value reached 8. The precipitation reaction lasted for 1 h and the precipitate was then subjected to aging 4 h, washing with de-ionized water, drying at 120 °C for 12 h and calcining at 1223 K for 12 h. Al2O3-D support is synthesized by extrusion with pseudo-boehmite powder bought from Korea, then dried and calcined at 1223 K for 12 h. The complete conversion to θ-Al2O3 of the four supports were proved by XRD measurements.Catalyst preparation
The trimetallic catalysts were prepared through a previously developed vacuum complex impregnation method.20 A predetermined amount of H2PtCl6·6H2O (Aladdin, Pt 37.5% min) and SnCl2·2H2O (Aladdin, AR, 98%) were dissolved in de-ionized under N2 (purity 99.995%) atmosphere in order to form Pt–Sn complex, which indicated by the red color of the mixture.23 Then KNO3 aqueous solution was added thereafter. The impregnation solution was impregnated onto the alumina supports which were previously degassed for 30 min under vacuum at room temperature. The catalysts were dried at 60–70 °C in vacuum for 30 min before drying at 120 °C overnight. Finally, catalysts were calcined at 600 °C for 6 h in air atmosphere with a ramp rate of 10 °C min−1. Those four catalysts were denoted as Cat-A, Cat-B, Cat-C and Cat-D, respectively. The nominal loading amounts on each sample were 0.3 wt% for Pt, 0.2 wt% for Sn and 0.5 wt% for K.Catalyst characterizations
The powder X-ray diffraction (XRD) patterns were obtained on an Empyrean powder X-ray diffractometer (Netherlands) at 0 kV and 40 mA in the scan 2θ range of 10–90°.The textural properties of the alumina supports were calculated from N2 adsorption–desorption isotherms collected at liquid nitrogen temperature by a volumetric adsorption system (Quantachrome Autosorb-1, American). All the samples were previously degassed for 5 h under vacuum hood at 300 °C. The Brunauer–Emmett–Teller (BET) method was applied to calculate the specific surface areas of the samples and the desorption branch of the isotherms was used to calculate the average pore diameter by the Barrett–Joyner–Halenda (BJH) pore size model.
The SEM images were taken using a scanning electron microscope (JSM-7800F) operating at 20 kV.
The acidic of each samples were measured by NH3-TPD experiments on a Micromeritics Auto-Chem II 2910 (American) chemisorption analyzer. Samples (0.10 g) which pre-dried at 120 °C overnight were placed in a U-type quartz sample tube. NH3 was saturated at 100 °C after pretreatment at 600 °C for 1 h under helium stream (30 mL min−1). Subsequently, the desorption of ammonia was determined by a thermal conductivity detector at temperatures from 100 °C to 600 °C at a temperature ramp rate of 10 °C min−1.
Temperature-programmed reduction (TPR) method was used to measure the reducibility of the catalysts by a Micromeritics Auto-Chem II 2910 apparatus (American). Samples (0.20 g) which pre-dried at 120 °C overnight were placed in a U-shaped quartz reactor. The samples were pretreated in situ by flowing dry argon (99.99%, 30 mL min−1) at 300 °C for 2 h. After cooled to room temperature, 10% H2 in Ar was switched and the samples were heated to 700 °C at a ramp rate of 10 °C min−1. The hydrogen consumption was monitored by a TCD detector.
The XPS data of Pt–Sn–K/θ-Al2O3 catalysts were investigated on ESCALAB 250Xi using Al Kα radiation. All catalysts were previously reduced in a hydrogen flow at 600 °C for 2 h. The binding energies (BE) were calibrated using the C1s level at 284.6 eV with an uncertainty of ±0.2 eV.
The Pt dispersion of the catalysts were measured by pulse chemisorption of CO experiments (Micromeritics AutoChem II 2910, American). Samples (0.10 g) were pretreated under a He stream at 500 °C for 1 h to remove the moistures and other impurities. Then the samples were reduced under H2 atmosphere (99.99%, 30 mL min−1) at 600 °C for 1 h, and purged in He (99.99%, 30 mL min−1) at 600 °C for 1 h, CO was saturated after cooling to 50 °C in flowing He (30 mL min−1). The amount of the chemisorbed CO was determined by a TCD detector. A stoichiometry of CO![[thin space (1/6-em)]](https://www.rsc.org/images/entities/char_2009.gif) :
:![[thin space (1/6-em)]](https://www.rsc.org/images/entities/char_2009.gif) Pt = 1 was assumed to estimate the dispersion of Pt.
Pt = 1 was assumed to estimate the dispersion of Pt.
The coke content was measured by a thermo gravimetric and differential thermo analysis (TG-DTA) apparatus (TA Q600, P R China) with a temperature increasing rate of 10 °C min−1 from room temperature to 800 °C in an air flow of 50 mL min−1.
Catalytic activity test
The propane dehydrogenation reaction was performed with the prepared catalysts in a quartz fixed-bed reactor (inner diameter: 8 mm) heated by an electric furnace. The catalysts were heated to 600 °C at a ramp rate of 5 °C min−1 and reduced in situ in flowing H2 for 2 h prior to the reaction. The reaction was conducted at 600 °C with 0.25 g samples and WHSV was 4 h−1 (H2/C3H8 molar ratio = 0.5![[thin space (1/6-em)]](https://www.rsc.org/images/entities/char_2009.gif) :
:![[thin space (1/6-em)]](https://www.rsc.org/images/entities/char_2009.gif) 1). Ten minutes later, the gas compositions of the reactants and products were collected and analyzed by an on-line gas chromatograph (Agilent 7890A, American) using a flame ionization detector (FID). The gas chromatograph was operated under an inlet temperature of 180 °C, an oven temperature of 105 °C and detector temperature of 200 °C.
1). Ten minutes later, the gas compositions of the reactants and products were collected and analyzed by an on-line gas chromatograph (Agilent 7890A, American) using a flame ionization detector (FID). The gas chromatograph was operated under an inlet temperature of 180 °C, an oven temperature of 105 °C and detector temperature of 200 °C.
The propane conversion (X%) and the propylene selectivity (S) were calculated according to the following formulate:
where n(C3H8)in represents the molar content of propane in feed, n(C3H8)out and n(C3H6)out is the molar content of propane and propylene in the product.
Results and discussion
Catalytic performance
The performance of the four Pt–Sn–K catalysts supported on different types of θ-Al2O3 are compared in Fig. 1, and significant differences among the four catalysts as a function of the alumina supports could be seen obviously. The conversion of propane catalyzed by those four catalysts were 40.1, 39.9, 40.4 and 38.9%, respectively, initially, and gradually decreased to 36.4%, 38.2%, 35.2% and 32.1%, respectively, after 25 h. A deactivation parameter D (defined as D = [X0 − Xf] × 100%/X0, where X0 and Xf represent the initial and final propane conversion, respectively) is used to characterize the catalytic stability. The values of D for the four catalysts are 9.4, 4.2, 12.9 and 17.5%, respectively. It is obvious that Cat-B exhibited the highest reaction activity and the lowest deactivation value during the 25 h tests, suggesting that Al2O3-B is more favorable for propane dehydrogenation than the other three supports. Besides, the selectivity of all four catalysts increased gradually with the prolongation of reaction time, which could be explained by that the coke can gradually cover the active metal centers which for coking and cracking reactions with the prolongation of reaction time.15,20,24 The average selectivity to propene over the four catalysts during the 25 h tests were 95.5%, 95.2%, 94.3% and 95.4%. The results above shows that the selectivity for all the catalysts is high, but Cat-D prepared by extrusion use pseudo-boehmite powder as support was poorer in propane dehydrogenation activity and stability when compared with others. The by-products (methane, ethane and ethylene) produced in the process were also analyzed (see Fig. S1 in the ESI†). It should be noted that under the experimental conditions, Cat-B showed the most satisfactory propane dehydrogenation performance, which attributed to the superior support Al2O3-B.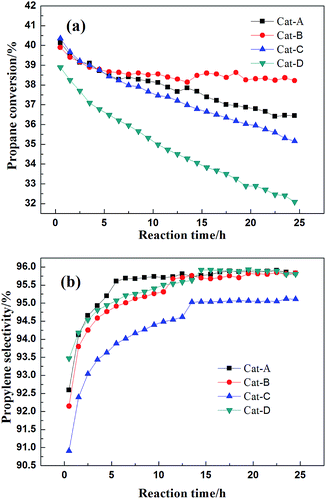 | ||
Fig. 1 (a) Propane conversion and (b) propylene selectivity over the four different catalysts (reaction conditions: T = 600 °C, H2![[thin space (1/6-em)]](https://www.rsc.org/images/entities/char_2009.gif) : :![[thin space (1/6-em)]](https://www.rsc.org/images/entities/char_2009.gif) C3H8 = 0.5 C3H8 = 0.5![[thin space (1/6-em)]](https://www.rsc.org/images/entities/char_2009.gif) : :![[thin space (1/6-em)]](https://www.rsc.org/images/entities/char_2009.gif) 1, WHSV = 4 h−1, mcat = 0.25 g). 1, WHSV = 4 h−1, mcat = 0.25 g). | ||
Properties of alumina supports
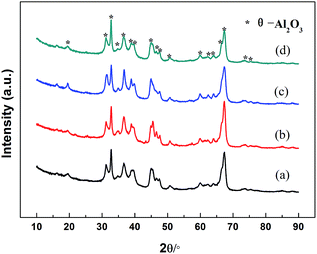
XRD patterns of the four types of alumina supports synthesized by different methods are shown in Fig. 2. It can be observed that all samples display the similar XRD patterns. The peaks at 2θ = 19.54°, 32.78°, 39.86°, 44.83°, 50.70° and 67.42°, with d values of 0.454, 0.273, 0.226, 0.202, 0.180 and 0.139 nm, respectively, are assigned to monoclinic θ-Al2O3 phase (ICDD file no. 00-035-0121), which should be ascribed to the high calcination temperature of 1223 K.25,26The isotherms and the pore size distributions of four alumina supports are presented in Fig. 3. According to the IUPAC classification,27 all samples exhibit type IV N2 adsorption isotherm with H1-type hysteresis loop, which suggested the presence of meso-pores or macro-pores.28,29 When the size of meso-pores in the alumina support decrease (Fig. 3b), the capillary condensation steps will slightly shift to lower relative pressures (Fig. 3a), which is in accord with the literature.15
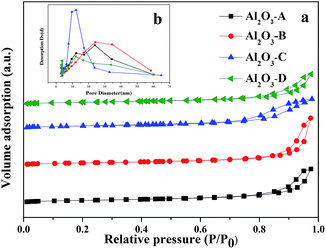 | ||
| Fig. 3 Nitrogen adsorption–desorption isotherms and pore size distributions of different alumina supports. | ||
The textural properties such as surface area, pore size and pore volume of the samples were calculated from the nitrogen adsorption–desorption study and are listed in Table 1. It is obvious that the four supports are quite different in surface area, pore size distributions and total pore volume. Al2O3-C presented the largest surface area of 104.6 m2 g−1 with abundant small pores,30 while Al2O3-D with less pores only shows the smallest surface area as 56.6 m2 g−1. On the other hand, Al2O3-B shows the largest pore volume (0.49 cm3 g−1), pore diameter (24.2 nm) and the widest pore size distribution.
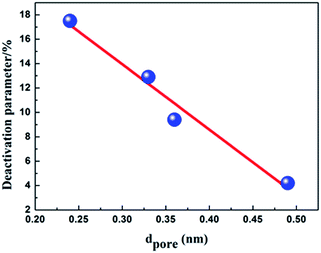
It is well known, propane dehydrogenation catalysts lost the activity mainly due to the accumulation of coke.31–33 From Fig. 4, we can see that the deactivation parameter of the four catalysts is nearly negatively linear correlated with the average pore diameter, that is to say, the stability of the catalyst increased with the increase of the pore diameter. The deactivation parameter decreased with the increase of the total pore volume too (see Fig. S2 in the ESI†). Those results proved that the catalyst support which have large pore size and pore volume can more effectively overcome diffusion and mass transfer limitations, and could help the coke deposits migrate from the active sites to supports, improve the stability of the catalysts. For Al2O3-B synthesized by hydrochloric acid reflux method has the largest pore volume (0.49 cm3 g−1), pore diameter (24.2 nm), the widest pore size distribution, we can speculate that Cat-B ought to be more resistant to coking, show best stability during the reaction, reasonably, and it fits the experimental results well.
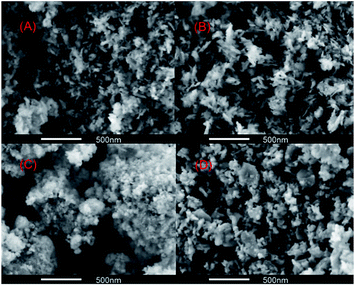
The surface structure of alumina synthesized by different methods was revealed by a SEM technique. Fig. 5 showed the representative SEM images of the four alumina samples. It can be seen that Al2O3-A and Al2O3-B show wider pore size distribution and larger pore size, which is in accordance with the results of nitrogen adsorption–desorption study. The pores with diameter of more than 20 nm could also be found in the images. For Al2O3-C and Al2O3-D, most pores of less than 20 nm in diameter implied that the mesoporous structure is exist.
Physicochemical properties of Pt–Sn–K/θ-Al2O3 catalysts
As determined from CO pulse chemisorption, the Pt dispersion and particle sizes are listed in Table 2. Cat-B exhibits the highest Pt dispersion and the smallest Pt particle size which may be ascribed to its wide pore size distribution and relatively large surface area. According to the related studies,34 the Pt particle size has a significant influence on the dehydrogenation activity of Pt–Sn–K/Al2O3 catalysts since the dehydrogenation reaction is more likely to take place on small Pt clusters on the catalyst surface and the side reactions need larger platinum ensembles. Therefore, the superior activity of Cat-B could be revealed partly by the smaller Pt particles present on its surface.| Catalysts | Pt dispersiona (%) | Average particle sizea (nm) | Average conversionb (%) | Coke contentsc (%) | Deactivation parameterd (%) |
|---|---|---|---|---|---|
| a Calculated by CO-pulse chemisorption of fresh PtSnK catalysts.b The average conversion of propane during the 25 h reaction.c The coke contents of the deactivated catalysts by thermogravimetric experiments.d Deactivation parameter for the 25 h reaction. | |||||
| Cat-A | 51.1 | 2.2 | 37.8 | 2.61 | 9.4 |
| Cat-B | 55.1 | 2.0 | 38.6 | 2.99 | 4.2 |
| Cat-C | 37.5 | 3.0 | 37.3 | 3.66 | 12.9 |
| Cat-D | 47.6 | 2.4 | 34.8 | 0.99 | 17.5 |
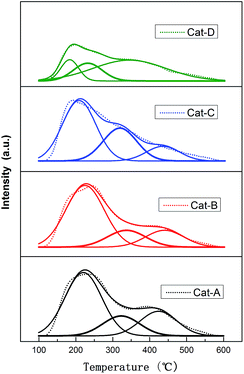
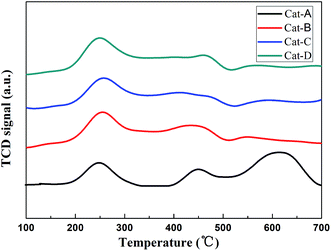
NH3-TPD method was employed to determine the acidity of solid catalysts. It is well known that the acid properties of the catalyst markedly affect the dehydrogenation performance of the catalyst. The acidity of the four Pt–Sn–K/Al2O3 catalysts was examined by NH3-TPD profiles as depicted in Fig. 6.
Gaussian deconvolution method was used to the semi-quantitative analysis of the ammonia desorption peaks. The calculated results are compiled in Table 3. All samples exhibit three peaks. For Cat-A, Cat-B and Cat-C, the peak centered around 210 °C (peak I), 320 °C (peak II) and 430–450 °C (peak III) should be attributed to weak, medium and strong acid sites, respectively. For Cat-D, the first (peak I) and the second (peak II) peak can be ascribed to weak acid sites, and the third peak (peak III) can be assigned to medium and strong acid sites.35,36 According to the total desorption peak area, it can be inferred that the order of the total acid content of the four catalysts are as follows: Cat-B > Cat-A ≈ Cat-C > Cat-D. Note that a majority of acidic centers exhibited on Cat-A, Cat-B and Cat-C is weak or medium acid sites. But as for Cat-D, the medium or strong acidic centers are dominant.
| Catalysts | TM (°C) | Total acidity (mmol NH3 per g) | Peak fraction (%) | Fitted parameters (R2) | ||||
|---|---|---|---|---|---|---|---|---|
| I | II | III | I | II | III | |||
| Cat-A | 216.7 | 314.7 | 432.4 | 0.27 | 0.47 | 0.39 | 0.14 | 0.9823 |
| Cat-B | 221.3 | 330.1 | 451.3 | 0.30 | 0.51 | 0.41 | 0.08 | 0.9878 |
| Cat-C | 208.8 | 319.4 | 436.0 | 0.26 | 0.56 | 0.30 | 0.14 | 0.9819 |
| Cat-D | 183.5 | 232.2 | 345.1 | 0.16 | 0.16 | 0.21 | 0.63 | 0.9923 |
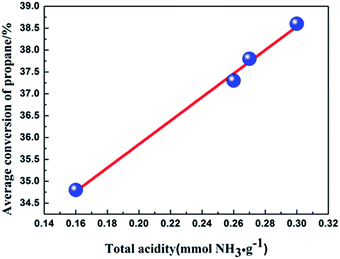
The average conversion of propane versus the total acidity of the four catalysts are depicted in Fig. 7. Interestingly, the relationship between the average conversion of propane and the total acidity of the four catalysts is linear. The results indicate that the acidity of the catalyst not only affect the distribution of the products, but also influence the propane dehydrogenation activity of the catalyst in our experiment.
The influences of the four alumina supports on the reduction properties were characterized by H2-TPR as shown in Fig. 8. It is evident that all the catalysts show at least three reduction peaks at about 250 °C (peak I), 440 °C (peak II) and 600 °C (peak III), respectively. For the signal at 250 °C is belong to the reduction of Pt oxides,37 whereas the peaks at high-temperature can be ascribed to the partial reduction of Sn4+ to Sn2+ and Sn2+ to Sn0, respectively.38,39 Cat-A presents an evident reduction peak higher than 600 °C which corresponding to the reduction of Sn2+ to Sn0. For Cat-B, the reduction peak corresponding to Sn2+ to Sn0 is the smallest, and most Sn can keep in the oxidation state, which can act as a promoter, this implying strong interactions of the Sn support.
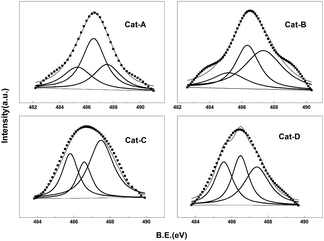
The XPS spectra and the detailed data of Sn3d5/2 of Pt–Sn–K/θ-Al2O3 catalysts are shown in Fig. 9 and Table 4, respectively. The Sn3d5/2 XPS spectra of the four catalysts were deconvoluted into three peaks at ∼485.3, ∼486.5 and ∼487.5 eV in Fig. 9, corresponding to different chemical states of Sn. Generally speaking, the component at low binding energy (∼485.3 eV) is assigned to the reduced tin phase, either in the metallic (Sn0) or in the alloyed (SnPtx) state; whereas the two others (∼486.5 and ∼487.5 eV) are ascribed to oxides tin with different types (Sn2+ or Sn4+).33,40 However, Sn2+ and Sn4+ can't be discriminate according to XPS spectra alone because their binding energy is very close.41–43
| Catalysts | Binding energy (eV) | ||
|---|---|---|---|
| Sn3d5/2 | |||
| Cat-A | 485.3(25.4%) | 486.5(47.4%) | 487.5(27.2%) |
| Cat-B | 485.2(17.7%) | 486.3(33.7%) | 487.3(48.6%) |
| Cat-C | 485.8(27.2%) | 486.6(19.9%) | 487.5(52.9%) |
| Cat-D | 485.5(30.6%) | 486.5(31.9%) | 487.4(37.5%) |
According to the peak percentage given in parentheses in Table 4, the zero valent Sn percentage of the four catalysts are 25.4%, 17.7%, 27.2% and 30.6%, respectively. Tin species in oxidized form is dominant. Sn in zero valent is harmful for catalyst performance and Sn in the oxidation state is benefit for propane dehydrogenation. The presence of SnOx can increase the catalytic stability for they can keep the Pt sites clean from coke deposits.44 This implies that different synthesis routes of alumina can influence the properties of the support, and an appropriate alumina synthesis route could strengthen the Sn–Al2O3 interaction, stabilizing the oxidized tin species. For the zerovalent Sn percentage of Cat-B is slightly lower than that of the other three catalysts, which is in accordance with the TPR experiment, indicates that the alumina synthesized by oil-dropped method can interact stronger with Sn species and restrain the reduction of tin species. Cat-B which have the lowest Sn0 percentage shows the highest average propane conversion and the lowest deactivation parameter.
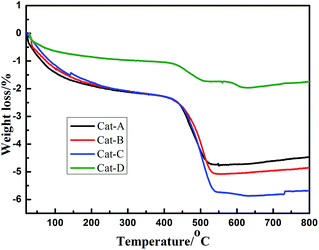
As mentioned before, the main reason for the catalyst deactivation in such studies is coking.45,46 After the reaction of 25 h, the coke amount deposited over the four catalysts was analyzed by TG measurements as depicted in Fig. 10. The weight losses above 300 °C are attributed to the combustion of coke deposited on the catalysts.47 Fig. 10 illustrates that the contents of coke deposited on the four catalysts are 2.61%, 2.99%, 3.66% and 0.99%, respectively, there is no obvious correlation between the amount of coke on the spent catalysts and the final catalytic activity. The highest amount of coke is observed over Cat-C may due to its lowest propene selectivity, and the coke on Cat-D with the lowest propane conversion is the least. Although the amount of coke over Cat-B is more than Cat-A, the activity of Cat-B in propane dehydrogenation experiment is better. As mentioned before that large pore size and large pore volume is benefit to overcome mass transfer and diffusion limitations, and could help the coke deposit migration from active sites to supports. With the addition of HMT, the pore-forming mechanism of Al2O3-B is very different from the other three alumina support, the decomposition of HMT during the calcination process can produce relatively large pores for Al2O3-B. Therefore, we can conclude that the coke in Cat-B is mainly located on the alumina support and does not block active sites, and therefore, though the coke content of Cat-B is not the least, it keeps the best final catalytic activity and the best stability.
Conclusions
In this work, the influences of four different θ-Al2O3 supports (synthesized by different methods) on catalytic structure and reaction performances of PtSnK catalysts for propane dehydrogenation were investigated. The correlation between the physicochemical parameters of the catalysts and the dehydrogenation performance of propane was established, and these could afford some guidance for the selection of a θ-Al2O3 support for propane dehydrogenation process. High propane dehydrogenation activity was achieved on the catalyst with high acidity and strong interactions of the Sn support. Good stability was achieved on the catalyst with large pore volume and pore diameter. Cat-B with the support prepared by hydrochloric acid reflux method has the largest pore volume (0.49 cm3 g−1), pore diameter (24.2 nm), the widest pore size distribution, relatively large surface area (81.0 m2 g−1), and it also has relatively high surface acidity and stronger interactions with Sn species compared to the other three catalysts. All those characteristics make Cat-B an optimal catalytic performance, higher propane conversion and catalytic stability, the average conversion is 38.6%, the average selectivity is 95.2% and the deactivation parameter is only 4.2% during the reaction time of 25 h.Conflict of interest
We declare that we do not have any conflict of interest.Acknowledgements
This work was finically supported by Liaoning Provincial Natural Science Foundation of China (Grant No. 2013020111) and the Key Programs of the Chinese Academy of Sciences (Grant No. ZDRW-ZS-2016-5). We thank Yamin Wang, Wenjing Sun and Zhenglong He for the useful advices on our article.References
- F. T. Zangeneh, A. Taeb, K. Gholivand and S. Sahebdelfar, Appl. Surf. Sci., 2015, 357, 172 CrossRef CAS.
- A. Corma, F. V. Melo, L. Sauvanaud and F. Ortega, Catal. Today, 2005, 107, 699 CrossRef.
- Q. Li, Z. Sui, X. Zhou and D. Chen, Appl. Catal., A, 2011, 398, 18 CrossRef CAS.
- J. S. Plotkin, Catal. Today, 2005, 106, 10 CrossRef CAS.
- R. Watanabe, Y. Hondo, K. Mukawa, C. Fukuhara, E. Kikuchi and Y. Sekine, J. Mol. Catal. A: Chem., 2013, 377, 74 CrossRef CAS.
- M.-H. Lee, B. M. Nagaraja, P. Natarajan, T. Ngoc Thanh, K. Y. Lee, S. Yoon and K.-D. Jung, Res. Chem. Intermediat., 2016, 42, 123 CrossRef CAS.
- K. H. Kang, T. H. Kim, W. C. Choi, Y.-K. Park, U. G. Hong, D. S. Park, C.-J. Kim and I. K. Song, Catal. Commun., 2015, 72, 68 CrossRef CAS.
- D. Rodriguez, J. Sanchez and G. Arteaga, J. Mol. Catal. A: Chem., 2005, 228, 309 CrossRef CAS.
- Y. Zhang, Y. Zhou, X. Sheng, L. Wan, Y. Li, Y. Xiao, B. Yu and Z. Zeng, Fuel Process. Technol., 2012, 104, 23 CrossRef CAS.
- Z. Ma, Y. Mo, J. Li, C. An and X. Liu, J. Nat. Gas Sci. Eng., 2015, 27, 1035 CrossRef CAS.
- Y. Zhang, Y. Zhou, S. Zhang, S. Zhou, X. Sheng, Q. Wang and C. Zhang, J. Mater. Sci., 2015, 50, 6457 CrossRef CAS.
- B. M. Nagaraja, H. Jung, D. R. Yang and K.-D. Jung, Catal. Today, 2014, 232, 40 CrossRef CAS.
- W. S. Yang, L. W. Lin, Y. N. Fan and J. L. Zang, Catal. Lett., 1992, 12, 267 CrossRef CAS.
- R. Burch and L. C. Garla, J. Catal., 1981, 71, 360 CrossRef CAS.
- S. Zhou, Y. Zhou, J. Shi, Y. Zhang, X. Sheng and Z. Zhang, J. Mater. Sci., 2015, 50, 3984 CrossRef CAS.
- L. Bai, Y. Zhou, Y. Zhang, H. Liu and X. Sheng, Ind. Eng. Chem. Res., 2009, 48, 9885 CrossRef CAS.
- Y. W. Zhang, Y. M. Zhou, J. J. Shi, S. J. Zhou, X. L. Sheng, Z. W. Zhang and S. M. Xiang, J. Mol. Catal. A: Chem., 2014, 381, 138 CrossRef CAS.
- S. J. Zhou, Y. M. Zhou, Y. W. Zhang, X. L. Sheng and Z. W. Zhang, J. Chem. Technol. Biotechnol., 2016, 91, 1072 CrossRef CAS.
- C. T. Shao, W. Z. Lang, X. Yan and Y. J. Guo, RSC Adv., 2017, 7, 4710 RSC.
- S. He, C. Sun, Z. Bai, X. Dai and B. Wang, Appl. Catal., A, 2009, 356, 88 CrossRef CAS.
- S. Bocanegra, A. Ballarini, O. Scelza and S. de Miguel, Mater. Chem. Phys., 2008, 111, 534 CrossRef CAS.
- S. Bocanegra, A. Ballarini, P. Zgolicz, O. Scelza and S. de Miguel, Catal. Today, 2009, 143, 334 CrossRef CAS.
- L. Y. Jin, Appl. Catal., 1991, 72, 33 CrossRef CAS.
- C. Yu, H. Xu, Q. Ge and W. Li, J. Mol. Catal. A: Chem., 2007, 266, 80 CrossRef CAS.
- I. Levin and D. Brandon, J. Am. Ceram. Soc., 1998, 81, 1995 CrossRef CAS.
- J. M. Hao, Polyhedron, 1996, 15, 2421 CrossRef.
- K. S. W. Sing, D. H. Everett, R. A. W. Haul, L. Moscou, R. A. Pierotti, J. Rouquerol and T. Siemieniewska, Pure Appl. Chem., 1985, 57, 603 CrossRef CAS.
- C. Larese, J. M. Campos-Martin and J. L. G. Fierro, Langmuir, 2000, 16, 10294 CrossRef CAS.
- M. A. Wahab and C. S. Ha, J. Mater. Chem., 2005, 15, 508 RSC.
- L. D. Sharma, M. Kumar, A. K. Saxena, M. Chand and J. K. Gupta, J. Mol. Catal. A: Chem., 2002, 185, 135 CrossRef CAS.
- G. J. Siri, G. R. Bertolini, M. L. Casella and O. A. Ferretti, Mater. Lett., 2005, 59, 2319 CrossRef CAS.
- M. L. Casella, G. J. Siri, G. F. Santori, O. A. Ferretti and M. M. Ramirez-Corredores, Langmuir, 2000, 16, 5639 CrossRef CAS.
- S. A. Bocanegra, A. Guerrero-Ruiz, S. R. de Miguel and O. A. Scelza, Appl. Catal., A, 2004, 277, 11 CrossRef CAS.
- H. S. B. Dalian, Studies on the catalysts and the coke deposition behavior of the dehydrogenation of long chain paraffins(C10–C19), Dalian Institute of Chemical Physics, Chinese Academy of Sciences, 2009 Search PubMed.
- P. Iengo, M. Di Serio, V. Solinas, D. Gazzoli, G. Salvio and E. Santacesaria, Appl. Catal., A, 1998, 170, 225 CrossRef CAS.
- P. Iengo, M. Di Serio, A. Sorrentino, V. Solinas and E. Santacesaria, Appl. Catal., A, 1998, 167, 85 CrossRef CAS.
- L. S. Carvalho, C. L. Pieck, M. C. Rangel, N. S. Figoli, J. M. Grau, P. Reyes and J. M. Parera, Appl. Catal., A, 2004, 269, 91 CrossRef CAS.
- Y. Zhang, Y. Zhou, H. Liu, Y. Wang, Y. Xu and P. Wu, Appl. Catal., A, 2007, 333, 202 CrossRef CAS.
- J. Shi, Y. Zhou, Y. Zhang, S. Zhou, Z. Zhang, J. Kong and M. Guo, J. Mater. Sci., 2014, 49, 5772 CrossRef CAS.
- A. D. Ballarini, C. G. Ricci, S. R. de Miguel and O. A. Scelza, Catal. Today, 2008, 133, 28–34 CrossRef.
- J. C. Serrano-Ruiz, G. W. Huber, M. A. Sanchez-Castillo, J. A. Dumesic, F. Rodriguez-Reinoso and A. Sepulveda-Escribano, J. Catal., 2006, 241, 378–388 CrossRef CAS.
- F. Coloma, A. SepulvedaEscribano, J. L. G. Fierro and F. RodriguezReinoso, Appl. Catal., A, 2009, 148, 63–80 CrossRef.
- F. Coloma, A. SepulvedaEscribano, J. L. G. Fierro and F. RodriguezReinoso, Appl. Catal., A, 1996, 136, 231–248 CrossRef CAS.
- A. Iglesias-Juez, A. M. Beale, K. Maaijen, T. C. Weng, P. Glatzel and B. M. Weckhuysen, J. Catal., 2010, 276, 268–279 CrossRef CAS.
- Q. Li, Z. Sui, X. Zhou, Y. Zhu, J. Zhou and D. Chen, Top. Catal., 2011, 54, 888 CrossRef CAS.
- Z. Nawaz, F. Baksh, J. Zhu and F. Wei, J. Ind. Eng. Chem., 2013, 19, 540 CrossRef CAS.
- N. Martin, M. Viniegra, R. Zarate, G. Espinosa and N. Batina, Catal. Today, 2005, 107, 719 CrossRef.
Footnote |
| † Electronic supplementary information (ESI) available. See DOI: 10.1039/c7ra02141k |
| This journal is © The Royal Society of Chemistry 2017 |


