 Open Access Article
Creative Commons Attribution 3.0 Unported Licence
Differential effects of in vitro cultures of Linum usitatissimum L. (Flax) on biosynthesis, stability, antibacterial and antileishmanial activities of zinc oxide nanoparticles: a mechanistic approach
Bilal Haider Abbasi *a,
Sumaira Anjuma and
Christophe Hanob
aDepartment of Biotechnology, Quaid-i-Azam University, Islamabad-45320, Pakistan. E-mail: bhabbasi@qau.edu.pk; Fax: +92-51-90644121; Tel: +92-51-90644121
bLaboratoire de Biologie des Ligneux et des Grandes Cultures (LBLGC), Université d’Orléans, UPRES EA 1207, Chartres, France
First published on 10th March 2017
Abstract
The use of plants and plant-derived materials for biosynthesis of zinc oxide nanoparticles (ZnO NPs) is developing into a lucrative field of green nanotechnology and gaining more importance owing to its simplicity, rapidity, and eco-friendliness. In present study, a novel and efficient green approach has been developed for biosynthesis of ZnO NPs by exploiting the in vitro platform of plants. Two different in vitro cultures extracts i.e.; callus extract (CE) and adventitious root extract (RE) of Flax were used as a source of reducing and stabilizing agents. Phytochemical analysis revealed that the RE was rich in phytochemical reducing agents as compared to CE. UV-visible spectroscopy showed that the bioreduction of RE-mediated ZnO NPs completed in shorter time than CE-mediated ZnO NPs. Scanning electron microscopy showed that CE-mediated ZnO NPs were spherical with weak agglomeration but the RE-mediated ZnO NPs were hexagonal in shape with uniform distribution of particles. X-ray diffraction analysis showed that the both type of ZnO NPs exhibited the same crystalline nature (wurtzite hexagonal) but vary in their sizes. RE-mediated ZnO NPs were smaller in size (34.97 nm) than CE-mediated ZnO NPs (61.44 nm). Fourier-transform infrared spectroscopy revealed that the polyphenols (lignans), carboxylic acids and aromatic compounds were mainly involved in reduction and capping of both type of ZnO NPs. Moreover, the RE-mediated ZnO NPs showed more potent antibacterial and antileishmanial activity against multidrug resistant bacterial strains and parasite of Leishmania major than CE-mediated ZnO NPs. The present work highlighted the potent role of in vitro cultures of Flax in enhanced biosynthesis, antibacterial and antileishmanial activities of ZnO NPs.
1. Introduction
Nanotechnology is an emerging area of modern research, which revolutionizes all the fields of science by synthesizing new materials at the nanoscale level. These nanoscale materials are called a “wonder of modern medicine”.1,2 Among different nano-materials, the synthesis of metal oxide nanoparticles is one of the most dynamic areas of research in the field of modern material sciences. Due to the unique physico-chemical properties of nanoparticles, their applications are growing rapidly in various fields such as electronics, catalysis, optics, drug delivery, tissue engineering, gene delivery, environmental, food industry, space industry, and antimicrobial.3–6Due to the outbreak of infectious diseases and the development of antibiotic-resistant strains, scientists are searching for new antimicrobial agents. Among different infectious diseases, Leishmaniasis is a serious public health problem and is currently endemic in 98 countries all over the world.7 Currently, the drugs used in the treatment of Leishmaniasis have several disadvantages such as expensiveness, drug-resistant and toxicity to human cells.8,9 To overcome these issues, there is an urgent need to search for new antileishmanial agents that can effectively kill the parasites causing Leishmaniasis. In the present scenario, zinc oxide nanoparticles (ZnO NPs) have emerged up as novel antimicrobial and antileishmanial agents owing to their high surface area to volume ratio, enhanced optical properties and ability to generate reactive oxygen species (ROS) inside the microbial cells.10,11 ZnO NPs have also found marvelous application in biosensors, solar cells, semiconductors, agriculture, cosmetics, drug delivery, diagnostics and bio-imaging probes.12–14 In spite of these merits, ZnO NPs are also bio-safe and biocompatible with unique structural, electrical and thermal properties, which could be varied with respect to particle size, shape, morphology, and orientation.15,16
For synthesis of ZnO NPs, numerous physical and chemical approaches have been reported previously.17–19 Most of these approaches are environmentally un-friendly, generate hazardous wastes and require high vacuum, expensive chemicals, sophisticated equipment, high energy source, and laborious experimental conditions.19 To mitigate the above stated problems, there is an urgent need of a new simple and eco-friendly green synthesis process. Among different green synthesis approaches, the use of plant extracts is one of the most implemented method of green, eco-friendly fabrication of nanoparticles and also has a distinctive advantage that the plants are extensively distributed, easily accessible and less bio-hazardous.2,16 Moreover, the nanoparticles produced by plants are more stable and more varied in shape and size in comparison with those produced by other organisms.16,20 Plant extracts are natural reservoirs of several phytochemicals which help in the bioreduction and capping of the synthesized nanoparticles.21,22 Nature of plant extracts affect the morphology and physico-chemical properties of the synthesized nanoparticles, because they differ in their bioreduction capacity owning to their different levels of phytochemicals.20,23
Linum usitatissimum L. (Flax), is one of the oldest and highly cultivated oilseed crop in Europe and is regarded as a functional food due to presence of high quality omega-3 fatty acids (α-linolenic acid), proteins, lignin, phenolic acids, and dietary fibers, etc.24,25 Flax seeds are used in various medicine due to the presence of biologically active components (lignans), which exhibit both phytoestrogenic and antioxidant properties.26 Secoisolariciresinol diglucoside (SDG), matairesinol (MAT), secoisolariciresinol (SECO) and lariciresinol diglucoside (LDG) are the main lignans present in this plant species. These lignans help in the prevention and treatment of various types of cancers especially the breast, prostate and colon cancers.27,28 Besides lignans, Flax is also a good source of neolignans (dehydrodiconiferyl alcohol glucoside, DCG; and guaiacylglycerol-β-coniferyl alcohol ether glucoside, GGCG), which are used as principal agents in antifungal and antiinflammatory medicines.29 Flax is a rich source of lignans and neolignans which can act as reducing agents as well capping agents in synthesis of ZnO NPs. Previously, the use of extracts of various wild grown plants such as Calotropis procera, Ocimum basilicum L., Parthenium hysterophorus L., Citrus aurantifolia, Plectranthus amboinicus and Trifolium pratense have been reported for the green synthesis of ZnO NPs.30–35 But, unfortunately no report is available on the role of in vitro-derived cultures of plants in synthesis of ZnO NPs.
Plant in vitro cultures can offer an alternative platform for enhanced production of biochemical reducing agents, which are either difficult to extract from field grown plants or their production is limited by various environmental factors.36,37 Manipulation of in vitro cultures of plants in green synthesis of nanoparticles can speed up the reduction process of metallic ions by improving the phytochemical reducing potential of extracts.38 Both differentiated (adventitious root and cell suspension) and non-differentiated (callus) in vitro cultures can be used as a source of reducing and capping agents for synthesis of nanoparticles. These in vitro cultures vary in their bioreduction potential owing to their different levels of biochemical reducing agents. Among different in vitro cultures, adventitious root culture can serve as a promising source for stable and enhanced production of biochemical reducing agents.39 Moreover, adventitious root cultures are easy to maintain and have high proliferation rates than other cultures.40 In present study, we reported a novel, safe and rapid method for the biosynthesis of ZnO NPs. The main objective of this study was to explore the potential role of in vitro cultures of Flax in synthesis, antibacterial and antileishmanial properties of ZnO NPs. For this purpose, two different types of in vitro culture have been used for synthesis of ZnO NPs i.e.; callus extract (CE) and adventitious root extract (RE). Biosynthesized ZnO NPs were further characterized by different techniques and were evaluated for their potential antibacterial and antileishmanial effects. Furthermore, we have also demonstrated a captivating approach to vibrantly understand the mechanisms involved in the synthesis and antimicrobial activity of ZnO NPs. To the best of our knowledge, this is the first study that utilizes the in vitro-derived cultures of Flax for the biosynthesis of ZnO NPs.
2. Materials and methods
2.1. Plant material and establishment of callus culture
Flax seeds (brown variety) were collected from natural habitat of District Swat, Pakistan. Seeds were surface sterilized and inoculated on Murashige and Skoog basal medium (MS0)41 according to the method of Anjum and Abbasi.42 For establishment of callus culture, root (∼1 to 2 cm) explants were collected from 30 days old in vitro plantlets of Flax and cultured on MS media containing sucrose (30 g l−1), agar (8 g l−1) and various concentration (0.5–3.0 mg l−1) of α-naphthalene acetic acid (NAA), indole butyric acid (IBA), indole acetic acid (IAA), and 2,4-dichlorophenoxyacetic acid (2,4-D). MS medium without any plant growth regulators (PGRs) was used as control. The pH of all media was adjusted to 5.6 ± 0.2 prior to autoclaving (121 °C for 20 min). These cultures were maintained at 25 ± 2 °C for 16/8 h (light/dark) photoperiod in growth chamber. For each concentration of PGRs used, experiment was performed in triplicate culture flasks and whole of the experiment was repeated twice. Calli were harvested from the culture media after 4 weeks of culture and investigated for their biomass accumulation and photochemical analysis. Data regarding these parameters of calli (data not shown) revealed that, the callus obtained in response to 1.0 mg l−1 NAA treatment showed highest accumulation of biomass and phytochemicals. On the basis of these parameters, callus induced in response to 1.0 mg l−1 NAA was selected for biosynthesis of ZnO NPs.2.2. Establishment of adventitious root culture
For establishment of adventitious root culture, root (∼2 to 3 cm) explants were transferred into MS liquid media containing 30 g l−1 of sucrose and various concentrations (0.5–3.0 mg l−1) of IAA, IBA, and NAA. These cultures were maintained in flasks (100 ml) with 40 ml of culture medium on a rotary shaker at 100 rpm, at 25 ± 2 °C in darkness. MS0 without any PGRs was used as a control. For each concentration of PGRs used, experiment was performed in triplicate culture flasks and whole of the experiment was repeated twice. Adventitious roots formed in response to different concentrations of PGRs, were harvested from the liquid culture media after 6 weeks of culture and investigated for their biomass accumulation and photochemical analysis. Data regarding these parameters of adventitious roots (data not shown) revealed that, the roots obtained in response to 0.5 mg l−1 NAA treatment showed highest accumulation of biomass and phytochemicals. On the basis of these parameters, roots formed in response to 0.5 mg l−1 NAA were selected for biosynthesis of ZnO NPs.2.3. Extracts preparation
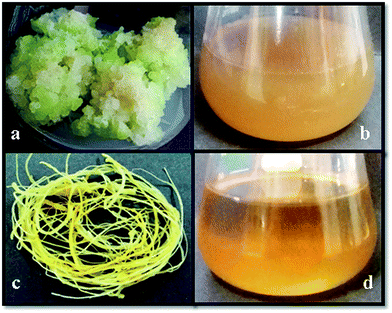
For callus extract (CE) and root extract (RE) preparation, 10 g of freshly harvested callus and roots were separately mixed with 100 ml of distilled water and boiled for 10 min in a 500 ml flask. This process was repeated thrice with an interval of 30 min and resulted mixtures were placed in an incubator for 24 h at 40 °C. After that, these mixtures were allowed to cool down at room temperature and filtered twice through a filter paper. The volume of the filtrates were adjusted to 100 ml with distilled water (Fig. 1) and stored at 4 °C for further use.2.4. Phytochemical analysis
Total phenolic content (TPC) TPC was determined by using Folin–Ciocalteu (FC) reagent according to the method reported by Velioglu et al.43 Briefly, 20 μl of the extracted sample (callus and root) was mixed with 90 μl of the FC reagent (10× diluted with distilled water) and incubated for 5 min at room temperature (25 ± 2 °C). After incubation, 90 μl of sodium carbonate (6%, w/v) was added to above mixture and absorbance was measured at 725 nm by using UV-Visible spectrophotometer (Shimadzu-1650; Japan). Gallic acid (0–50 μg ml−1) was used as standard for plotting calibration curve (R2 = 0.967) and the TPC was expressed as gallic acid equivalents (GAE) per g of DW.Total flavonoid content (TFC) was determined by using aluminum chloride (AlCl3) colorimetric method reported by Cheng et al.44 Briefly, 20 μl of the extracted sample (callus and root) was mixed with 10 μl of potassium acetate (1 M) and 10 μl of AlCl3 (10%, w/v). This mixture was incubated for 30 min at room temperature (25 ± 2 °C) after addition of 160 μl of distilled water. Absorbance of the reaction mixture was measured at 415 nm by using UV-Visible spectrophotometer (Shimadzu-1650; Japan). Quercetin (0–50 μg ml−1) was used as standard for plotting calibration curve (R2 = 0.988) and the TFC was expressed as quercetin equivalents (QE) per g of DW.
Lignans (SDG and LDG) and neolignans (DCG and GGCG) extraction procedure was based on the method derived from Corbin et al.45 Briefly, 500 mg of lyophilized cells were extracted with 20 ml of 80% (v/v) of aqueous methanol using ultrasound for 60 min at a temperature of 25 °C and an ultrasound frequency of 30 kHz. Ultrasonication was carried out using an ultrasonic bath USC1200TH (Prolabo; inner dimension: 300 mm × 240 mm × 200 mm) with an electrical power of 400 W (i.e. acoustic power of 1 W cm−2), maximal heating power of 400 W and variable frequencies, equipped with a digital timer, a frequency and a temperature controller. Following centrifugation, the solid residue was discarded and the supernatant was subsequently evaporated to dryness at 40 °C and then resuspended in 1 ml of 0.1 M citrate-phosphate pH 4.8 buffer containing 5 unit per ml of β-glucosidase from almonds (Sigma) for aglycones release during 4 h at 40 °C. The extract was then centrifuged and the supernatant was filtered (0.45 μm) before injection. Lignans and neolignans aglycones were quantified by RP-HPLC using a Varian liquid chromatographic system including Varian Prostar 230 pump, Metachem Degasit, Varian Prostar 410 autosampler and Varian Prostar 335 Photodiode Array Detector (PAD) and controlled by Galaxie version 1.9.3.2 software. The separation was performed at 35 °C on a Purospher (Merck) RP-18 column (250 × 4.0 mm i.d.; 5 μm) and the separation conditions described by Renouard et al.46 The same extract was also analysis without enzymatic treatment appreciate the relative proportion of aglycones vs. glycosides.
2.5. CE and RE-mediated biosynthesis of ZnO NPs
For biosynthesis of ZnO NPs, zinc nitrate hexahydrate (Sigma-Aldrich) was used as a precursor of zinc ions (Zn2+). Synthesis of ZnO NPs was carried out by following the protocol reported by Sangeetha et al.16 with little modifications. Briefly, 50 ml of aqueous CE and RE of Flax were mixed separately with 50 ml of 0.1 M zinc nitrate solution (SNS) under constant stirring using magnetic stirrer. After complete dissolution of the mixtures, solutions were kept under vigorous stirring at 60 °C for 3 h. The dirty yellow precipitates formed in reaction mixtures were allowed to settle down at room temperature for 24 h. Resulting supernatants were discarded and the remaining crude precipitates were centrifuged at 6000 rpm for 15 min. Again supernatants were discarded and the pellets formed were resuspended in distilled water followed by centrifugation at 6000 rpm for 10 min. This process of washing with distilled water was repeated thrice and the resulting pellets were oven dried at 80 °C for 6 h. Dried pellets were separately crushed into fine powder and stored for further analysis.2.6. Characterization of ZnO NPs
Optical properties of CE and RE-mediated ZnO NPs were characterized by using UV-visible spectroscopy. Biosynthesis of ZnO NPs was monitored as a function of time during the course of reaction with an interval of 30 min. UV-vis spectra of the reaction mixtures were recorded on a HALO DB-20 spectrophotometer in the wavelength range of 230–800 nm. Whereas, the stability of ZnO NPs was monitored by re-suspending 5 mg of each type of biosynthesized-ZnO NPs (fine powder) separately in 5 ml of distilled water. These aqueous suspensions were sonicated at room temperature (30 min) for uniform dispersion of ZnO NPs. In order to evaluate the stability, UV-vis spectra of respective samples were recorded with an interval of one month for a time period of four months.The crystalline nature of synthesized ZnO NPs were investigated by X-rays diffraction (XRD) analysis. Briefly, ZnO NPs were coated on XRD grid and the measurements were performed in the scanning mode by using X-ray diffractometer (Shimadzu-Model, XRD-6000), operated at 40 kV with a current of 30 mA, and Cu/kα radiation in the range of 20–80° in 2θ angles. The average particle size of the CE and RE-mediated ZnO NPs were calculated by using the Debye–Scherrer equation.47
D = kλ/β![[thin space (1/6-em)]](https://www.rsc.org/images/entities/char_2009.gif) cos cos![[thin space (1/6-em)]](https://www.rsc.org/images/entities/char_2009.gif) θ θ |
To find out the possible functional groups involved in the reduction and capping of ZnO NPs, reflectance spectra were recorded on Fourier transform infrared (FTIR) spectrophotometer (Bruker V70) working under a dehydrated airflow in reflectivity mode, attached with an attenuated total reflectance (ATR) accessory containing a gold crystal. Powder samples without any prior preparation were put simply on gold crystal and measurements were performed for wavenumber situated in the middle of the infrared range (600–4500 cm−1). Instrument resolution was about 4 cm−1 and measurements were average over 64 scans.
The morphology of ZnO NPs were observed by scanning electron microscope (SEM) by using the SIGMA model (MIRA3 TESCAN) operated at an accelerating voltage of 10 kV. The samples were prepared on a carbon coated copper grid by simply dropping a very small amount finely dispersed ZnO NPs on the grid. The film was then allowed to dry under a mercury lamp for 10 min and SEM images were collected at different magnifications. For elemental analysis, energy dispersive X-rays (EDX) analysis was performed by using EDX-detector attached with SEM.
2.7. Antibacterial activities of ZnO NPs
Antibacterial activities of ZnO NPs were evaluated against three multiple drug resistant bacterial strains i.e.; S. aureus (ATCC-6538), E. coli (ATCC-15224), and K. pneumonia (ATCC-4619). These bacterial strains were obtained from the American Type Culture Collection (ATCC), University Boulevard Manassas, USA. The in vitro antibacterial activity was carried out with CE and RE-mediated ZnO NPs by well diffusion method. Briefly, each type of synthesized ZnO NPs were weighed (10 μg ml−1) and dissolved in sterile distilled water, sonicated for 15 min and used immediately. The inoculums of bacterial strains were prepared by growing a single colony for overnight in nutrient broth. The nutrient agar plates were swabbed with bacterial strains broth, and 20 μl of each synthesized-ZnO NPs (10 μg ml−1), 0.1 M ZNS (positive control), Amoxicillin as standard antibiotic (10 μg ml−1), and aqueous CE and RE (negative controls) were added in wells. The plates were incubated at 37 °C for 24 h in an incubator and the zone of inhibition (mm) was measured. Data were collected from three independent experiments for each strain and repeated twice.2.8. Antileishmanial activities of ZnO NPs
In vitro antileishmanial activities of both type of synthesized ZnO NPs were evaluated against the promastigote forms of Leishmania major (MRHO/IR/76/ER) by using MTT [3-(4,5-dimethylthiazol-2-yl)-2,5-diphenyl-2H-tetrazolium bromide] assay (Sigma Chemical Co., St. Louis, Mo.). Leishmania major promastigotes were cultured in the RPMI 1640 medium supplemented with 10% fetal bovine serum (FBS), 292 μg ml−1 L-glutamine and 4.5 mg ml−1 glucose (Sigma) at 25 °C. The parasites were maintained in vitro by sub-passaging them every fifth day. Logarithmic phase Leishmania major promastigotes (1 × 10⁵ parasites per ml) were seeded in 96-well flat-bottom plates. Then, 50 μl of each concentration of ZnO NPs (25–250 μg ml−1) solutions prepared in PBS were added to triplicate wells and plates were incubated for 24 hours at 25 °C. Control wells contained 100 μl of RPMI 1640 media only. At the end of incubation, 10 μl of MTT was added to each well and plates were further incubated for 3 hours at 25 °C. Enzyme reaction was then stopped by the addition of 100 μl of dimethyl sulfoxide (DMSO). The plates were incubated for an additional 30 min under agitation at room temperature. Relative optical density (OD) of the purple color due to formation of formazan was then measured at a wavelength of 540 nm. The 50% inhibitory concentrations (IC50) were determined by linear regression curve analysis.2.9. Statistical analysis
All experiments were conducted in a synchronized manner and all experimental data was analyzed by Pareto analysis of variance (ANOVA). Duncan's multiple range test (DMRT, Windows version 7.5.1, SPSS Inc., Chicago) was used to determine the significance at P < 0.05.483. Results and discussion
3.1. Phytochemical analysis
Flax is known to be a rich source of biologically active secondary metabolites such as polyphenols, flavonoids, lignans and neolignans.24,25 These bioactive compounds have been reported to exhibit strong antioxidant properties.26,27 Therefore, due to presence of these antioxidant-phytochemicals, Flax can serve as a potential source of reduction and stabilization during biosynthesis of ZnO NPs. Phytochemical analysis of in vitro cultures (CE and RE) of Flax showed significant variations in accumulation of TPC, TFC, lignans and neolignans (Table 1). In case of flavonoid production, CE accumulated higher levels of TFC (2.622 mg g−1) than RE (1.162 mg g−1) of Flax. However, RE was found to be more efficient in accumulation of TPC (9.913 mg g−1), SDG (5.503 mg g−1), LDG (11.902 mg g−1), DCG (21.603 mg g−1), and GGCG (4.901 mg g−1) than CE of Flax (Table 1). Similar results were reported by Gabr et al.,49 in which root culture showed higher production of phenolic and lignans than callus culture of Flax. Many other workers also reported that the root cultures of different plant species were more potent in production of antioxidant-phytochemicals than their respective callus cultures.39,50 These variations in the accumulation of phytochemicals in CE and RE of Flax might be due to difference in differentiated (root culture) and non-differentiated tissues (callus culture) or due to difference in culturing conditions (liquid/solid media).36,49 Differentiated tissues functionally transport oxygen and nutrients across the interior of the liquid media, and are closely related to secondary metabolism since certain level of differentiation is required for production and storage of certain types of secondary metabolites.39,40| Phytochemicals (mg g−1 DW) | Callus extract (mean ± SD) | Root extract (mean ± SD) |
|---|---|---|
| a Values (mean ± SD) indicate the replicates of three experiments. Abbreviations: TPC, total phenolic content; TFC, total flavonoid content; SDG, secoisolariciresinol diglucoside; LDG, lariciresinol diglucoside; DGC, dehydrodiconiferyl alcohol glucoside; GGCG, guaiacylglycerol-β-coniferyl alcohol ether glucoside; SD, standard deviation. | ||
| TPC | 5.502 ± 0.061 | 9.913 ± 0.102 |
| TFC | 2.622 ± 0.011 | 1.162 ± 0.003 |
| SDG | 2.201 ± 0.010 | 5.503 ± 0.072 |
| LDG | 7.502 ± 0.082 | 11.902 ± 0.872 |
| DGC | 4.505 ± 0.022 | 21.603 ± 2.032 |
| GGCG | 1.606 ± 0.001 | 4.9010 ± 0.053 |
3.2. Biosynthesis and stability of CE and RE-mediated ZnO NPs monitored by UV-Vis spectroscopy
The formation of ZnO NPs could be observed visually by monitoring the color change of reaction mixture from colorless to pale yellow during the course of reaction. Color of both reaction mixtures (CE + ZNS and RE + ZNS) changes from colorless to pale yellow within 1 h, which is lesser as compared to many other previous reports.12,51 Biosynthesis of ZnO NPs was confirmed by recording UV-Vis spectra in the range of 230–800 nm wavelength. Due to surface plasmon resonance (SPR) properties, both types of synthesized ZnO NPs showed strong absorption peaks in the range of 345 to 352 nm (Fig. 2a). However, higher absorbance with comparatively narrow peak was observed in case of RE-mediated ZnO NPs. This might be due to smaller size and higher yield of RE-mediated ZnO NPs.38,52 In agreement with our results, similar UV absorption peaks of biosynthesized ZnO NPs have been reported previously.16,53 Generally, it is documented that the UV-Vis spectra could also be used to study the size and shape of nanoparticles in aqueous media.54 Absorbance of optical absorption peaks of nanoparticles generally decreases and shifted to longer wavelengths with increasing particle size.16 Moreover, the dielectric constant of the aqueous medium and the phytochemical adsorbed onto the surface of nanoparticles also take part in determination of spectral positions of plasmon absorption bands.55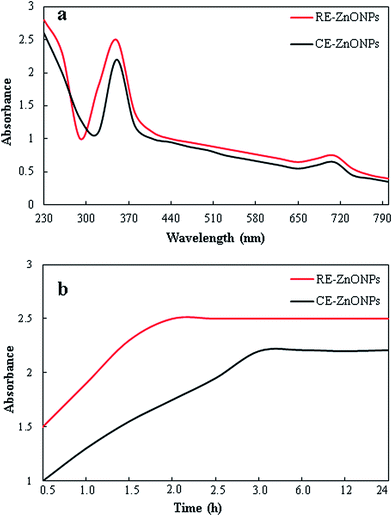 | ||
| Fig. 2 UV-vis spectra of CE and RE-mediated ZnO NPs. (a) Absorption peaks of CE and RE-mediated ZnO NPs after 4 h (b) biosynthesis profiles of CE and RE-mediated ZnO NPs as a function time. | ||
To find out the reaction completion time of biosynthesis of ZnO NPs, we investigated the absorbance intensities and wavelength peaks of both reaction mixtures at different time intervals (30 min to 24 h). In case of biosynthesis of CE-mediated ZnO NPs, an expansion of reaction time was accompanied with an obvious increase in the absorbance intensity before 3 h, but no significant enhancement in absorption was found after 3 h. Whereas, in case of RE-mediated ZnO NPs, reaction was completed within 2 h and no significant change in absorbance intensity was observed until 24 h (Fig. 2b). Results showed that the biosynthesis of RE-mediated ZnO NPs was completed in shorter time than CE-mediated ZnO NPs. This might be due to higher amount of phytochemicals (TPC, TFC, lignans and neolignans) in RE as compared to CE, which accelerate the reduction process of Zn2+ ions to Zn0. Nature and amount of phytochemicals present in plant extracts play crucial role in reduction and stabilization of nanoparticles.5,56 Similar results were reported by many other workers during biosynthesis of silver nanoparticles.38,57
The stability of the both types of biosynthesized ZnO NPs was observed by re-suspending the dry powder nanoparticles in distilled water and keeping them at room temperature for four months. UV-Vis spectra of respective ZnO NPs did not showed any significant change in absorption peak or wavelength, which confirmed the stability of biosynthesized ZnO NPs. This showed that the phytochemicals present in CE and RE of Flax not only act as reducing agents but also stabilized the biosynthesized ZnO NPs by preventing them from agglomeration. Similar results were also reported in biosynthesis of metallic nanoparticles.12,38
3.3. XRD analysis of CE and RE-mediated ZnO NPs
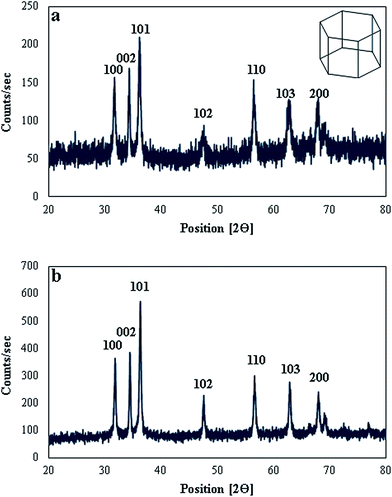
The crystalline nature and phase purity of both types of biosynthesized ZnO NPs was confirmed by XRD analysis. XRD diffractogram of CE-mediated ZnO NPs (Fig. 3a) showed characteristic peaks at 31.75°, 34.37°, 36.19°, 47.65°, 56.51°, 62.99°, and 67.93°, which can be attributed to 100, 002, 101, 102, 110, 103, and 200 reflection planes of hexagonal wurtzite structure of ZnO NPs (JCPDS 36-1451).58 Similarly, XRD diffractogram of RE-mediated ZnO NPs (Fig. 3b) showed diffraction peaks at 31.85°, 34.55°, 36.33°, 47.59°, 56.67°, 62.89°, and 68.03°, which are also in good agreement with 100, 002, 101, 102, 110, 103, and 200 reflection planes of hexagonal wurtzite structure of ZnO NPs. Previously, many studies also reported the hexagonal wurtzite structure of ZnO NPs.23,58 Strong intensity and narrow width of diffraction peaks of both types of synthesized ZnO NPs revealed that the resulting nanoparticles were highly crystalline in nature. Furthermore, diffraction peaks related to any impurity or secondary phase were not observed, indicating the superiority of proposed biosynthesis method over others for production of highly pure ZnO NPs.Average crystallite size of both types of synthesized ZnO NPs was calculated by using the Debye–Scherrer equation.47 The average size was found to be 34.97 nm in case of RE-mediated ZnO NPs, while 61.44 nm in case of CE-mediated ZnO NPs. These results clearly showed that both types of biosynthesized ZnO NPs display the same crystalline structure (hexagonal) but vary in their sizes. RE-mediated ZnO NPs are smaller in size and therefore, thought to be more powerful in their antimicrobial action than CE-mediated ZnO NPs. It is generally recognized that the smaller size of nanoparticles make their penetration more easily into the microbial cells than larger size nanoparticles.59
3.4. FTIR analysis of CE and RE-mediated ZnO NPs
FTIR analysis was carried out to characterize and identify the possible interfacial phytochemicals involved in the bioreduction and capping of CE and RE-mediated ZnO NPs. FTIR spectra of CE and RE displayed a large number of peaks which reflect the complex nature of phytochemicals present in these extracts (Fig. 4). CE showed intense absorption peaks at about 811.99, 939.28, 1337.67, 1477.97, 1481.26, 1636.56, 1687.63, and 3186.25 cm−1 which correspond to the bond stretching of –OH (carboxylic acid), –N![[double bond, length as m-dash]](https://www.rsc.org/images/entities/char_e001.gif) O (nitro group), –C–C (aromatic ring), –N–H (amine), –C
O (nitro group), –C–C (aromatic ring), –N–H (amine), –C![[double bond, length as m-dash]](https://www.rsc.org/images/entities/char_e001.gif) O (carbonyl group) and –O–H (phenol), respectively. Whereas, the CE-mediated ZnO NPs showed absorption peaks at about 896.85, 993.29, 1338.53, 1633.63, 1766.71, 2933.59, and 3276.9 cm−1 which correspond to the involvement of carboxylic acid, nitro group, aromatic compounds, esters, carbonyl groups and phenols (Fig. 4a).12,16 FTIR spectra of both CE and CE-mediated ZnO NPs showed almost similar absorption peaks, but the intensity of peaks in the region of 900–1600 cm−1 was greater in CE than ZnO NPs, suggesting the possible consumption of carboxylic, nitro and phenolic groups in the reduction and capping of CE-mediated ZnO NPs.
O (carbonyl group) and –O–H (phenol), respectively. Whereas, the CE-mediated ZnO NPs showed absorption peaks at about 896.85, 993.29, 1338.53, 1633.63, 1766.71, 2933.59, and 3276.9 cm−1 which correspond to the involvement of carboxylic acid, nitro group, aromatic compounds, esters, carbonyl groups and phenols (Fig. 4a).12,16 FTIR spectra of both CE and CE-mediated ZnO NPs showed almost similar absorption peaks, but the intensity of peaks in the region of 900–1600 cm−1 was greater in CE than ZnO NPs, suggesting the possible consumption of carboxylic, nitro and phenolic groups in the reduction and capping of CE-mediated ZnO NPs.
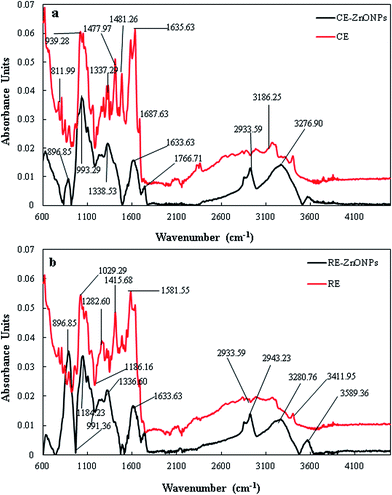 | ||
| Fig. 4 FTIR spectra of extracts and ZnO NPs. (a) CE and CE-mediated ZnO NPs (b) RE and RE-mediated ZnO NPs. | ||
FTIR spectrum of RE showed strong absorption peaks at 811.99, 1029.93, 1186.16, 1282.60, 1415.68, 1581.55, 1943.23, and 3411.91 cm−1 which correspond to the vibrational bond stretching of –C–Cl (alkyl halide), –C![[double bond, length as m-dash]](https://www.rsc.org/images/entities/char_e001.gif) C– (alkenes), –C–N– (aliphatic amine), –N
C– (alkenes), –C–N– (aliphatic amine), –N![[double bond, length as m-dash]](https://www.rsc.org/images/entities/char_e001.gif) O (nitro group) –C–H (aromatic group), and –O–H (phenol).56,58 Whereas, the RE-mediated ZnO NPs showed absorption peaks at about 896.85, 991.36, 1184.23, 1336.60, 1633.63, 2933.59, 3280.70, and 3589.36 cm−1 which also correspond to the similar functional groups as stated in RE (Fig. 4b). However, the sharpness and intensity of peaks was lower in spectrum of RE-mediated ZnO NPs in comparison to RE. Interestingly, the 1282.60 (–OH) and 1415.68 (–C–H) cm−1 peaks present in RE spectrum were absent in RE-mediated ZnO NPs spectrum. So, we presume that the absence of these peaks may be attributed to the fact that the hydroxyl group (phenol) and aromatic rings are involved in the reduction of Zn2+ to Zn0. Our results are in good agreement with other reports available in the literature suggesting the possible involvement of above mentioned groups in bioreduction and capping of ZnO NPs.16,52,60 Moreover, the FTIR results also revealed that the both extracts (CE and RE) showed almost similar absorption peaks in the same region. However, RE showed some additional peaks in the region of 1000–1280 cm−1, suggesting the presence of some additional phytochemicals in RE than CE of Flax.
O (nitro group) –C–H (aromatic group), and –O–H (phenol).56,58 Whereas, the RE-mediated ZnO NPs showed absorption peaks at about 896.85, 991.36, 1184.23, 1336.60, 1633.63, 2933.59, 3280.70, and 3589.36 cm−1 which also correspond to the similar functional groups as stated in RE (Fig. 4b). However, the sharpness and intensity of peaks was lower in spectrum of RE-mediated ZnO NPs in comparison to RE. Interestingly, the 1282.60 (–OH) and 1415.68 (–C–H) cm−1 peaks present in RE spectrum were absent in RE-mediated ZnO NPs spectrum. So, we presume that the absence of these peaks may be attributed to the fact that the hydroxyl group (phenol) and aromatic rings are involved in the reduction of Zn2+ to Zn0. Our results are in good agreement with other reports available in the literature suggesting the possible involvement of above mentioned groups in bioreduction and capping of ZnO NPs.16,52,60 Moreover, the FTIR results also revealed that the both extracts (CE and RE) showed almost similar absorption peaks in the same region. However, RE showed some additional peaks in the region of 1000–1280 cm−1, suggesting the presence of some additional phytochemicals in RE than CE of Flax.
3.5. SEM and EDX analysis of CE and RE-mediated ZnO NPs
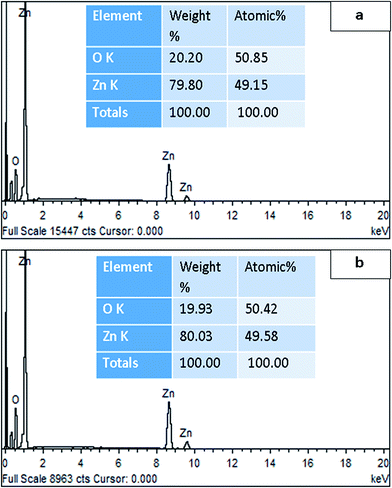
Morphology of both types of synthesized ZnO NPs was analyzed by SEM. CE-mediated ZnO NPs appeared nearly spherical in shape with weak agglomeration of particles (Fig. 5a). Whereas, the RE-mediated ZnO NPs appeared nearly hexagonal in shape with uniform distribution of particles (Fig. 5b). Similar to our results, different shapes of ZnO NPs have been reported previously, in which the spherical, rod, hexagonal and flower-like shapes were more common.2,60,61 Average particle size of ZnO NPs was calculated by Sigma Scan Pro software attached with SEM. CE-mediated ZnO NPs found to be in the range 29–37 nm while RE-mediated ZnO NPs in 52–66 nm. These results showed that the average particle size of both type of ZnO NPs determined by SEM was very close to the crystallite size calculated by XRD. Thus, the SEM results also endorsed the XRD results. Further, the elemental confirmation analysis of both types of synthesized ZnO NPs was carried out by EDX. EDX spectrum of CE-mediated ZnO NPs showed characteristic peaks of only zinc (79.80%) and oxygen (20.20%) elements (Fig. 6a). Similarly, EDX spectrum of RE-mediated ZnO NPs also showed the presence of only zinc (80.03%) and oxygen (19.93%) elements (Fig. 6b). These results are in agreement with previous reports.58,62 Absence of any extra peak in EDX spectra of both types of synthesized ZnO NPs, confirms the formation of pure ZnO NPs.63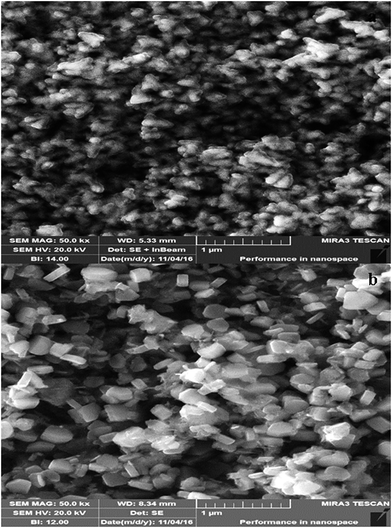 | ||
| Fig. 5 SEM images of ZnO NPs. (a) CE-mediated ZnO NPs (b) RE-mediated ZnO NPs at 1 μm magnification bar. | ||
3.6. Probable mechanism involved in biosynthesis of ZnO NPs
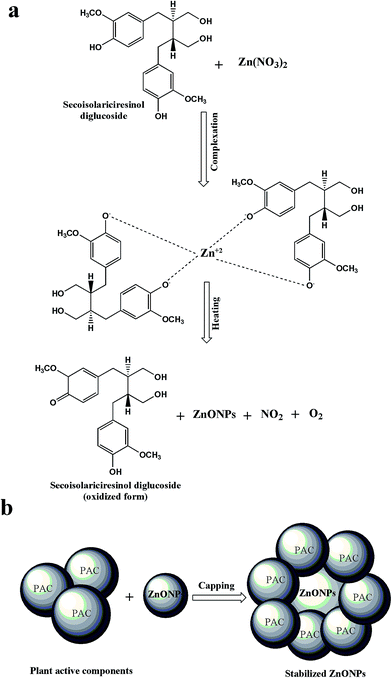
The possible mechanism involved in the biosynthesis of ZnO NPs by using plant extracts is not fully explored and yet under debate.62 However, many studies have reported the involvement of plant metabolites containing polar groups in reduction and stabilization of metal oxide nanoparticles.64,65 In present study, FTIR analysis of CE and RE-mediated ZnO NPs revealed that the polyphenols, aromatic and carbonyl compounds are mainly responsible for reduction and surface capping of ZnO NPs. Phytochemical analysis revealed that the in vitro extracts (CE and RE) of Flax are also rich in phenolic, flavonoids, lignans (polyphenolics) and neolignans which are also in agreement with FTIR results. We, therefore, hypothesize the mechanism of biosynthesis of ZnO NPs by using the main lignan, SDG, which represent over 95% of total lignans present in Flax seeds.26 It seems that the polar groups (OH) of SDG are involved in the reduction of Zn2+ to Zn0 ions. At first the lone pair electrons of the OH groups of SDG occupy empty orbitals of the Zn2+ ions and then result in complexation of Zn2+ by capping it with OH groups inside the nanoscopic templates of SDG. Lone pair electrons of OH groups of SDG result in reduction of Zn2+ ions and convert SDG molecule into its oxidized form. After this, heating of the reaction mixture resulted in biosynthesis of ZnO NPs along with the production of NO2 and O2 (Fig. 7a). Moreover, the other plant active compounds (PAC) present in the CE and RE capped and stabilized the synthesized ZnO NPs by making weak physical bonds with nanoparticles and prevent them from agglomeration (Fig. 7b). This proposed mechanism is in agreement with those reported earlier for biosynthesis of ZnO NPs by using polar groups of plant metabolites.64,663.7. Antibacterial activities of CE and RE-mediated ZnO NPs
Several studies have reported the non-toxicity and biocompatibility of ZnO NPs with human cells.67,68 This aspect of ZnO NPs make them most attractive and promising contenders against several microbes. In present study, antibacterial efficacy of both types of synthesized ZnO NPs was evaluated against E. coli, K. pneumoniae, and S. aureus by using well diffusion method. Results showed that the both types of synthesized ZnO NPs exhibited prominent bactericidal activity against all three bacterial strains as compared to CE, RE and ZNS (Fig. 8). However, both types of synthesized ZnO NPs displayed strong bactericidal results against S. aureus as compared to E. coli and K. pneumoniae (Table 2). This might be due to difference in thickness and composition of cell walls and cell membranes of Gram-positive (S. aureus) and Gram-negative (E. coli and K. pneumoniae) bacteria.69,70 Similar to our results, more potent antibacterial effects of ZnO NPs against Gram-positive bacteria as compared to Gram-negative bacteria have been reported previously.59,70 Furthermore, it is clearly evident from results that the RE-mediated ZnO NPs showed higher level of bactericidal activity than CE-mediated ZnO NPs against all three types of bacterial strains (Fig. 8, Table 2). This might be attributed to the differences in their shapes, sizes and surface capping agents. The size and shape of the nanoparticles plays an important role in their biomedical applications.71 Previous studies have also shown that the smaller the size of ZnO NPs, the greater the efficacy in inhibiting the growth of bacteria by producing more ROS.71–73 Therefore, The smaller sized hexagonal RE-mediated ZnO NPs (34.97 nm) showed enhanced bactericidal activity against all the tested bacterial strains as compared to the larger sized spherical CE-mediated ZnO NPs (61.44 nm).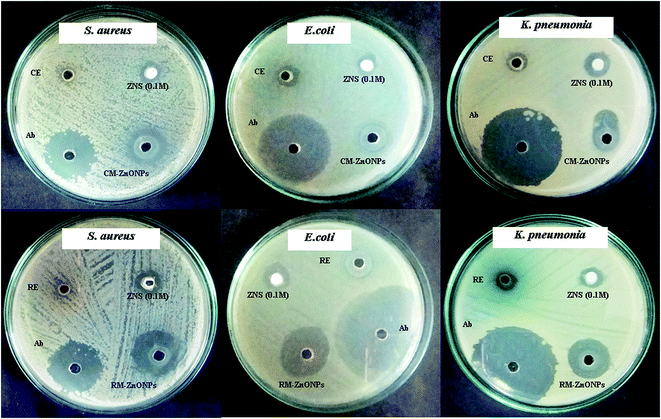 | ||
| Fig. 8 Antibacterial assays of CE and RE-mediated ZnO NPs. Zone of inhibition against multiple drug resistant bacterial strains was measured in mm. | ||
| Organism | Zone of inhibition (mm) (20 μl per well) | |||||
|---|---|---|---|---|---|---|
| 0.1 mM ZNS (mean ± SD) | Antibiotics (10 μg ml−1) (mean ± SD) | CE (10 μg ml−1) (mean ± SD) | RE (10 μg ml−1) (mean ± SD) | CE-mediated ZnONPs (10 μg ml−1) (mean ± SD) | RE-mediated ZnONPs (10 μg ml−1) (mean ± SD) | |
| a Values (mean ± SD) indicate the replicates of three experiments. Abbreviations: ZnONPs, zinc oxide nanoparticles; RE, root extract; CE, callus extract; ZNS, zinc nitrate solution; SD, standard deviation. | ||||||
| E. coli | 14.1 ± 1.01 | 45.2 ± 2.68 | 11.1 ± 0.42 | 15.2 ± 0.06 | 18.1 ± 1.33 | 30.2 ± 2.42 |
| K. pneumonia | 14.2 ± 1.10 | 39.3 ± 2.04 | 10.2 ± 0.72 | 15.3 ± 0.08 | 22.5 ± 1.82 | 26.3 ± 1.94 |
| S. aureus | 12.2 ± 0.98 | 26.2 ± 1.91 | 4.01 ± 0.11 | 2.41 ± 0.02 | 23.5 ± 1.42 | 28.1 ± 2.06 |
3.8. Probable mechanism involved in antibacterial action of ZnO NPs
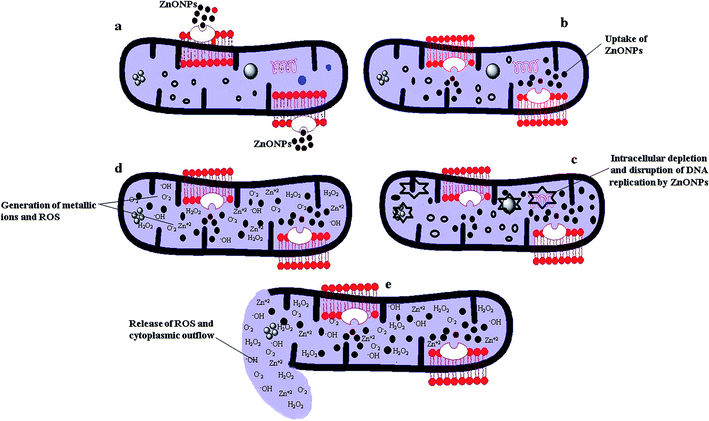
Various probable mechanisms regarding antibacterial action of ZnO NPs have been proposed previously in literature.74,75 However, the precise mechanism involved in antibacterial action of ZnO NPs is not fully elaborated and still contentious.10,68 Antibacterial action of ZnO NPs mainly depends on their size, shape, surface chemistry and distinct physicochemical properties.72,74,76 In present study, we proposed the probable mechanism involved in antibacterial action of biosynthesized ZnO NPs (Fig. 9). Due to their smaller size and electrostatic interaction with cell membrane of bacteria, ZnO NPs entered into the bacteria's cell. Once ZnO NPs have internalized bacterial cell, they start to interact with cellular organelles, causing intracellular depletion, and disruption of DNA replication by generating ROS (Fig. 9a–c). Excessive generation of metallic ions (Zn2+) and ROS, mostly the hydroxyl radicals (HO˙), singlet oxygen (O2˙), and hydrogen peroxide (H2O2) resulted in disruption and disorder of cell membrane. Consequently, the cell membrane damage leads to the cytoplasmic leakage and death of bacterial cells (Fig. 9d and e). Toxicity of ROS to bacteria is attributed to their high reactivity and oxidizing property.77 Similarly, several other studies have also reported the generation of ROS as the main mechanism responsible for antibacterial activity of ZnO NPs.10,68,763.9. Antileishmanial activities of CE and RE-mediated ZnO NPs
Due to the emergence of infectious diseases and antibiotic resistance in pathogenic microbes, the pharmaceutical industries and scientists are looking for new antimicrobial agents. In present scenario, ZnO NPs emerged as the most promising contenders not only in fighting against various microbes but also in tackling infectious diseases due to their unique broad-spectrum bioactivities.10,11 In present study, we evaluated the antileishmanial activity of biosynthesized CE and RE-mediated ZnO NPs against promastigote forms of Leishmania major. The leishmanicidal potency of different concentrations (25–250 μg ml−1) of both types of ZnO NPs was tested for 24 h and the data was expressed as percentage inhibition of parasites. Results showed that the metabolic activities of Leishmania major promastigotes exposed to ZnO NPs changed with the passage of time as compared to control group. Formation of purple colored formazan crystals during MIT assay is a sign of metabolic activity, indicating that parasites are alive and maintaining their metabolism.7 In control group, dark purple formazan crystals were visually observed. However, in case of ZnO NPs exposed-promastigotes, formazan crystals appeared in very small amount (light purple color), indicating that the ZnO NPs inhibited the metabolic activities of the majority of the parasites.Quantitatively, a dose-dependent effect of various concentrations of both types of ZnO NPs was observed. Higher concentration (250 μg ml−1) of both types of ZnO NPs showed highest percentage inhibition of parasites as compared to lower concentrations. However, 250 μg ml−1 of RE-mediated ZnO NPs showed 1.68-fold increase in inhibition (37%) of parasites as compared to CE-mediated ZnO NPs (22%) (Fig. 10). A dose-dependent increase in antileishmanial activity have also been reported previously in many studies.7,8 The IC50 value of RE-mediated ZnO NPs (266.89) was also 1.47-times less than that of CE-mediated ZnO NPs (393.62). Both the percentage inhibition and IC50 values revealed the strong leishmanicidal activity of RE-mediated ZnO NPs as compared to CE-mediated ZnO NPs. This might be due to the differences in their shapes, sizes and stabilizing agents, as described earlier in antibacterial activity. In agreement with our results, many studies have shown that the smaller the size of nanoparticles, the greater the efficacy in inhibiting the Leishmania parasites by producing more ROS.78,79 Different types of metal and metal oxide nanoparticles are reported to generate a high level of ROS, which promote the process of apoptosis.8,80,81 It is well known fact that the Leishmania parasite are highly sensitive to ROS and any drug/agent that could generate ROS would be a promising antileishmanial contender.82 ZnO NPs act as large reservoir of ROS (OH−, H2O2, O2−, etc) and free Zn2+ ions, which could lead to intracellular damaging of Leishmania parasites.
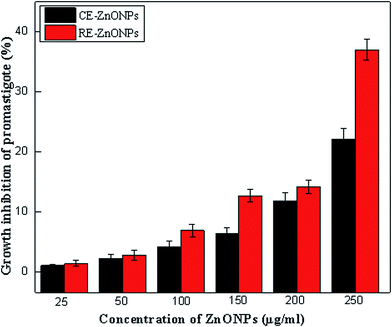 | ||
| Fig. 10 Antileshmanial activity of different concentration of CE and RE-mediated ZnO NPs calculated as percentage inhibition of parasites. | ||
4. Conclusions
Exploitation of in vitro cultures of Flax could serve as a novel and rich source of phytochemical reducing agents for enhanced biosynthesis of ZnO NPs. The UV-Vis spectroscopy, XRD, SEM, EDX, and FTIR analysis revealed that RE-mediated ZnO NPs proved to be more efficient than CE-mediated ZnO NPs not only in term of their physicals properties such as shape, size, crystallinity and distribution but also in antibacterial and antileishmanial activities. The difference in the physical properties and bio-potential assays of both type of synthesized ZnO NPs is attributed to the differential effects of in vitro cultures of Flax on accumulation of bioactive phytochemicals responsible for capping and stabilization of nanoparticles. These biologically synthesized ZnO NPs are free from toxic chemicals that are usually entangled on the surfaces of chemically synthesized nanoparticles and therefore safe to use in various biomedical and pharmaceutical industries.Ethical compliance
This study was approved by the research ethical committee of Department of Biotechnology, Quaid-i-Azam University Islamabad, Pakistan.Conflict of interest
The authors declare no conflict of interest.Abbreviations
| ZnO NPs | Zinc oxide nanoparticles |
| CE | Callus extract |
| RE | Root extract |
| ZNS | Zinc nitrate solution |
| MS | Murashige and Skoog medium |
| TPC | Total phenolic content |
| TFC | Total flavonoid content |
| SDG | Secoisolariciresinol diglucoside |
| LDG | Lariciresinol diglucoside |
| DCG | Dehydrodiconiferyl alcohol glucoside |
| GGCG | Guaiacylglycerol-β-coniferyl alcohol ether glucoside |
| DW | Dry weight |
| PGRs | Plant growth regulators |
| UV-vis | Ultra violet-visible |
| FTIR | Fourier-transform infrared |
| XRD | X-ray diffraction |
| SEM | Scanning electron microscopy |
| EDX | Energy dispersive X-rays |
| ATCC | American Type Culture Collection |
References
- S. Ahmed and S. Ikram, J. Photochem. Photobiol., B, 2016, 161, 141–153 CrossRef CAS PubMed
.
- M. Ramesh, M. Anbuvannan and G. Viruthagiri, Spectrochim. Acta, Part A, 2015, 136, 864–870 CrossRef CAS PubMed
.
- Z. Deng, M. Chen, G. Gu and L. Wu, J. Phys. Chem. B, 2008, 112, 16–22 CrossRef CAS PubMed
.
- J. Guo and C. Peng, Ceram. Int., 2015, 41, 2180–2186 CrossRef CAS
.
- H. Mirzaei and M. Darroudi, Ceram. Int., 2017, 43, 907–914 CrossRef CAS
.
- S. J. Yang and C. R. Park, Nanotechnology, 2007, 19, 035609 CrossRef PubMed
.
- A. M. Allahverdiyev, E. S. Abamor, M. Bagirova, S. Y. Baydar, S. C. Ates, F. Kaya, C. Kaya and M. Rafailovich, Exp. Parasitol., 2013, 135, 55–63 CrossRef CAS PubMed
.
- A. M. Allahverdiyev, E. S. Abamor, M. Bagirova, C. B. Ustundag, C. Kaya, F. Kaya and M. Rafailovich, Int. J. Nanomed., 2011, 6, 2705–2714 CrossRef CAS PubMed
.
- R. Reithinger and J.-C. Dujardin, J. Clin. Microbiol., 2007, 45, 21–25 CrossRef CAS PubMed
.
- R. Jalal, E. K. Goharshadi, M. Abareshi, M. Moosavi, A. Yousefi and P. Nancarrow, Mater. Chem. Phys., 2010, 121, 198–201 CrossRef CAS
.
- M. Rai, A. Yadav and A. Gade, Biotechnol. Adv., 2009, 27, 76–83 CrossRef CAS PubMed
.
- K. Elumalai, S. Velmurugan, S. Ravi, V. Kathiravan and S. Ashokkumar, Spectrochim. Acta, Part A, 2015, 143, 158–164 CrossRef CAS PubMed
.
- G. Nohynek, E. Dufour and M. Roberts, Skin Pharmacol. Physiol., 2008, 21, 136–149 CrossRef CAS PubMed
.
- G. J. Nohynek, J. Lademann, C. Ribaud and M. S. Roberts, Crit. Rev. Toxicol., 2007, 37, 251–277 CrossRef CAS PubMed
.
- A. Dakhlaoui, M. Jendoubi, L. S. Smiri, A. Kanaev and N. Jouini, J. Cryst. Growth, 2009, 311, 3989–3996 CrossRef CAS
.
- G. Sangeetha, S. Rajeshwari and R. Venckatesh, Mater. Res. Bull., 2011, 46, 2560–2566 CrossRef CAS
.
- S. Ameen, M. S. Akhtar and H. S. Shin, Mater. Lett., 2015, 155, 82–86 CrossRef CAS
.
- F. Thema, E. Manikandan, M. Dhlamini and M. Maaza, Mater. Lett., 2015, 161, 124–127 CrossRef CAS
.
- A. K. Zak, R. Razali, W. Majid and M. Darroudi, Int. J. Nanomed., 2011, 6, 1399–1403 Search PubMed
.
- S. Shamaila, A. K. L. Sajjad, S. A. Farooqi, N. Jabeen, S. Majeed and I. Farooq, Applied Materials Today, 2016, 5, 150–199 CrossRef
.
- S. P. Chandran, M. Chaudhary, R. Pasricha, A. Ahmad and M. Sastry, Biotechnol. Prog., 2006, 22, 577–583 CrossRef CAS PubMed
.
- L. Christensen, S. Vivekanandhan, M. Misra and A. K. Mohanty, Adv. Mater. Lett., 2011, 2, 429–434 CrossRef CAS
.
- D. Gnanasangeetha and D. SaralaThambavani, Res. J. Mater. Sci., 2013, 2320, 6055 Search PubMed
.
- T. J. Schmidt, M. Klaes and J. Sendker, Phytochemistry, 2012, 82, 89–99 CrossRef CAS PubMed
.
- H. Wang, J. Wang, C. Qiu, Y. Ye, X. Guo, G. Chen, T. Li, Y. Wang, X. Fu and R. H. Liu, Food Chem., 2017, 214, 227–233 CrossRef CAS PubMed
.
- J. Attoumbré, S. Charlet, S. Baltora-Rosset, C. Hano, S. Raynaud-Le Grandic, F. Gillet, L. Bensaddek, F. Mesnard and M.-A. Fliniaux, Plant Cell Rep., 2006, 25, 859–864 CrossRef PubMed
.
- C. Hano, M. Addi, L. Bensaddek, D. Crônier, S. Baltora-Rosset, J. Doussot, S. Maury, F. Mesnard, B. Chabbert and S. Hawkins, Planta, 2006, 223, 975–989 CrossRef CAS PubMed
.
- M. Szewczyk, S. Abarzua, A. Schlichting, B. Nebe, B. Piechulla, V. Briese and D.-U. Richter, J. Med. Plants Res., 2014, 8, 237–245 CrossRef CAS
.
- V. Beejmohun, O. Fliniaux, C. Hano, S. Pilard, E. Grand, D. Lesur, D. Cailleu, F. Lamblin, E. Lainé and J. Kovensky, Phytochemistry, 2007, 68, 2744–2752 CrossRef CAS PubMed
.
- R. Dobrucka and J. Długaszewska, Saudi J. Biol. Sci., 2016, 23, 517–523 CrossRef CAS PubMed
.
- P. Rajiv, S. Rajeshwari and R. Venckatesh, Spectrochim. Acta, Part A, 2013, 112, 384–387 CrossRef CAS PubMed
.
- H. A. Salam, R. Sivaraj and R. Venckatesh, Mater. Lett., 2014, 131, 16–18 CrossRef
.
- N. A. Samat and R. M. Nor, Ceram. Int., 2013, 39, S545–S548 CrossRef
.
- R. P. Singh, V. K. Shukla, R. S. Yadav, P. K. Sharma, P. K. Singh and A. C. Pandey, Adv. Mater. Lett., 2011, 2, 313–317 CrossRef CAS
.
- S. Vijayakumar, G. Vinoj, B. Malaikozhundan, S. Shanthi and B. Vaseeharan, Spectrochim. Acta, Part A, 2015, 137, 886–891 CrossRef CAS PubMed
.
- M. A. Khan, B. H. Abbasi, N. A. Shah, B. Yücesan and H. Ali, Plant Cell, Tissue Organ Cult., 2015, 123, 501–510 CrossRef
.
- R. V. Reis, A. P. P. L. Borges, T. P. C. Chierrito, E. R. de Souto, L. M. de Souza, M. Iacomini, A. J. B. de Oliveira and R. A. C. Gonçalves, Plant Cell, Tissue Organ Cult., 2011, 106, 329–335 CrossRef
.
- S. Anjum and B. H. Abbasi, Int. J. Nanomed., 2016, 11, 715 CrossRef CAS PubMed
.
- X.-H. Cui, D. Chakrabarty, E.-J. Lee and K.-Y. Paek, Bioresour. Technol., 2010, 101, 4708–4716 CrossRef CAS PubMed
.
- N. Praveen and H. Murthy, Acta Physiol. Plant., 2010, 32, 1017–1022 CrossRef CAS
.
- T. Murashige and F. Skoog, Physiol. Plant., 1962, 15, 473–497 CrossRef CAS
.
- S. Anjum and B. H. Abbasi, Int. J. Nanomed., 2016, 11, 1663 CAS
.
- Y. Velioglu, G. Mazza, L. Gao and B. Oomah, J. Agric. Food Chem., 1998, 46, 4113–4117 CrossRef CAS
.
- C.-C. Chang, M.-H. Yang, H.-M. Wen and J.-C. Chern, J. Food Drug Anal., 2002, 10, 178–182 CAS
.
- C. Corbin, T. Fidel, E. A. Leclerc, E. Barakzoy, N. Sagot, A. Falguiéres, S. Renouard, J.-P. Blondeau, C. Ferroud and J. Doussot, Ultrason. Sonochem., 2015, 26, 176–185 CrossRef CAS PubMed
.
- S. Renouard, C. Hano, C. Corbin, O. Fliniaux, T. Lopez, J. Montguillon, E. Barakzoy, F. Mesnard, F. Lamblin and E. Lainé, Food Chem., 2010, 122, 679–687 CrossRef CAS
.
- S. Arokiyaraj, M. V. Arasu, S. Vincent, N. U. Prakash, S. H. Choi, Y.-K. Oh, K. C. Choi and K. H. Kim, Int. J. Nanomed., 2014, 9, 379 CrossRef PubMed
.
- D. B. Duncan, Biometrics, 1955, 11, 1–42 CrossRef
.
- A. M. Gabr, H. B. Mabrok, K. Z. Ghanem, M. Blaut and I. Smetanska, Plant Cell, Tissue Organ Cult., 2016, 126, 255–267 CrossRef CAS
.
- M. Kikowska, B. Thiem, E. Sliwinska, M. Rewers, M. Kowalczyk, A. Stochmal and W. Oleszek, J. Plant Growth Regul., 2014, 33, 809–819 CrossRef CAS
.
- N. Bala, S. Saha, M. Chakraborty, M. Maiti, S. Das, R. Basu and P. Nandy, RSC Adv., 2015, 5, 4993–5003 RSC
.
- A. K. Jha and K. Prasad, Adv. Mater. Lett., 2014, 5, 501–505 CrossRef CAS
.
- F. Fan, Y. Feng, P. Tang and D. Li, Mater. Lett., 2015, 158, 290–294 CrossRef CAS
.
- W. Raut Rajesh, R. Lakkakula Jaya, S. Kolekar Niranjan, D. Mendhulkar Vijay and B. Kashid Sahebrao, Curr. Nanosci., 2009, 5, 117–122 CrossRef
.
- S. Smitha, K. Nissamudeen, D. Philip and K. Gopchandran, Spectrochim. Acta, Part A, 2008, 71, 186–190 CrossRef CAS PubMed
.
- P. Jamdagni, P. Khatri and J. Rana, J. King Saud Univ., Sci., 2016 DOI:10.1016/j.jksus.2016.10.002
.
- S. Sheshadri, S. Sriram, P. Balamurugan, R. Anupriya, S. A. Princy, P. Brindha and S. Bindu, RSC Adv., 2015, 5, 47548–47554 RSC
.
- L. Fu and Z. Fu, Ceram. Int., 2015, 41, 2492–2496 CrossRef CAS
.
- A. Sirelkhatim, S. Mahmud, A. Seeni, N. H. M. Kaus, L. C. Ann, S. K. M. Bakhori, H. Hasan and D. Mohamad, Nano-Micro Lett., 2015, 7, 219–242 CrossRef CAS
.
- B. Banumathi, B. Malaikozhundan and B. Vaseeharan, Vet. Parasitol., 2016, 216, 93–100 CrossRef CAS PubMed
.
- M. F. Khan, M. Hameedullah, A. H. Ansari, E. Ahmad, M. Lohani, R. H. Khan, M. M. Alam, W. Khan, F. M. Husain and I. Ahmad, Int. J. Nanomed., 2014, 9, 853 CrossRef CAS PubMed
.
- N. J. Sushma, B. Mahitha, K. Mallikarjuna and B. D. P. Raju, Appl. Phys. A: Mater. Sci. Process., 2016, 122, 1–10 CrossRef CAS
.
- K. Vimala, S. Sundarraj, M. Paulpandi, S. Vengatesan and S. Kannan, Process Biochem., 2014, 49, 160–172 CrossRef CAS
.
- F. Buazar, M. Bavi, F. Kroushawi, M. Halvani, A. Khaledi-Nasab and S. Hossieni, J. Exp. Nanosci., 2016, 11, 175–184 CrossRef CAS
.
- S. Ghayempour and M. Montazer, Ultrason. Sonochem., 2017, 34, 458–465 CrossRef CAS PubMed
.
- S. Jafarirad, M. Mehrabi, B. Divband and M. Kosari-Nasab, Mater. Sci. Eng., Proc. Conf., 2016, 59, 296–302 CrossRef CAS PubMed
.
- G. Colon, B. C. Ward and T. J. Webster, J. Biomed. Mater. Res., Part A, 2006, 78, 595–604 CrossRef PubMed
.
- N. Padmavathy and R. Vijayaraghavan, Sci. Technol. Adv. Mater., 2008, 9, 035004 CrossRef PubMed
.
- Y. Bibi, S. Nisa, F. M. Chaudhary and M. Zia, BMC Complementary Altern. Med., 2011, 11, 52 CrossRef PubMed
.
- A. Azam, A. Ahmed, M. Oves, M. Khan, S. Habib and A. Memic, Int. J. Nanomed., 2012, 7, 6003–6009 CrossRef CAS PubMed
.
- K. R. Raghupathi, R. T. Koodali and A. C. Manna, Langmuir, 2011, 27, 4020–4028 CrossRef CAS PubMed
.
- N. Jones, B. Ray, K. T. Ranjit and A. C. Manna, FEMS Microbiol. Lett., 2008, 279, 71–76 CrossRef CAS PubMed
.
- N. Salah, S. S. Habib, Z. H. Khan, A. Memic, A. Azam, E. Alarfaj, N. Zahed and S. Al-Hamedi, Int. J. Nanomed., 2011, 6, 863 CrossRef CAS PubMed
.
- R. Brayner, R. Ferrari-Iliou, N. Brivois, S. Djediat, M. F. Benedetti and F. Fiévet, Nano Lett., 2006, 6, 866–870 CrossRef CAS PubMed
.
- J. Díaz-Visurraga, C. Gutiérrez, C. Von Plessing and A. García, Science And Technology Against Microbial Pathogens: Research, Development and Evaluation, Formatex: Badajoz, 2011, 210–218 Search PubMed
.
- O. Yamamoto, Int. J. Inorg. Mater., 2001, 3, 643–646 CrossRef CAS
.
- H. Zhang, X. Lv, Y. Li, Y. Wang and J. Li, ACS Nano, 2009, 4, 380–386 CrossRef PubMed
.
- A. Ahmad, Y. Wei, F. Syed, S. Khan, G. M. Khan, K. Tahir, A. U. Khan, M. Raza, F. U. Khan and Q. Yuan, J. Photochem. Photobiol., B, 2016, 161, 17–24 CrossRef CAS PubMed
.
- V. Kumar, R. K. Gundampati, D. K. Singh, M. V. Jagannadham, S. Sundar and S. H. Hasan, J. Ind. Eng. Chem., 2016, 37, 224–236 CrossRef CAS
.
- Y. Li, W. Zhang, J. Niu and Y. Chen, ACS Nano, 2012, 6, 5164–5173 CrossRef CAS PubMed
.
- P. Saini, S. K. Saha, P. Roy, P. Chowdhury and S. P. S. Babu, Exp. Parasitol., 2016, 160, 39–48 CrossRef CAS PubMed
.
- H. W. Murray, J. Exp. Med., 1981, 153, 1302–1315 CrossRef CAS PubMed
.
| This journal is © The Royal Society of Chemistry 2017 |

