 Open Access Article
Gas-phase chemiluminescence of reactive negative ions evolved through corona discharge in air and O2 atmospheres†
Dingkun Zhang ,
Yongzan Zheng,
Xiangnan Dou,
Syed Niaz Ali Shah and
Jin-Ming Lin
 *
*
Department of Chemistry, Beijing Key Laboratory of Microanalytical Methods and Instrumentation, Tsinghua University, Beijing, 100084, China. E-mail: jmlin@mail.tsinghua.edu.cn; Fax: +86-10-6279-2343; Tel: +86-10-6279-2343
First published on 10th March 2017
Abstract
The reactive performance of negative ions evolved in air and O2 atmospheres through a gas-phase chemiluminescence (CL) method was investigated, and was attributed to the reaction between negative oxygen ions (O2−) to evolve emissive singlet oxygen (1O2) species, and a novel CL system was established.
Serving as “air vitamins”, which are of great importance to people’s health, negative ions have been widely investigated and developed for many years1 where the species of negative ions evolved2 and their chemical reactions have drawn considerable attention.3,4 Modern technologies applied for analysis of these reactions have always been mass spectrometry techniques which are sensitive and efficient at obtaining qualitative results.5–7 However, they have suffered from external environment and such equipment is too bulky. CL analysis8 has excellent advantages including high sensitivity, highly responsive signals and portable equipment where recent work has mainly concentrated on the development of new CL systems and their practical application.9 Among the different CL systems, acting as a classic and convenient strategy, gas-phase CL (especially ozone-based CL) has recently been a rapidly growing field.10,11 However, no articles have reported the CL effect of negative ions, which remains a great challenge. Here, the emissive performance of negative ions evolved in air and O2 atmospheres was investigated through gas-phase CL detection. To our knowledge, this is the first report analyzing the gas-phase CL performance of negative ions. It provides a new route for investigating the reacting process and mechanism of negative ions through displayed CL curves. It also created a novel area for studying the degrading effect of negative ions towards gas-phase organic molecules, dust and smog through the CL performance to reveal the reaction principle and for further exploration in practical application.
The setup of the CL system for investigating negative ions is depicted in Fig. 1a. The whole system could be divided into three parts: gas supply, corona discharge, and detecting and recording system. Fig. 1b reveals the detailed structure of the detecting area. The negative ions evolved in a specific atmosphere would be carried into the detecting area to check the CL performance. Different atmospheres could be created by varying the gas used while different kinds of negative ions could be produced and detected.
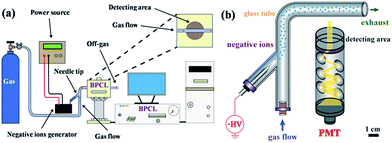 | ||
| Fig. 1 Setup of the CL system for investigating negative ions: (a) main part of the detecting system and (b) detailed structure of the detecting area. | ||
A tube simulation was applied to analyse the distribution regularity of ion concentration, gas velocity and pressure inside the channel (Fig. S1†). A large number of negative ions aggregated near the tip of the generator while the farther negative ions passed, the fewer negative ions left (Fig. S1a†). Fig. S1b and c† showed that a uniform rate and pressure were obtained within the tube, which ensured the transmission of negative ions through the glass tube.
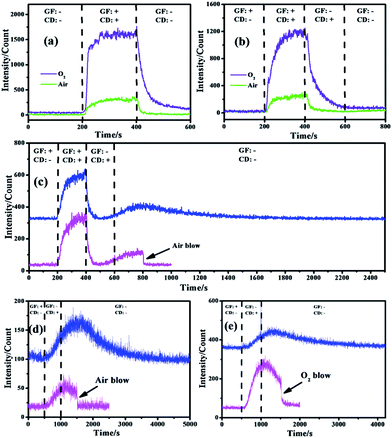
The CL performance of the negative ions evolved in air and O2 atmospheres was tested (Fig. 2a) to qualitatively identify whether luminescence occurred while gas flow and corona discharge existed. It was obvious that no CL was emitted when both gas flow and corona discharge were absent but an obvious and stable effect was detected when they were present simultaneously, which meant background disturbance could be neglected and CL was emitted from such a reaction system. Besides, the curves of air and O2 gradually increased from the baseline since gas flow and discharge were both present. Moreover, the curves of air and O2 also gradually decreased from the strongest intensity since gas flow and discharge were shut down.12 These phenomena revealed that the emissive species needed a period of time for gradual evolution and disappearance.
The role that each factor played within these gas-phase CL systems was investigated and is shown in Fig. 2b with the aim of eliminating external influences and determining the exact emissive species. It was obvious that in air and O2 atmospheres, strong CL emission occurred only when gas flow and corona discharge were turned on while a negligible effect was detected once either of them was shut down, which was similar to what is shown in Fig. 2a. Such a phenomenon revealed that neither pure gas nor electricity could lead to an obvious emission while CL resulted from the synergistic effect of gas flow and corona discharge. The former acted as a source of gas and carrier for negative ion delivery while the latter acted as the origin of negative ions.13 Besides, neither gas flow nor corona discharge alone would lead to a strong CL intensity because neutral gas could not produce luminescence without external influences and the tip of the negative ion generator has been moved far away from the CL detecting area (Fig. 1b) so that the corona luminescence effect created around the tip of the needle by high-voltage discharge could be avoided, which would ensure the identification of gas-phase CL of negative ions by eliminating other light within the detecting area of the CL analyzer.
Interestingly, the curves of air (Fig. 2b) started to rise gradually once the gas flow had been cut off (from 400 to 600 s) and they even continued to increase when both the gas flow and corona discharge were shut down (from 600 to 800 s, Fig. S2†). Such a phenomenon inspired great interest to investigate the principle behind this. As shown in Fig. 2c, the CL spectra for air atmosphere show a continuous rise both with the corona discharge on (from 400 to 600 s) and off (after 600 s) to reach a maximum (at about 800 s) and subsequently decrease gradually and finally vanish. Besides, when gas flow was blown into the reacting tube for cleaning up the residual species within, the CL intensity immediately decreased to the baseline without a progressive decline. It can be deduced that the delivery of the negative ions mainly depended on free diffusion when the gas flow was cut off so that the speed and efficiency were relatively low. According to such a CL spectrum, it takes about 100 s (from 400 to 500 s, Fig. S2†) for negative ions to transfer from the generator to the CL detecting area, and hence a weak signal was detected and then it started to rise (from 500 to 600 s) because more negative ions evolved having diffused to the detection region. Moreover, although the corona discharge was shut down, the curve carried on going up until it reached a maximum, which meant more and more negative ions had arrived and been detected by the PMT (photomultiplier tube) soon afterwards.14 However, the disappearance of negative ions also occurred and was dominant when the maximum intensity was achieved so that the relative CL signals decreased as the negative ions gradually vanished.15 In addition, when fast gas flow was induced to clear away all the residual negative ions within the tube, the CL intensity declined immediately, which clearly demonstrated that there were no emissive species left in the tube and the real illuminant was the gas-phase negative ions.
In order to further confirm these speculations, the CL performance of negative ions produced in stationary gases was investigated and is shown in Fig. 2d and e, where the gas flow at the beginning acted as a pretreatment by pumping in specific pure gas to flush away residual impurities. The inlet and outlet of the CL system should be sealed when the gas flow was shut down (at 500 s) to ensure that no external leakage occurred. It was obvious that in air (Fig. 2d) and O2 (Fig. 2e) atmospheres, pure gas had no CL effect while an obvious effect was detected both when discharge was turned on and subsequently turned off. When it was shut down (after 1000 s), the signals rose gradually, went down slowly and vanished finally.16 However, the CL intensity decreased immediately when fast gas blow was conducted in the tube (Fig. 2d and e). Similar to Fig. 2c, such an interesting phenomenon strongly proved that CL resulted from negative ions rather than gas luminescence or corona luminescence because: (i) these two phenomena would cause obvious and stable signals when only corona discharge was on rather than a gradually increasing signal; (ii) when the discharge was cut off, the signals of these two phenomena would disappear immediately because of no power supply rather than continuously rise; (iii) as residual negative ions were blown out of the tube, such signals suddenly vanished, which meant there were no emissive species left.
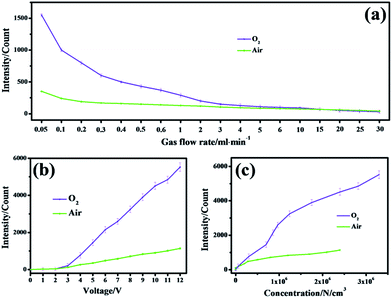
The CL performance of negative ions produced was examined in a wide range of gas flow rates (Fig. 3a). It was obvious that with an increasing rate, a decreasing CL effect occurred in air and O2 atmospheres where gas flows with a lower rate benefited from electron capture by gas molecules to produce negative ions so that more emissive species can be easily produced. If the rate increased, the ions that contributed little to luminescence would evolve due to decomposition through violent collisions between electrons and other molecules.17
A wide range of voltages were applied so as to investigate how the voltage of the negative ion generator tip would influence CL performance. These voltages were set indirectly by a voltage regulator. The higher the value set by the voltage regulator, the higher the voltage emitted on the needle of the negative ion generator (Fig. S3†). It could be seen in Fig. 3b that stronger signals were obtained with higher voltages in both air and O2 atmospheres. Besides, a higher voltage meant a higher concentration of negative ions created in air and oxygen, which resulted in a stronger CL intensity (Fig. 3c). In these two atmospheres, a higher voltage facilitated the acceleration of more free electrons so that subsequent collision or capture with neutral gas molecules to evolve negative oxygen ions appeared to occur more frequently.18 With more negative ions reacting and transforming to emissive species, stronger CL signals could be obtained.
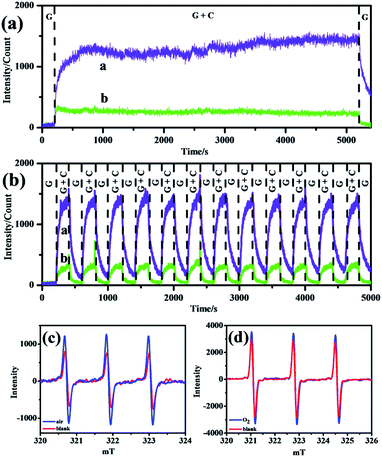
Considering the stability and reproducibility of such strong signals in air and O2 atmospheres, curves of long-time CL performance of negative ions were obtained and are shown in Fig. 4a and b, and demonstrate that in all atmospheres, excellent long-time durability (at least 80 min, Fig. 4a) together with superior long-time repeatability (at least 13 cycles, Fig. 4b) were achieved with negligible fluctuation. With continuous consumption and addition of negative ions within the glass tube, the concentration remained stable for a long time so that the corresponding CL curves in air and oxygen atmospheres remained flat.19
To confirm the existence of 1O2 within the reacting system, room-temperature electron spin resonance (ESR) spectroscopy was applied and the curves are shown in Fig. 4. TEMP could react with 1O2 to produce a TEMPO adduct with three characteristic peaks.20 It could be seen that in air (Fig. 4a) and O2 (Fig. 4b) atmospheres, the ESR intensities of the samples increased compared with that of the blank, which revealed the evolution of 1O2 in the CL system. This was in accordance with previous speculation that emissive 1O2 species stemmed from O2−.
Based on the above discussion, the CL mechanism was proposed as the following reactions (Fig. 5). The negative ions that evolved through corona discharge in air and oxygen atmospheres were identified through mass spectrometry (MS) (Fig. S4†).
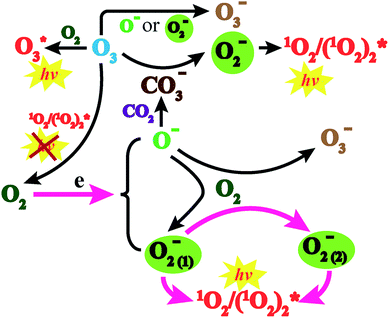 | ||
| Fig. 5 CL mechanism of negative ions evolved through corona discharge with gas flow transport through the glass tube. | ||
A high gas speed meant that there were higher energy electrons which fiercely collided with O2 molecules, leading to the splitting of molecules and a facilitated evolution of O− (reaction (1)).21 Such active species further react with oxygen to evolve O2− ions22 and O3− ions23 (reaction (2)).
| e− + O2 → O− + O (ref. 21) | (1) |
| 2O− + 2O2 → O2− + O/O3− (ref. 22 and ref. 23) | (2) |
However, a low gas speed indicated that there were lower energy electrons which could be captured by oxygen and facilitate the creation of O2−.24 Meanwhile, a charge transfer reaction also occurred between negative ions and oxygen25 (reaction (3)).24,25
 | (3) |
Two O2− ions could collide and react to evolve 1O2 (reaction (4)), which would jump from an excited state to the ground state and emit light26 (reaction (6)). Besides, two 1O2 molecules would also combine to evolve a dimer with emissive properties (reactions (5) and (6)). This explained why CL emitted in the O2 atmosphere was much stronger than that in air (Fig. 2a and b) because a higher concentration of oxygen molecules facilitated the evolution of more O2−. Comparatively, reactive O− could produce fewer emissive 1O2 molecules because of indirect transformation (reactionss (1) and (2)).
| O2− + O2− → 21O2 + 2e− (ref. 26) | (4) |
 | (5) |
 | (6) |
In addition, though the voltage of the corona discharge by the generator was low enough (−2 kV) for evolution of abundant negative ions, a trace amount of O3 was still detected (<50 ppb). Such an oxidizing agent would inevitably consume negative oxygen ions by the electron transfer reaction27 (reaction (7)). Meanwhile, it also acted as the quencher of 1O2 (ref. 28) (reaction (8)), which weakened the CL intensity. However, ozone also contributed to the CL performance by reacting with CO3− which came from interactions between O− and CO2 (ref. 29) to produce O2− (ref. 30) (reaction (9)). In addition, collisions between O3 and O2 could generate an emissive excited state of O3 (ref. 31) (reaction (10)). It could be deduced that on the one hand, corona discharge in pure O3 atmosphere resulted in a negligible CL performance (Fig. S5†), which indicates that a trace amount of emissive species evolved in such an atmosphere; on the other hand, the concentration of ozone produced was negligible compared to that of other negative ions, so the existence of O3 could hardly influence the CL system.27–31
| O−/O2− + O3 → O3− + O/O2 | (7) |
| 1O2 + O3 → 2O2 + O | (8) |
 | (9) |
 | (10) |
Conclusions
The gas-phase CL performance of negative ions evolved in air and O2 atmospheres was investigated. When negative ions produced by corona discharge in air and O2 were carried into a detecting area, obvious and stable CL signals were obtained, which indicated excellent CL performance and potential for intensive research. This proved that O2− species acted as the main reactant for luminescence where they transformed into excited 1O2 for effective emission, which featured: (i) a high concentration of negative ions produced through efficient corona discharge, (ii) high reactivity among negative ions, and (iii) long-time stability and reproducibility of CL signals. It is believed that this new strategy has facilitated the investigation of the reacting process and mechanism of negative ions through CL detection.Acknowledgements
This work was supported by the National Natural Science Foundation of China (no. 21435002, 81373373, 21621003).Notes and references
- J. Zeleny, Science, 1941, 93, 167–172 CAS
.
- M. Bowes and J. W. Bradley, J. Phys. D: Appl. Phys., 2014, 47, 1–10 CrossRef
.
- P. B. Comita and J. I. Brauman, Science, 1985, 227, 863–869 CAS
.
- M. W. First, Science, 1980, 210, 714–716 CAS
.
- S. Cheng, W. Wang, Q. Zhou, C. Chen, L. Peng, L. Hua, Y. Li, K. Houand and H. Li, Anal. Chem., 2014, 86, 2687–2693 CrossRef CAS PubMed
.
- S. Cheng, J. Dou, W. Wang, C. Chen, L. Hua, Q. Zhou, K. Hou, J. Li and H. Li, Anal. Chem., 2013, 85, 319–326 CrossRef CAS PubMed
.
- Y. Seto, M. K. Kataoka, K. Tsuge, I. Ohsawa, K. Iura, T. Itoi, H. Sekiguchi, K. Matsushita, S. Yamashiro, Y. Sano, H. Sekiguchi, H. Maruko, Y. Takayama, R. Sekioka, A. Okumura, Y. Takada, H. Nagano, I. Waki, N. Ezawa, H. Tanimoto, S. Honjo, M. Fukano and H. Okada, Anal. Chem., 2013, 85, 2659–2666 CrossRef CAS PubMed
.
- H. Chen, L. Lin, H. Li and J.-M. Lin, Coord. Chem. Rev., 2014, 263–264, 86–100 CrossRef CAS
.
- K. Toda and P. K. Dasgupta, Chem. Eng. Comm., 2008, 195, 82–97 CrossRef CAS
; A. D. Idowu, P. K. Dasgupta, G. Zhang and K. Toda, Anal. Chem., 2006, 78, 7088–7097 CrossRef PubMed
.
- M. K. Sengupta and P. K. Dasgupta, Anal. Chem., 2011, 83, 9378–9383 CrossRef CAS PubMed
.
- J. Xue, Z. Zhu, S. Zhang and X. Zhang, Luminescence, 2009, 24, 290–294 CrossRef CAS PubMed
.
- V. A. Mohnen, Pure Appl. Chem., 1972, 100, 123–132 Search PubMed
.
- A. M. Tyndall, L. H. Starr and C. F. Powell, Proc. R. Soc. London, Ser. A, 1928, 121, 172–184 CrossRef CAS
; L. B. Loeb, Phys. Rev., 1935, 48, 684–689 CrossRef
.
- T. Maruyama and T. Katayama, J. Appl. Phys., 2003, 94, 7365–7369 CrossRef CAS
.
- S. Scribbins, M. Bowes and J. W. Bradley, J. Phys. D: Appl. Phys., 2013, 46, 1–13 CrossRef
.
- J. Zeleny, Proc. Am. Philos. Soc., 1931, 70, 121–135 Search PubMed
; M. D. Perkins, F. L. Eisele and E. W. Mcdaniel, J. Chem. Phys., 1981, 74, 4206–4207 CrossRef CAS
.
- L. B. Loeb, Phys. Rev., 1921, 17, 89–115 CrossRef CAS
.
- L. B. Loeb, J. Franklin Inst., 1924, 197, 45–55 CrossRef
.
- H. A. Erikson, Phys. Rev., 1922, 20, 117–126 CrossRef CAS
.
- F. A. Villamena, E. J. Locigno, A. Rockenbauer, C. M. Hadad and J. L. Zweier, J. Phys. Chem. A, 2007, 111, 384–391 CrossRef CAS PubMed
.
- M. Mcfarland, D. L. Albritton, F. C. Fehsenfeld, E. E. Ferguson and A. L. Schmeltekopf, J. Chem. Phys., 1973, 59, 6629–6635 CrossRef CAS
.
- I. Okada, Y. Sakai, H. Tagashira and S. Sakamoto, J. Phys. D: Appl. Phys., 1978, 11, 1107–1118 CrossRef CAS
.
- D. A. Parkes, J. Chem. Soc., Faraday Trans., 1972, 68, 613–626 RSC
.
- J. L. Moruzzi and A. V. Phelps, J. Chem. Phys., 1966, 45, 4617–4627 CrossRef CAS
.
- A. E. Roche and C. C. Goodyear, J. Phys. D: Appl. Phys., 1971, 4, 1513–1519 Search PubMed
; R. F. Mathis and W. R. Snow, J. Chem. Phys., 1974, 61, 4274–4278 CrossRef CAS
.
- R. A. Nielsen and N. E. Bradbury, Phys. Rev., 1936, 51, 69–75 CrossRef
.
- C. Lifshitz, R. L. C. Wu, T. O. Tiernan and D. T. Terwilliger, J. Chem. Phys., 1978, 68, 247–260 CrossRef CAS
; J. A. Rutherford, B. R. Turner and D. A. Vroom, J. Chem. Phys., 1973, 58, 5267–5271 CrossRef
.
- R. P. Wayne and J. N. Pitts, J. Chem. Phys., 1969, 50, 3644–3645 CrossRef CAS
.
- J. T. Moseley, P. C. Cosby and J. R. Peterson, J. Chem. Phys., 1976, 64, 4228–4229 CrossRef CAS
.
- S. Williams, M. F. Campos, A. J. Midey, S. T. Arnold, R. A. Morris and A. A. Viggiano, J. Phys. Chem. A, 2002, 106, 997–1003 CrossRef CAS
.
- J. G. Parker, J. Chem. Phys., 1977, 67, 5352–5361 CrossRef CAS
.
Footnote |
| † Electronic supplementary information (ESI) available. See DOI: 10.1039/c6ra21683h |
| This journal is © The Royal Society of Chemistry 2017 |

