 Open Access Article
Tailoring gold and silver colloidal bimetallic nanoalloys towards SERS detection of rhodamine 6G†
A. V. Girão *a,
P. C. Pinheirob,
M. Ferroa and
T. Trindadeb
aDepartment of Materials and Ceramic Engineering – CICECO, University of Aveiro, Campus de Santiago, 3810-195 Aveiro, Portugal. E-mail: avgirao@ua.pt
bDepartment of Chemistry – CICECO, University of Aveiro, Campus de Santiago, 3810-195 Aveiro, Portugal
First published on 10th March 2017
Abstract
Nanoparticles of gold, silver and their bimetallic alloys have been prepared by an adapted method of reduction of the aqueous salts using sodium borohydride. It is demonstrated that the temperature and order of addition of the corresponding salt solutions influence the nanoalloys chemical arrangement giving different surface plasmon resonance behavior. The colloidal dispersions show very good Surface-Enhanced Raman Spectroscopy (SERS) signal towards rhodamine 6G. The obtained nanoparticles were then successfully deposited onto glass supports by evaporation of the respective colloids and also used as functional SERS sensors with efficient detection of trace amounts of the analyzed dye. These spectroscopic studies demonstrated that both mono and bimetallic nanoparticles show very good SERS sensitivity with the advantage of being prepared using a straightforward synthetic method in the absence of an additional stabilizer as needed for commonly used core–shell systems.
Introduction
Metal colloidal nanoparticles (NPs) have been of interest for centuries and have been thoroughly studied due to their unique chemical/physical properties which are clearly distinct from those of their bulk counterparts.1,2 Among these systems, the study of bimetallic nanoalloys (BNPs) has been of great interest because the combination, at the nanoscale, of different metals can result in properties not observed in the bulk metal alloys.3,4 In particular, the physico-chemical properties of BNPs can be tailored according to their metal composition, arrangement, size and shape. Consequently, these nanostructures have been investigated for a number of applications such as in optical markers for biomolecules, chemical and biological sensors, biomedical research or electronics/photovoltaic devices due to their singular optical properties,5–8 with predominant number of reports on their selective catalytic properties as a result of their energetic stability, electronic structure and synergy between the metals.4,9–11A common method for producing monometallic nanoparticles has been the reduction of metal salts dissolved in water, such as the synthesis of colloidal Au using citrate as the reducing-stabilizer agent, a method early described by Turkevich.12 Martin et al. described an alternative synthesis in which by employing controlled NaBH4–NaOH/HAuCl4–HCl ratios the NPs sizes (3.1–5.2 nm) could be controlled and stabilized by physiosorbed boron-based anions.13 This method was also applied to the synthesis of monodispersed BNPs by reduction of distinct metal salts using sodium citrate as the reducing agent.14 If a stronger reducer like sodium borohydride is used in the absence of a stabilizing surfactant, reduction and nucleation take place simultaneously (less than 200 ms) and growth of the nanoparticles is carried out through coalescence and then Ostwald ripening.15,16 The final nanostructure of the BNPs can vary depending on the synthesis conditions and two main types of structures have been described: core–shell structures in which a metal core are coated by shells of a distinct metal; and crystalline solid solutions in which metallic bonds are formed indistinctively of the metals present. In order to obtain homogeneous BNPs with well-defined morphology, with narrow size distribution and tunable composition and structure, a judicious choice of the reacting conditions should be followed that gives control to the nucleation and growth steps of the metal lattice formation.17–19
Colloidal Au and Ag NPs have been extensively used in surface-enhanced (SE) spectroscopies, such as in Surface-Enhanced Raman Spectroscopy (SERS).20–24 Still, the quest for alternative active SERS substrates has been carried out over the past decades and is a topic under extensive investigation. For example, many techniques have been applied in order to produce tunable/sensitive/reproducible SERS substrates based on the immobilization of plasmonic NPs on solid supports using template techniques or lithographic methods.25–29 Hence, the Au/Ag system has been particularly investigated because by tuning the size/shape dependent optical absorption of the NPs, metal substrates with variable SERS sensitivity can be produced. However, in this context, most of the reported works are focused on AuAg core–shell structures whose demanding preparation depends on the shell uniformity and thickness control.30–39 In contrast, only a few reports have been found for conventional and homogeneous AuAg nanoalloys.40–43
In this work, we report an effective method for the synthesis of Au, Ag and homogeneous bimetallic Au/Ag nanoparticles in aqueous medium. Particularly, we demonstrate that the ensuing BNPs exhibit optical properties dependent on the type of nanostructure observed, as consequence of the order of addition of the reactants and reaction temperature of the synthesis. This led us to explore both metal NPs and BNPs as SERS platforms by depositing the respective colloids onto clean glass substrates. Most significantly, we were able to observe higher SERS analytical enhancement factors (AEF) when using BNPs as substrates and using rhodamine 6G as the molecular probe.
Experimental section
The synthesis of the Au, Ag and bimetallic colloids was carried out via NaBH4 reduction of the corresponding salts following an experimental method previously reported, but in the absence of sodium citrate.44,45 For the Au and Ag NPs, a flask containing 30 mL of ultrapure water with 2.3 mg of NaBH4 (2 mM) was kept inside an ice bath, and 10 mL of HAuCl4 or AgNO3 refrigerated solution (1 mM) was added dropwise, under vigorous stirring, leading to a deep red colloid, or yellow colloid in the case of the Ag NPs. After stirring for 10 minutes, the reaction vessel was removed from the ice bath and left in air to reach room temperature. For the Au/Ag and Ag/Au nanoalloys (BNPs), a flask containing 30 mL of ultrapure water with 2.3 mg of NaBH4 (2 mM) was kept inside an ice bath, and 5 mL of HAuCl4 refrigerated solution (1 mM) was added dropwise, under vigorous stirring, followed by dropwise addition of 20.8 mL of AgNO3 refrigerated solution (0.24 mM), keeping vigorous and continuous stirring, leading to a brownish colloid with molar ratio of 1 (AuAg). Another flask containing 30 mL of ultrapure water with 2.3 mg of NaBH4 (2 mM) was kept inside an ice bath, following the previous procedure but the order of the refrigerated salt solutions addition was inverted, obtaining a slightly lighter brownish colloid of Ag/Au nanoalloys with molar ratio of 1 (AgAu).Zeta potential values of the resulting NPs and BNPs have been obtained by electrophoretic measurements (Zetasizer, Malvern Instruments Ltd) and the corresponding absorption spectra were recorded using an UltraViolet-Visible (UV-Vis) Spectrophotometer (Jasco V560). The crystalline structure of the obtained samples was assessed by powder X-ray diffraction (XRD) using a Phillips X'Pert instrument (PANalytical X'Pert HighScore software) operated at 40 kV/50 mA. The basic lattice parameters were obtained using Checkcell, a modified version of Celref free software (http://www.inpg.fr/LMGP). Rietveld refinement method was used in order to evaluate the crystalline lattice parameters of the final materials.46
Morphological and structural characterization of the obtained mono and bimetallic nanoparticles was performed by electron microscopy. Transmission Electron Microscopy (TEM) coupled to a Bruker energy-dispersive X-ray spectroscopy (EDX) detector was carried out using a field emission Gun (FEG)-TEM Hitachi H9000 microscope, operated at 300 kV. The samples were prepared by placing an ultra-pure water diluted drop of the obtained colloids onto the surface of an Agar Scientific conventional copper grid with a continuous amorphous carbon film and left to dry in air. High-Resolution (HR) TEM images and analysis were obtained using a JEOL 2200FS microscope equipped with Oxford EDX detector and in-column Omega filter, operated at 200 kV. A drop of the obtained colloids was highly diluted in ultra-pure water and then placed onto the surface of an Agar scientific copper grid with a lacey amorphous carbon film and left to dry in air. After being completely dried, all the samples were immediately kept in a vacuum box till being were used for examination under the TEM microscopes. Observation, acquisition and data analysis were carried out using Gatan Digital Micrograph Software 1.84.1282 (Gatan Inc. © 1996–2010).
Microscope glass slides (76 mm × 26 mm; thickness 1.1 mm, RS France) were used for film preparation of the obtained metal colloids. Prior to each deposition and in order to obtain surface-free adsorbed species substrates, the glass slides were washed with ethanol p.a. for 10 minutes in an ultrasonic water bath, then abundantly rinsed with ultra-pure water (>18.0 MΩ cm) and dried under compressed air. Deposition of the colloids was carried out using a clean plastic container, inside which dried glass slides were placed. Each container was filled with the NPs or BNPs colloids, as well as a mixture of equal proportions of Au and Ag aqueous colloids, and a nearly continuous thin film was formed by complete water evaporation (48 hours) inside a mini-incubator, in air, kept at 65 °C.
The deposited thin films were coated using a carbon evaporator deposition instrument (Emitech K950X), and analysed by SEM using an analytical Ultra-High-Resolution (UHR) SEM Field-Emission-Schottky-Gun (FE-SEM, Hitachi, SU70), with a resolution of 1 nm, at an accelerating voltage of 15 kV and variable working distances depending on the required image acquisition (15–16 mm for EDX analysis and mapping; 6 mm for HR imaging). In order to assess the final thin films optical properties, the corresponding spectra were recorded using an UV-Vis Spectrophotometer (Jasco V560), in the reflectance/transmittance mode.
Fourier Transform (FT)-Raman experiments were carried out using Raman spectroscopy (Brucker RFS100/S FT-Raman spectrometer; Nd:YAG laser: 1064 nm excitation) and the Raman spectra were recorded after 250 scans with the laser power set at 250 mW and 4 cm−1 spectral resolution, at room temperature. A Micro-Raman spectroscope equipped with distinct laser sources was also used (Horiba Jobin-Yvon LabRAM HR-UV 800, in backscattering configuration and standard objective of ×100 (spot diameter 0.96 nm), equipped with a multichannel CCD detector air cooled at ∼70 °C; excitation lines of 532 nm and He:Ne laser for 632.8 nm excitation). Prior FT-Raman spectra recording, the system was calibrated in frequency using a silicon sample (Si ν1 line at 510.7 cm−1) and a Ne lamp was also used to verify the accuracy of output of the Raman shift in the acquired spectra. All spectra were recorded in the same experimental conditions, at room temperature, using a 200 μm hole, 1800 L mm−1 grating, and exposure time of 30 seconds with 10 accumulation cycles in the Raman range of 2000–1100 cm−1. For each FT-Raman experiment, samples of the substrates without metal particles and/or analyte were used as controls in order to assess the presence of SERS effects in the presence of the metal phases. The samples were evaluated for SERS behavior by using aqueous solutions of rhodamine 6G (initial concentrations 10−3 to 10−9 M). Typically, the platforms were prepared by placing a drop (10 μL) of a rhodamine 6G (RhD6G) solution onto the surface of the substrate and left to evaporate at room temperature. Spectra acquisition was repeated thrice without significant variations in the relative intensities and performed in several different areas of the substrates. The resulting spectra were deconvoluted and fitted using PeakFit version 4.12 software (Seasolve Software Inc. 1999–2003): the baseline of each spectrum was fitted/subtracted using an algorithm of a 2nd derivative zero in a 0.5% interval of tolerance, followed by non-modifying profile smoothing of the spectra according to the Savitzky–Golay function; fitting of the resulting spectra was carried out using a pseudo-Voigt function with a Lorentzian component with a reasonable minimum level, varying width and shape within an amplitude of 1.5%. The metal colloids were analyzed for SERS behavior before and after inducing aggregation of 2 mL of each dispersion with 20 μL of MgCl2 (concentration 2 M) and using 80 μL of analyte solution (concentration 10−4 M).
Results and discussion
Colloids of Au, Ag and their alloys (AuAg and AgAu) have been prepared by reducing the respective metal salts in water using NaBH4. These metal colloids remain stable over time thus showing no significant changes in their optical features as illustrated by the UV-Vis spectra (Fig. 1).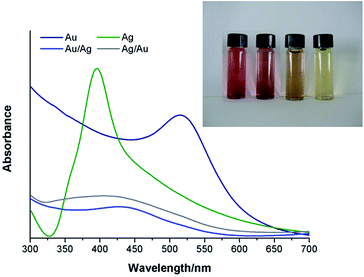 | ||
| Fig. 1 UV-Vis spectra obtained for the colloidal Au and Ag NPs and BNPs in ultra-pure water. The inset shows a photograph of the Au, AuAg, AgAu and Ag colloidal NPs (left to right). | ||
For both the mono and bimetallic colloids, a single SPR absorption band was observed, whose wavelength location varied according to the respective metal composition. For the case of the BNPs, the presence of a single SPR band is indicative of the presence of alloy nanospheres instead of distinct metal phases (see ESI, Fig. S1†).3,47–49 The inset in Fig. 1 clearly shows different colors for the obtained colloidal AuAg and AgAu where the first appears to be more similar to that of the Au colloid (reddish) and the latter appears more like the Ag one (yellowish). The SPR of the AuAg colloidal nanoparticles is closer to that of Au and the SPR of the AgAu NPs to that of silver. Dynamic Light Scattering (DLS) measurements were also performed in order to assess the average zeta potential (ξ) and ionic conductivity (κ) (Table 1).
| Sample | SPR/nm | ξaverage/mV | κaverage/mS cm−1 |
|---|---|---|---|
| Au | 515.1 | −32.8 | 0.170 |
| AuAg | 432.6 | −41.4 | 0.126 |
| Ag | 395.8 | −43.1 | 0.199 |
| AgAu | 410.3 | −37.8 | 0.145 |
As expected, the zeta potential values of the colloidal metal NPs are negative due to anionic borohydride-derived species adsorbed at the particles surfaces that confer colloidal stability due to interparticle electrostatic repulsion.50 Moreover, the average ionic conductivity and the zeta potential values were similar for all the analyzed sols which accounts for their comparable colloidal stability.50
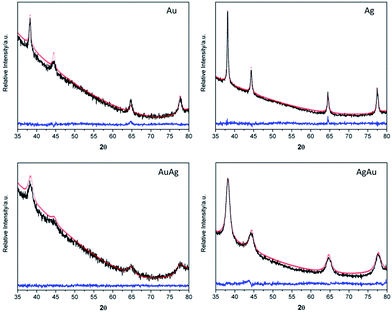
Powder X-Ray Diffraction (XRD) was performed on the powdered samples, after solvent evaporation, showing that all the samples crystallized in the cubic system, space group Fm3m, as shown by the XRD profiles and corresponding Rietveld refinements (Fig. 2).
Calculated cell parameters and quantification of Au/Ag content and distribution in the nanoalloyed species were obtained using the Rietveld refinement method,51–55 whose results are shown in Table 2.
| Sample | a/Å | Au/% | Rwp/% | Rp/% | RBragg | χ2 |
|---|---|---|---|---|---|---|
| Au | 4.07945 | 100 | 43.0 | 86.9 | 1.25 | 1.60 |
| AuAg | 4.07804 | 50 | 47.5 | 81.2 | 1.11 | 1.39 |
| Ag | 4.08420 | 0 | 14.0 | 19.4 | 1.26 | 1.71 |
| AgAu | 4.06904 | 50 | 13.8 | 17.9 | 1.20 | 1.53 |
The results shown in Table 2 are in agreement with the presence of crystalline phases for the respective pure metal or, for the binary systems, with the formation of alloys, instead of a mixture of monometallic NPs. In fact, for the latter case, the XRD diffraction patterns would show overlapping lines of the two distinct metals instead of those experimentally observed. The calculated cell parameters are in good agreement with those from ICCD for the bulk species.56–58 Despite the fact that Rietveld refinement confirmed 50% of occupation sites for both Au and Ag in the nanoalloys, they exceptionally present different lattice parameters which is most probably due to a difference in the crystalline lattice stabilization as a function of the order of addition of the corresponding salts solutions during the synthesis. Moreover, a negative deviation from the theoretical Vegard's Law is observed for the lattice parameters found for the AuAg and AgAu nanoalloys. Although Ag and Au atoms in their parent lattices are nearly equal in size, it has been reported that for their alloys there is a decrease of the volume and effective lattice parameters since silver becomes smaller than gold due to the electronic interactions between the outer electron shells of Ag and the surrounding atoms of gold.59 Rietveld refinement results also suggest that regardless the order of addition of the precursor salts, the bulk composition of the BNPs is similar, which is in line with previous results reported for nanoalloys of Au and Ag.11,48 However, it is instructive at this stage to take in consideration the UV-Vis measurements performed on the BNPs colloids (Fig. 1) and that have shown differences depending on the order of addition of the metal salts during their synthesis. BNPs have been reported to have a Ag-enriched surface though the final chemical distribution also depends on the degree mixing-segregation and stacking structure which, in turn, depend on the order of addition of the metal salts.48,60 Therefore, the latter plays a critical role in leading to a higher number of Au atoms located at the AuAg BNPs surfaces, with a concomitant blue-shift in the SPR band, as compared to the AgAu BNPs in which a higher number of Ag atoms are expected at the surface, thus explaining the observed red-shift in the SPR in the UV-Vis spectrum.
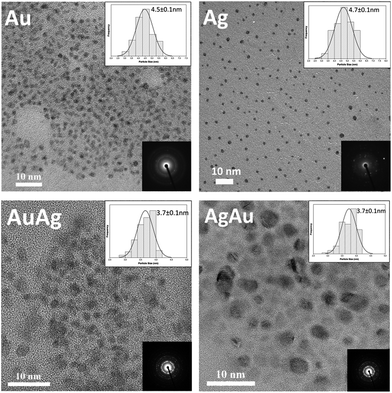
Fig. 3 shows TEM images obtained for Au, Ag, AuAg and AgAu NPs having average diameters between 3.7 and 4.7 nm, with aggregation occurring to some extent due to deposition of the colloids onto the carbon coated copper grids.
EDX analysis confirmed the presence of the expected metal elements in the respective samples (see ESI, Fig. S2†). High-Resolution (HR) TEM analysis provided information on the fine crystalline structure of the metal NPs and BNPs. Hence, a series of measurements have been carried out and the dhkl value for (200) was used for comparative purposes. Table 3 summarizes the data for reported, calculated and experimental d200 values for the analyzed samples.
| Sample | aexp/Å (RR) | d200/Å reported | d200/Å (RR) | d200/Å (HR-TEM) |
|---|---|---|---|---|
| Au | 4.079 | 2.039 | 2.040 | 2.079 |
| AuAg | 4.078 | 2.038 | 2.039 | 2.084 |
| Ag | 4.084 | 2.043 | 2.042 | 2.087 |
| AgAu | 4.069 | 2.038 | 2.035 | 2.062 |
HRTEM images in Fig. 4 and the data in Table 3 enabled confirmation of the BNPs as nanoalloys.
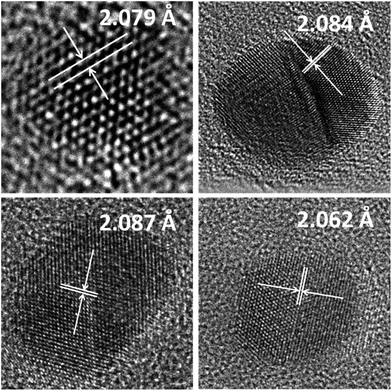 | ||
| Fig. 4 HR-TEM images of the obtained NPs and BNPs. Arrows indicate the d200 interplanar distance in the illustrated crystalline structure. | ||
The slight differences observed for the d200 values depending on the technique used are acceptable by bearing in mind that XRD measurements are for a polycrystalline sample and that the measurements in the HR-TEM images are inevitably affected by the presence of the amorphous carbon film which may give rise to slightly higher dhkl values.
A series of FT-Raman experiments were carried out using rhodamine 6G (RhD6G, 80 μL, 1 × 10⁻⁴ M) as the molecular probe, which is a qualified analyte for SERS studies using Au, Ag and bimetallic NPs.61–67 The mono and bimetallic colloids, as well as the physical mixture of Au and Ag (1![[thin space (1/6-em)]](https://www.rsc.org/images/entities/char_2009.gif) :
:![[thin space (1/6-em)]](https://www.rsc.org/images/entities/char_2009.gif) 1) dispersions, were firstly tested for SERS detection by inducing the NPs aggregation using aqueous MgCl2 solution and a non-resonant laser line of 632.8 nm, as seen in Fig. 5.
1) dispersions, were firstly tested for SERS detection by inducing the NPs aggregation using aqueous MgCl2 solution and a non-resonant laser line of 632.8 nm, as seen in Fig. 5.
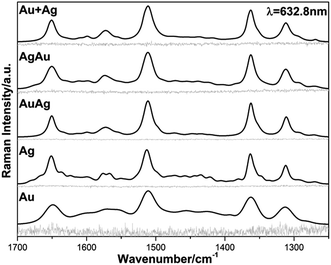 | ||
| Fig. 5 Raman and SERS spectra of RhD6G acquired using the non-resonant 632.8 nm line for the analyzed colloidal Au, Ag, AuAg, AgAu and Au + Ag NPs. | ||
Fig. 5 illustrates the Raman spectra (RS) obtained before inducing clustering of the nanoparticles and corresponding SERS spectra for the NPs and BNPs obtained after creating conditions for generating hot-spots in the colloidal dispersions.63 The obtained spectra profiles are all very similar and the observed scattered frequencies are in very good agreement with the modes reported for RhD6G, as summarized in Table 4.68 The analytical enhancement factor (AEF) is a parameter that can be used to roughly evaluate the SERS performance of the obtained colloids. In order to determine AEF the spectra were properly processed and, for comparison purposes, the vibrational stretching mode 1510 cm−1 corresponding to one of the most intense vibrations of the xanthene ring of the RhD6G molecule was selected.68 Consequently, AEF was determined according to the following equation:61
| AEF = (ISERS/IRS)/(CRS/CSERS) | (1) |
| Colloid | ν/cm−1 | Assignment | ν/cm−1 | Assignment | ν/cm−1 | Assignment | ν/cm−1 | AEF |
|---|---|---|---|---|---|---|---|---|
| Au | 1313 | NHC2H5 groups and xanthene ring stretching | 1364 | Aromatic C–C stretching | 1513 | Xanthene C–C stretching | 1652 | 8.7 × 10³ |
| Ag | 1312 | 1363 | 1512 | 1651 | 5.6 × 10⁴ | |||
| AuAg | 1311 | 1362 | 1511 | 1650 | 9.0 × 10⁴ | |||
| AgAu | 1312 | 1363 | 1512 | 1651 | 4.0 × 10⁴ | |||
| Au + Ag | 1312 | 1363 | 1512 | 1651 | 3.1 × 10⁴ |
According to previous studies, the highest AEF has been mainly obtained for Ag NPs which is in very good agreement with our results since the Ag-containing colloids present a higher AEF than that for Au.61,64 Unfortunately, we were not able to establish a correlation between the different BNPs surface properties and impact on the SERS results due to loss of those properties when random aggregation of the nanoparticles takes place.21
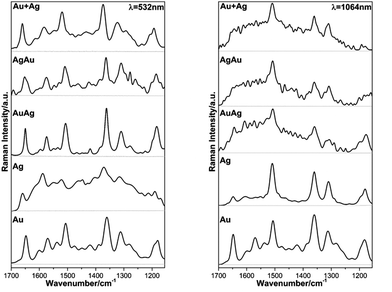
In face of these observations, we decided to perform SERS measurements on evaporated cast films on glass using the metal colloids, which in this case can provide a larger density of hot spots within the laser-illumination area.23 The SEM images, EDX spectra and mapping of the evaporated films are shown in the ESI (Fig. S3 and S4†). Fig. 6 shows the FT-Raman spectra of the metal substrates without the analyte as well as the Raman spectra for the same substrates with an evaporated aliquot of RhD6G (10 μL, 1 × 10⁻⁴ M), using different laser excitation lines, the resonant one of 532 nm and a non-resonant line of 1064 nm.
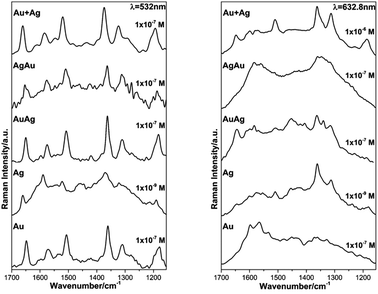
As expected, the obtained SERS spectra for RhD6G present different profiles according to the excitation wavelength bearing in mind that those acquired at 532 nm of excitation are resonant ones (see ESI, Fig. S5†).54,69,70 The observed scattered frequencies are also in very good agreement with the modes reported for RhD6G.68 In this case, the observed signal enhancement is certainly not due to plasmon coupling since the thin films did not present any surface plasmon resonances as verified by diffuse reflectance electronic spectroscopy (see ESI, Fig. S6†). The observed SERS signal range is in good agreement with previous studies using thermally-evaporated multiple layered gold or/and silver thin films.71–73 On the other hand, we present a reliable alternative and simple method for the preparation of mono/bimetallic nanoparticles as well as their straightforward cast as thin films enabling SERS detection of smaller aliquots (10 μL). Fig. 7 shows the SERS spectra obtained for the lowest detectable RhD6G concentration at the resonant line 532 nm and non-resonant excitation at 632.8 nm.
Regarding the lower RhD6G concentration detected by SERS it was possible to verify that for excitation wavelengths of 532 nm and 632.8 nm the analyte was distinguished (1 × 10⁻⁹ M) when using the Ag thin film which is in good agreement with most of theoretical and experimental predictions where Ag NPs show higher SERS enhancement than gold.64 Nonetheless, the NPs and BNPs substrates SERS performance towards detection of RhD6G was as good as that of Au NPs thin films fabricated by electrophoretic deposition in which the distribution and size of the NPs is highly controlled.65 Most importantly, the prepared BNPs substrates have demonstrated similar performance as that of AuAg core–shell systems, bearing in mind their simple synthetic method.31,38 At 1064 nm of excitation wavelength the minimum concentration of the analyte detected was 1 × 10⁻⁴ M. Finally, these results clearly confirm that SERS enhancement does not depend solely on coupling between the excitation wavelength with the SPR of the nanoparticles but also on other factors such as size, distribution and type of the NPs.64 These results clearly demonstrate that the fabrication of stable metallic nanostructures on solid substrates enable large surface area for the adsorption of the analyzed analyte and larger density of the so-called hot spots within the laser-illumination area consequently assuring enhancement of the Raman signal.
Conclusions
A fully optimized method for the production of such Au/Ag nanoalloys has been adapted and it has been demonstrated to be more advantageous than most of the co-reduction method for the preparation of NPs and/or BNPs. The presented modified synthesis method enables low-cost and fast production of stable gold and silver nanoalloys with different physico-chemical properties, without the need of high temperature and/or a second stabilizer like sodium citrate. The resulting colloids present nanoparticles with narrow size/shape distribution around 3–4 nm which are non-photosensitive remaining stable for more than one year. The temperature and order of addition of the corresponding salt solutions to the sodium borohydride solution influences the nanoalloys final structures and NaBH4 plays the most important role in the reduction/stabilization of the metallic salts. The latter issue is being further investigated using other analytical techniques such as liquid and solid-state nuclear-magnetic resonances. The stabilizing mechanism in this synthetic process is still not fully understood and further studies are undergoing in order to report this new approach extended to most metallic and bimetallic colloidal nanocrystals. This modified experimental method is already being applied to the synthesis and preparation of further nanoparticles such as bimetallic (Pt and Pd), magnetic and/or oxide (Co, Cu or Fe) nanoparticles.We have demonstrated the SERS efficiency of the NPs and BNPs colloids towards rhodamine 6G detection with very similar performance as that of AuAg core–shell systems. Stable and functional substrates for SERS detection were prepared via controlled evaporation deposition of the colloidal NPs and BNPs onto glass slides. The latter showed that SERS enhancement takes place at a larger area with specific hot spots at the surface of the obtained thin films. Equally, evaluation of the obtained SERS spectra revealed the substrates ability to detect trace amounts of the studied analyte.
Acknowledgements
The authors thank Fundação para a Ciência e a Tecnologia (Portugal) for funding under the PTDC program and FEDER (PTDC/CTM/101453/2008), and for the post-doctoral grant SFRH/BPD/66407/2009 (A. V. Girão), as well as the PhD grant SFRH/BD/96731/2013 (P. C. Pinheiro). Microscopy analysis was supported by RNME-Pole University of Aveiro FCT Project REDE/1509/RME/2005.Notes and references
- Y. Yin and A. P. Alivisatos, Nature, 2005, 437, 664 CrossRef CAS PubMed.
- E. Roduner, Chem. Soc. Rev., 2006, 35, 583 RSC.
- F. Calvo, Nanoalloys, Elsevier, Villeurbanne, 1st edn, 2013 Search PubMed.
- R. Ferrando, J. Jellinek and R. L. Johnston, Chem. Rev., 2008, 108, 845 CrossRef CAS PubMed.
- S. K. Ghosh and T. Pal, Chem. Rev., 2007, 107, 4797 CrossRef CAS PubMed.
- M. Achermann, M. A. Petruska, D. D. Koleske, M. H. Crawford and V. I. Klimov, Nano Lett., 2006, 6, 1396 CrossRef CAS PubMed.
- P. P. Pompa, L. Martiradonna, L. Della Torre, F. Della Sala, L. Manna, M. De Vittorio, F. Calabi, R. Cingolani and R. Rinaldi, Nat. Nanotechnol., 2006, 1, 126 CrossRef CAS PubMed.
- D. L. Klein, R. Roth, A. K. L. Lim, A. P. Alivisatos and P. L. McEun, Nature, 1997, 389, 699 CrossRef CAS.
- Y. Zhu, R. Qian and R. Jin, J. Mater. Chem., 2011, 21, 6793 RSC.
- B. M. Muñoz-Flores, B. I. Kharisov, V. M. Jiménez-Pérez, P. E. Martínez and S. T. Lopez, Ind. Eng. Chem. Res., 2011, 50, 7705 CrossRef.
- D. Wang and Y. Li, Adv. Mater., 2011, 23, 1044 CrossRef CAS PubMed.
- J. Turkevich, P. C. Stevenson and J. Hillier, Discuss. Faraday Soc., 1951, 11, 55 RSC.
- M. N. Martin, J. I. Basham, P. Chando and S.-K. Eah, Langmuir, 2010, 26, 7410 CrossRef CAS PubMed.
- J. F. Sánchez-Ramirez, U. Pal, L. Nolasco-Hernández, J. Mendonza-Álvarez and J. A. J. Pescador-Rojas, J. Nanomater., 2008, 620412 Search PubMed.
- J. He, X. M. Lin, R. Divan and H. M. Jaeger, Small, 2011, 7, 3487 CrossRef CAS PubMed.
- N. T. K. Thanh, N. Maclean and S. Mahiddine, Chem. Rev., 2014, 114, 7610 CrossRef CAS PubMed.
- L. M. Liz-Márzan, Langmuir, 2006, 22, 32 CrossRef PubMed.
- O. Masala and R. Seshadri, Annu. Rev. Mater. Res., 2004, 34, 41 CrossRef CAS.
- I. Ojea-Jiménez, N. G. Bastús and V. J. Puntes, J. Phys. Chem. C, 2011, 115, 15752 Search PubMed.
- K. A. Willets and R. P. Van Duyne, Annu. Rev. Phys. Chem., 2007, 58, 267 CrossRef CAS PubMed.
- H. Ko, S. Singamaneni and V. V. Tsukruk, Small, 2008, 4, 1576 CrossRef CAS PubMed.
- M. Fan, G. F. S. Andrade and A. G. Brolo, Anal. Chim. Acta, 2011, 693, 7 CrossRef CAS PubMed.
- S. Schlücker, Surface Enhanced Raman Spectroscopy: Analytical, Biophysical and Life Science Applications, John Wiley & Sons, Inc., Weinheim, 2011 Search PubMed.
- M. Mandal, N. R. Jana, S. Kundu, S. K. Ghosh, M. Panigrahi and T. Pal, J. Nanopart. Res., 2004, 6, 53 CrossRef CAS.
- R. Alvarez-Puebla, B. Cui, J.-P. Bravo-Vasquez, T. Veres and H. Fenniri, J. Phys. Chem. C, 2007, 111, 6720 CAS.
- W. Yue, Z. Wang, Y. Yang, L. Chen, A. Syed, K. Wong and X. J. Wang, J. Micromech. Microeng., 2012, 22, 125007 CrossRef.
- N. C. Lindquist, P. Nagpal, K. M. McPeak, D. J. Norris and S.-H. Oh, Rep. Prog. Phys., 2012, 75, 036501 CrossRef PubMed.
- I. Sow, J. Grand, G. Lévi, J. Aubardx, N. Félidj, J.-C. Tinguely, A. Hohenau and J. R. Krenn, J. Phys. Chem. C, 2013, 117, 25650 CAS.
- S. J. Barcelo, W. Wu, X. Li, Z. Li and R. S. Williams, Appl. Phys. A, 2015, 121, 443 CrossRef CAS.
- Y. Cui, B. Ren, J. L. Yao, R. A. Gu and Z. Q. Tian, J. Phys. Chem. B, 2006, 110, 4002 CrossRef CAS PubMed.
- S. Lee, S. Kim, J. Choo, S. Y. Shin, Y. H. Lee, H. Y. Choi, S. H. Ha, K. H. Kang and C. H. Oh, Anal. Chem., 2007, 79, 916 CrossRef CAS PubMed.
- G. V. P. Kumar, S. Shruthi, B. Vibha, B. A. A. Reddy, T. K. Kundu and C. Narayana, J. Phys. Chem. C, 2007, 111, 4388 CAS.
- F. Pincella, Y. Song, T. Ochiai, K. Isozaki and K. Sakamoto, Chem. Phys. Lett., 2014, 605, 115 CrossRef.
- S. H. Park, J. G. Son, T. G. Lee, J. Kim, S. Y. Han, H. M. Park and J. Y. Song, Nanoscale Res. Lett., 2014, 9, 679 CrossRef PubMed.
- R. A. Alvarez-Puebla, G.-A. Nazri and R. F. Aroca, J. Mater. Chem., 2006, 16, 2921 RSC.
- L.-B. Yang, G.-Y. Chen, J. Wang, T.-T. Wang, M.-Q. Li and J.-H. Liu, J. Mater. Chem., 2009, 19, 6849 RSC.
- B. N. Khlebtsov, V. A. Khanadeev, M. Y. Tsvetkov, V. N. Bagratashvili and N. G. Khlebtsov, J. Phys. Chem. C, 2013, 117, 23162 CAS.
- J. Wang, F. Zhou, G. Duan, Y. Li, G. Liu, F. Su and W. Cai, RSC Adv., 2014, 4, 8758 RSC.
- R. G. Chaudhuri and S. Paria, Chem. Rev., 2012, 112, 2373 CrossRef PubMed.
- Y. Wang, H. Chen, S. Dong and E. Wang, J. Chem. Phys., 2006, 125, 044710 CrossRef PubMed.
- D. Philip, K. G. Gopchandran, C. Unni and K. M. Nissamudeen, Spectrochim. Acta, Part A, 2008, 70, 780 CrossRef PubMed.
- R. A. Alvarez-Puebla, J. P. Bravo-Vasqueza, P. Cheben, D.-X. Xub, P. Waldronb and H. Fenniri, J. Colloid Interface Sci., 2009, 333, 237 CrossRef CAS PubMed.
- N. L. Netzer, C. Qiu, Y. Y. Zhang, C. K. Lin, L. F. Zhang, H. Fong and C. Y. Jiang, Chem. Commun., 2011, 47, 9606 RSC.
- Y. Chen, R. E. Palmer and J. P. Wilcoxon, Langmuir, 2006, 22, 2851 CrossRef CAS PubMed.
- Y. Fang, J. Chem. Phys., 1998, 108, 4315 CrossRef CAS.
- J. Rodriguez-Carvajal and T. Roisnel, FullProf. 98 and WinPLOTR: New Windows 95/NT Applications for Diffraction Commission for Powder Diffraction, International Union for Crystallography, 1998 Search PubMed.
- S. Link, Z. L. Wang and M. A. El-Sayed, J. Phys. Chem. B, 1999, 103, 3529 CrossRef CAS.
- A. Shah, L. Rahman, R. Qureshi and Z. Rehman, Rev. Adv. Mater. Sci., 2012, 30, 133 CAS.
- J. F. Gomes, A. C. Garcia, C. Pires, E. B. Ferreira, R. Q. Albuquerque, G. Tremiliosi-Filho and L. H. S. Gasparotto, J. Phys. Chem. C, 2014, 118, 28868 CAS.
- J. Zhang, T. S. Fisher, J. P. Gore, D. Hazra and P. V. Ramachandran, Int. J. Hydrogen Energy, 2006, 31, 2292 CrossRef CAS.
- H. M. Rietveld, Acta Crystallogr., 1967, 22, 151 CrossRef CAS.
- H. M. Rietveld, J. Appl. Crystallogr., 1969, 2, 65 CrossRef CAS.
- R. Delhez and E. J. Mittenmeijer, Materials Science Forum, Proceedings of the Seventh European Powder Diffraction Conference (EPDIC 7), Toulouse, 1990, p. 118 Search PubMed.
- J. Rodríguez-Carvajal, Phys. B, 1993, 192, 55 CrossRef.
- T. Roisnel and J. Rodríguez-Carvajal, Mater. Sci. Forum, 2001, 378, 118 CrossRef.
- S. Kabekkodu, Powder Diffraction File Inorganic and Organic Data Book, The International Centre for Diffraction Data® (ICDD®), PDF 04-003-3089, Newtown Square, 2010 Search PubMed.
- S. Kabekkodu, Powder Diffraction File Inorganic and Organic Data Book, The International Centre for Diffraction Data® (ICDD®), PDF 04-003-3089, Newtown Square, 2010 Search PubMed.
- S. Kabekkodu, Powder Diffraction File Inorganic and Organic Data Book, The International Centre for Diffraction Data® (ICDD®), PDF 04-003-3089, Newtown Square, 2010 Search PubMed.
- V. A. Lubarda, Mech. Mater., 2003, 35, 53 CrossRef.
- M. A. El-Sayed, Chem. Rev., 2006, 35, 209 RSC.
- E. C. Le Ru, E. Blackie, M. Meyer and P. G. Etchegoin, J. Phys. Chem. C, 2007, 111, 13794 CAS.
- L. Lu and A. Eychmüller, Acc. Chem. Res., 2008, 41, 244 CrossRef CAS PubMed.
- S. E. J. Bell and M. R. McCourta, Phys. Chem. Chem. Phys., 2009, 11, 7455 RSC.
- Y. Fleger and M. Rosenbluh, Int. J. Opt., 2009, 2009, 475941 Search PubMed.
- S.-Q. Zhu, T. Zhang, X.-L. Guo, Q.-L. Wang, X. Liu and X.-Y. Zhang, Nanoscale Res. Lett., 2012, 7, 613 CrossRef PubMed.
- M. Fan, F.-J. Lai, H.-L. Chou, W.-T. Lu, B.-J. Hwang and A. J. Brolo, Chem. Sci., 2013, 4, 509 RSC.
- L. Chen, J. M. Chabua and Y. Liua, RSC Adv., 2013, 3, 4391 RSC.
- H. H. Watanabe, N. Hayazawa, N. Inouye and S. J. Kawata, J. Phys. Chem. B, 2005, 109, 5012 CrossRef CAS PubMed.
- M. Wahadoszamen, A. Rahaman, N. M. R. Hoque, I. Talukder, K. M. Abedin and A. F. M. Y. Haide, J. Spectrosc., 2015, 2015, 895317 Search PubMed.
- R. A. Alvarez-Puebla, J. Phys. Chem. Lett., 2012, 3, 857 CrossRef CAS PubMed.
- C. Zhang, S. Z. Jiang, C. Yang, C. Hui, Y. Y. Huo, X. Y. Liu, A. H. Liu, S. S. Gao, X. G. Gao and B. Y. Man, Sci. Rep., 2016, 6, 25243 CrossRef CAS PubMed.
- M. Y. Khaywah, S. Jradi, G. Louarn, Y. Lacroute, J. Toufaily, T. Hamieh and P.-M. Adam, J. Phys. Chem. C, 2015, 119, 26091 CAS.
- E. B. Santos, N. V. Madalossi, F. A. Sigoli and I. O. Mazali, New J. Chem., 2015, 39, 2839 RSC.
Footnote |
| † Electronic supplementary information (ESI) available. See DOI: 10.1039/c7ra00685c |
| This journal is © The Royal Society of Chemistry 2017 |

