 Open Access Article
Creative Commons Attribution 3.0 Unported Licence
Evaluation of optical properties and chemical structure changes in enzymatic hydrolysis lignin during heat treatment†
Neng Li abcd,
Yuhe Chen*ad,
Hui Yuad,
Fuquan Xiongc,
Wenji Yu*ac,
Minzhen Baoc,
Zaixing Wuad,
Chengjian Huangad,
Fei Raoa,
Jianzhang Lib and
Yongjie Bao*acd
aChina National Bamboo Research Center, Wenyi Road 310, Hangzhou 310012, China. E-mail: yuhec@sina.com; baoyongjie1@126.com; Fax: +86057188861671; Fax: +86057188860687; Tel: +86057188861671 Tel: +86057188860687
bDepartment of Wood Science and Technology, Beijing Forestry University, Beijing 10091, China
cResearch Institute of Wood Industry, Chinese Academy of Forestry, Dongxiaofu 1, Beijing 100091, China. E-mail: yuwenji@caf.ac.cn; Fax: +8601062889427; Tel: +8601062889427
dKey Laboratory of High Efficient Processing of Bamboo of Zhejiang Province, Wenyi Road 310, Hangzhou 310012, China
First published on 11th April 2017
Abstract
Heat treatment is an excellent method of improving the properties of wood. Study of the physical and chemical changes of lignin during heat treatment is essential for expanding the application areas based on new properties. In this study, we investigated the degradation behavior of enzymatic hydrolysis lignin (EHL) heat treated at different temperatures (180 °C, 200 °C, and 220 °C) and for different durations (2 h and 4 h). The optical property changes of EHL before and after heat treatment were investigated by measuring color and UV-Vis absorbance changes. Fourier transform infrared spectroscopy (FTIR) was used to characterize the chemical modifications resulting from heat treatment. Mass spectrometry (MS) was used to elucidate the variation of the mass-to-charge (m/z) ratios of ions produced by EHL during heat treatment. These experimental results indicate that both the EHL mass loss percentages and chromatic aberration exhibited an increase with increasing temperature and duration of heat treatment. In contrast, the UV-Vis absorbance, most of the FTIR absorption peaks, and the m/z values of EHL showed a decreasing trend. It was found that the color change of lignin was not the major cause of wood discoloration during heat treatment. The better resistance of the heat treated wood toward solar radiation was attributed to the lower UV absorption of post-treatment lignin.
Introduction
Wood heat treatment has become an attractive way to increase the durability and service life of non-naturally durable species leading to industrial applications.1 Furthermore, heat treatment can enhance dimensional stability and change the equilibrium moisture content and chemical structure. Heat treatment consists of a wood torrefaction at temperatures ranging from 160 °C to 250 °C, performed in an oxygen-poor atmosphere to avoid wood combustion. This process has a low environmental impact, heat is introduced in the treatment system, and smoke issued from the thermal degradation of wood can be retrieved, condensed, and purified.2 Under high-temperature conditions, a series of complex chemical reactions, such as degradation and condensation, take place in the cell wall of the wood.3 The main constituents of wood cell walls are hemicellulose, cellulose, and lignin. Hemicellulose degrades easily at lower temperatures and in a shorter duration relative to the other macromolecular components.4,5 The degradation starts by deacetylation, and the released acetic acid acts as a depolymerization catalyst that further increases polysaccharide decomposition.6 Cellulose exhibits a higher resistance to thermal degradation in comparison to hemicellulose, and its crystallites do not decompose until 300 °C, but are completely decomposed at 340 °C. However, amorphous cellulose does degrade in the heat treatment process, which results in a decrease accessibility of hydroxyl groups to water molecules,7–9 which contributes to a decrease of equilibrium moisture content, in addition to the major effect caused by the degradation of hemicellulose. Lignin is the most stable polymeric material against thermal degradation. Heat-treated wood of spruce, fir and poplar showed a higher content of lignin than untreated wood. However, some thermal degradation of lignin can start at the beginning of the treatment and the changes in lignin have been found to be dependent upon the temperature and duration of the treatment, albeit at a lower rate than polysaccharides.5,10 Since the mechanisms of the chemical reactions that occur during thermal degradation of wood are unknown,2 a thorough investigation of the changes in the optical properties and chemical structure of pure lignin during the process of heat treatment is necessary.Lignin is the second most abundant plant biopolymer on earth after cellulose, accounting for 25–30% of lignocellulose.11,12 Lignin is a random and complex polymer composed of phenylpropanoid units. It is an amorphous polymer and units are linked by different linkages.13 Lignin plays an important role in the plant cell by providing structural support, plant fibers binding, impermeability, and resistance against microbial attacks.14,15 Lignin contains many chromophores and has an aromatic structure that absorbs sunlight, especially in the UV region. Approximately 80–95% of UV light incident on wood surface is absorbed by lignin, and it is therefore easily decomposed by photo-oxidative processes.16,17 Wood heat treatment was reported as a significant protective method to ensure color stabilization of wood surface during weathering.18,19 However, the question of how heat treatment improves the color stability of wood requires clarification. A possible hypothesis is that the thermal degradation product of lignin is more stable than the untreated form when exposed to sunlight.
The objective of this study was to determine the evolution of the optical properties and chemical structure of lignin during heat treatment. Enzymatic hydrolysis lignin (EHL) extracted from hardwood was treated at different temperatures for several hours. Optical changes of the EHL before and after heat treatment were investigated by measuring color and UV-Vis absorbance. Changes to the functional groups of EHL were determined using Fourier transform infrared spectroscopy (FTIR). Finally, the mass-to-charge (m/z) ratios of lignin-derived ions were measured by Mass Spectrometry (MS).
Experimental
Materials
EHL with hydroxyl group content of 1.87 mmol g−1 (including 0.26 mmol g−1 aliphatic-hydroxyl and 1.61 mmol g−1 phenolic-hydroxyl) and Klason lignin content of 84.91%, was obtained from Hong Kong Laihe Biotechnology Co., Ltd. It dissolved well in N,N-dimethyl formamide (DMF) and tetrahydrofuran (THF). Prior to heat treatment, EHL was dried at 65 °C for 12 h and preserved in refrigerator with 3–5 °C and dry atmosphere.Enzymatic hydrolysis lignin wafers (EHLWs) were obtained by tablet machine, which were used 0.2 g EHL to form and prepared to observe the change in color and mass loss of EHL after heat treatment. Preparation of EHLWs was under pressure of 30 MPa for 3 min.
Heat treatment
EHL and EHLWs were heat treatment at 180 °C, 200 °C, and 220 °C for either 2 h or 4 h in a modified dry oven connected to a water vapor supply system. The specific heat treatment parameters are presented in Table 1. Samples after heat treatment were naturally cooled and subsequently dried at 65 °C to constant weight, then weighed (m1). The percentage of mass loss was calculated according to eqn (1):
 | (1) |
| Samples | Temperature (°C) | Time (h) |
|---|---|---|
| A | — | — |
| B | 180 | 2 |
| C | 180 | 4 |
| D | 200 | 2 |
| E | 200 | 4 |
| F | 220 | 2 |
| G | 220 | 4 |
Color measurement
Preparation of EHLWs was convenient for color measurement. Three measurements at precisely defined points on the EHLWs surface were carried out with Konica Minolta CR-10 instrument (Japan). Chromatic coordinates L*, a*, b* of the CIELAB color system were measured according to ASTM E1347.20 Color differences ΔE were calculated according to eqn (2)
 | (2) |
 ,
,  ,
,  and
and  ,
,  ,
,  are respectively the EHLWs chromatic coordinates pre- and post-heat treatment.
Spectroscopic analysis
The UV-Vis spectra of EHL samples were obtained using a UV-Vis spectrophotometer (UV-2401 PC, Japan). EHL samples were dissolved in DMF with concentration of 0.033 mg g−1, the samples were scanned for wavelengths of 200–700 nm in increments of 1 nm and middle speed.FTIR analysis
FTIR spectra were recorded using an FTIR spectrophotometer (Nicolet iS10, USA) in the absorbance mode over frequencies of 4000–400 cm−1, a KBr pellet was employed during the process. EHL was mixed with KBr in a weight ratio of approximately 1![[thin space (1/6-em)]](https://www.rsc.org/images/entities/char_2009.gif) :
:![[thin space (1/6-em)]](https://www.rsc.org/images/entities/char_2009.gif) 80. Pellets of this mixture were formed at the same pressure and same treatment time.
80. Pellets of this mixture were formed at the same pressure and same treatment time.
MS analysis
Samples were ionized using electrospray ionization (ESI) in positive ion mode. Mass spectra were recorded using a solanX 70 FT-MS instrument (Bruker Daltonics, USA) equipped with an infinity cell. The solvent for samples was dichloromethane. Prior to detection, dissolved samples were filtered through a 0.22 μm microporous membrane. For the full scan spectrum, 100 individual transients were collected and co-added to enhance the signal-to-noise ratio (S/N). The acquired mass spectra were analyzed using DataAnalysis 4.0 (Bruker). The full scan mass spectra were internally calibrated using a series of homologous compounds in the m/z range 50 through 2000.Results and discussions
Percentages of mass loss of EHLWs after heat treatment
The mass loss of wood is one of the most important features in heat treatment and is commonly referred to as an indicator of the quality of heat treatment wood.5 Mass loss ratio of EHLWs treated at different temperatures and durations are presented in Fig. 1. The mass loss ratio increased with increasing temperature and duration of heat treatment. EHLW treated at 180 °C for 2 h (sample B) has shown the smallest mass loss (2.4%), and the values rose to 3.4% and 5.0% when the temperature was increased to 200 °C and 220 °C, respectively. Sample G, treated at 220 °C for 4 h has presented largest mass loss (6.4%) followed by sample E (4.2%) and sample C (3.0%). The mass loss ratio of the groups treated for 4 h increased by 25.8% than that of the groups treated for 2 h. The results of the one-way ANOVA found that there existed significant differences between the groups heated at different temperatures and durations (P < 0.05). The results obtained from heat treatment of lignin were similar to those from wood heat treatment, which demonstrated that the temperature and duration of heat treatment are important factors that influence the mass loss of wood.5 The mass loss of EHLW was mainly due to the degradation of EHL, associates with degradation of lignin–carbohydrate complex.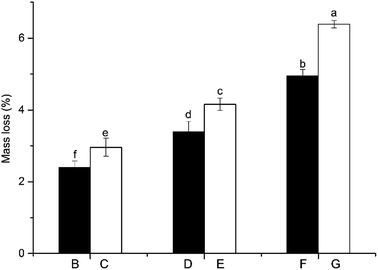 | ||
| Fig. 1 Mass loss ratio of EHLWs after heat treatment. Note: different small letters represent the significant differences between the groups (P < 0.05). | ||
Color of EHLWs
Heat treatment results in the degradation of lignin, which affects the appearance of the EHLW in the form of color changes. Overall color modulus differences (ΔE) of the EHLWs are shown in Fig. 2. The smallest values of ΔE were obtained for samples B (0.22) and C (0.27) which give a better overall color stabilization than that of EHLWs treated with higher temperatures. Higher values were obtained for samples D (0.40) and E (0.60), while sample G has shown the highest of ΔE (0.97). An increasing trend in ΔE was observed with increasing temperature and duration of heat treatment, and the results of statistical data analysis indicate significant differences among EHLWs treated at different temperatures. The EHLWs treated at 180 °C exhibited a smaller color change, revealing that transformations of the chromophoric groups of lignin did not occur frequently at these temperatures. Overall, the chromatic aberration values of all samples were small (ΔE of lignin < 1), while that of Japanese cedar wood treated at a temperature of 210 °C for 4 h was 22.6,21 it indicated the color change of wood during heat treatment was not attributable to lignin degradation. A similar conclusion was deduced in the studied of Sehlstedt-Persson,22 Sundqvist,23 and McDonald.24 They claim that the darker shade of wood after heat treatment was given by the production of colored degradation products from hemicelluloses and extractives components.2 Hemicelluloses are the first structural compounds to be affected by heat, and can degrade even at low temperatures.5 However, a number of previous studies believed degradation of lignin may be the major reason for the color change.25,26 The β-O-4 cleaved significantly during heat treatment formed free hydroxyl group, and lignin was susceptive to oxidation.27 The results of the current experiments support the conclusion that lignin is not the major cause of wood discoloration during heat treatment.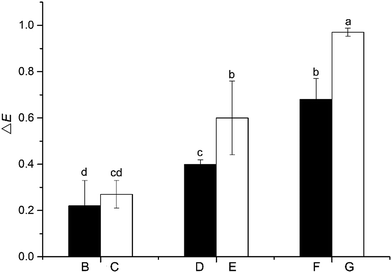 | ||
| Fig. 2 ΔE of EHLWs after heat treatment. Note: different small letters represent the significant differences between the groups (P < 0.05). | ||
UV-Vis spectroscopic analysis of EHL
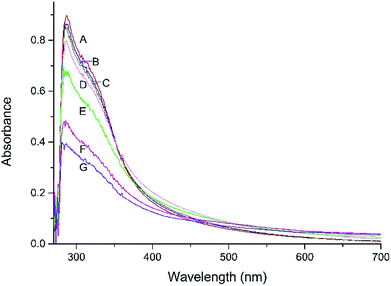
Fig. 3 shows the pre- and post-heat treatment UV-Vis spectra of the EHL samples. All the spectra exhibited low absorbance over the entire visible region, with absorption values in the 0.004–0.203 range. The absorbance of EHL increases sharply to values of 0.399–0.898 (peak value), and the absorption peak appear at approximately 287. The highest peak value of 0.898 was shown by sample A prior to heat treatment, followed by samples B (0.863) and C (0.851). The smallest absorbance peak was obtained for sample G (0.399). Furthermore, a negative correlation between the peak value and the temperature or duration of heat treatment was observed. This reveals that heat treatment resulted in the degradation of EHL, and that the cleavage of aromatic structure units had a detrimental effect on absorption of UV light. The results could also be used to explain the phenomenon the color stability of heat treated wood is better than that of wood without treatment during weathering.18,28–30 The better resistance of heat treatment wood to solar radiation can be attributed to the less attack of lignin. A part of lignin molecule structure changed during heat treatment, which caused the decline of lignin UV absorption.28Only small differences were found in the peak values among samples A–C. It illustrates that the degree of degradation of samples B and C was low when heated at a temperature of 180 °C. The higher treatment temperature showed the lower absorption in the UV region. However, the latter samples exhibited higher absorption in the visible region, especially at higher wavelengths, which also reflected the color change after heat treatment. The small change in absorption in the visible region further affirms lignin degradation is not the major course for wood discoloration during heat treatment.
Interpretation of the FTIR spectra of EHL
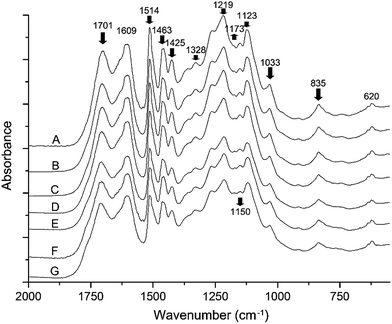
Fig. 4 illustrates the functional groups changes of EHL due to heat treatment. Overall, the FTIR analysis confirms that lignin is sensitive to heat treatment. The peaks between 800 and 1800 cm−1 represent typical lignin structure.31 A decreasing intensity is observed in the absorption peaks located at 1701 cm−1, 1514 cm−1, 1463 cm−1, 1425 cm−1, 1329 cm−1, 1033 cm−1, and 835 cm−1 with increasing temperature and duration of heat treatment. The decrease at 1701 cm−1 indicates the amount of unconjugated carbonyl groups in ketone or aldehyde groups is gradually reduced. The aromatic skeleton vibration in lignin occurs at 1514 cm−1, 1463 cm−1, and 1425 cm−1. The decline of those absorption peaks reveals the degradation of the aromatic structure.1,32 The change at 1328 cm−1 and 1119 cm−1 indicates the dissociation of the syringyl (S) unit of lignin, while changes at 835 cm−1 represents the reduction in the amount of out of plane C–H at C2 and C6 positions in the S unit, as well as in all positions of the p-hydroxy phenylpropane (H) unit.31,33 The decrease at 1150 cm−1 is characteristic of the instability of the lignin ester linkage when treated with high temperature. Most of the absorption peaks exhibit a decrease with increasing heat treatment temperature and duration. However, the peak at 1173 cm−1, which corresponds to the conjugated ester-based C![[double bond, length as m-dash]](https://www.rsc.org/images/entities/char_e001.gif) O stretching vibration and is characteristic of HGS-lignin (G: guaiacyl), showed a slight increase. This implies that the lignin underwent a partial oxidation reaction during heat treatment with the aid of water vapor. Overall, the FTIR spectra indicate obvious changes of the EHL chemical structure taking place during heat treatment, especially at 200 °C and 220 °C.
O stretching vibration and is characteristic of HGS-lignin (G: guaiacyl), showed a slight increase. This implies that the lignin underwent a partial oxidation reaction during heat treatment with the aid of water vapor. Overall, the FTIR spectra indicate obvious changes of the EHL chemical structure taking place during heat treatment, especially at 200 °C and 220 °C.
Mass spectrum analysis of EHL
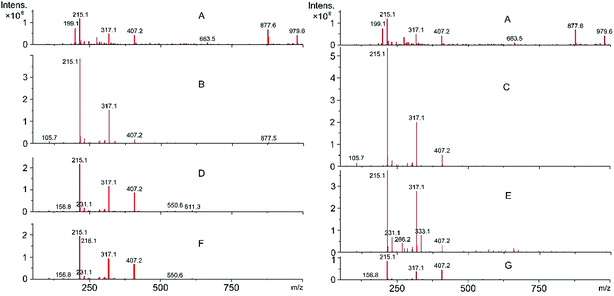
In order to further understand the behavior of lignin degradation during heat treatment, the mass-to-charge (m/z) ratios of ions created by lignin were investigated by MS. The mass spectra of lignin with and without heat treatment (Fig. 5) show a dramatic transformation of the molecular structure after heat treatment. The mass spectra of the control sample contained 200 peaks ranging from m/z 99.6–1902.1 (peaks at m/z 1010.5, 1274.3, and 1902.1 which have low intensity, are not displayed in order to better depict the other peaks). The peaks at m/z 877.6 and 979.6 of sample B show a rapid decrease, while peaks at m/z 1010.5, 1274.3, and 1902.1 completely disappear. These results can be attributed to the degradation of the macromolecular compounds, while a noticeable increase of the peaks at m/z 215.1 and 317.1 demonstrate the process by which the macromolecular compounds are pyrolyzed into lower molecular weight compounds. With the temperature rising to 200 °C, fragmentation of sample D at the m/z peaks 877.5 triggered the increase of the peak at m/z 407.2. In addition, a marked decrease of the peaks at m/z 215.1 and 317.1 were observed, while the peaks at m/z 215.1, 317.1 and 407.2 widened. Besides, one can be also find that a further decrease of the peaks at m/z 215.1, 317.1 and 407.2 of sample F, implying that smaller molecules were produced with the temperature rose to 220 °C. Those results illustrate that lignin was degrading continuously with rising temperature. Similar results are also observed in samples A, C, E, and G, which were treated at 180 °C, 200 °C, and 220 °C for 4 h. Compared with sample B, the peak at m/z 877.6 of sample C almost disappeared, while the peaks at m/z 215.1, 317.1 and 407.2 increased with the treatment duration prolonged. With continued increase of the duration of heat treatment, the peak at m/z 407.2 of sample E noticeably decreased compared with sample D at the treatment temperature of 200 °C, whereas the reverse was observed for the peaks at m/z 215.1 and 317.1. Sample G showed the smallest and broadest peaks at m/z 215.1, 317.1, and 407.2. The above results again confirm that the duration of heat treatment was a major factor determining the degree of lignin degradation. Peaks less than m/z 78 were difficult to detect, this is possibly on account of the low ionization energy of the benzene ring, which makes it difficult to degrade.34,35Conclusions
The widespread application of wood heat treatment products exhibit a good properties in dimensional stability, change equilibrium moisture content and chemicals structure, it also requires the recycling of this natural polymer from plants, which in turn necessitates detailed knowledge on the exact chemical structure and optical properties of the lignin after heat treatment wood, including the functional groups transformations of lignin during heat treatment and the anti-discoloration mechanism of lignin in heat treatment wood when exposed to solar radiation. In this study, EHL was used to investigate the effects of heat treatment temperature and duration on the structure and optical properties of lignin. Heat treatment temperature and duration are important factors that influence mass loss, color, UV absorption, and molecular structure of lignin. A positive correlation between certain properties (mass loss and color) of lignin and heat treatment temperature or duration was noticed, whereas a negative relationship was observed with regard to UV absorption. The molecular structure of lignin also changed with increasing temperature or duration of heat treatment. It was determined that the color change due to lignin is not the major cause of wood discoloration during heat treatment. The better resistance of heat treated wood to solar radiation was attributed to the less UV attack of lignin, which is a result of transformations of lignin molecular structure during heat treatment that reduces UV absorption. Heat treatment also resulted in fragmentation of the lignin molecules, accelerating the process where macromolecules were decomposed into lower-molecular weight compounds.Acknowledgements
This work was financial supported by the Science and Technology Planned Projects of Zhejiang Province (2016F50006; 2015F50054; 2014NM009).Notes and references
- M. Hakkou, M. Pétrissans, A. Zoulalian and P. Gérardin, Polym. Degrad. Stab., 2005, 89, 1–5 CrossRef CAS.
- K. Candelier, M. F. Thevenon, A. Petrissans, S. Dumarcay, P. Gerardin and M. Petrissans, Ann. For. Sci., 2016, 1–13 Search PubMed.
- Y. Yin, L. Berglund and L. Salmén, Biomacromolecules, 2010, 12, 194–202 CrossRef PubMed.
- B. Esteves, J. Graca and H. Pereira, Holzforschung, 2008, 62, 344–351 CrossRef CAS.
- B. Esteves and H. Pereira, BioResources, 2008, 4, 370–404 Search PubMed.
- M. Nuopponen, T. Vuorinen, S. Jämsä and P. Viitaniemi, J. Wood Chem. Technol., 2005, 24, 13–26 CrossRef.
- H. Wikberg and S. L. Maunu, Carbohydr. Polym., 2004, 58, 461–466 CrossRef CAS.
- M. J. Boonstra and B. Tjeerdsma, Holz Roh- Werkst., 2006, 64, 204–211 CrossRef CAS.
- A. P. Johari, S. Mohanty, S. K. Kurmvanshi and S. K. Nayak, ACS Sustainable Chem. Eng., 2016, 4, 1619–1629 CrossRef CAS.
- O. Percin, H. Peker and A. Atilgan, Wood Res., 2016, 61, 443–456 Search PubMed.
- F. Xiong, Y. Han, G. Li, T. Qin, S. Wang and F. Chu, Ind. Crops Prod., 2016, 83, 663–669 CrossRef CAS.
- M. Tortora, F. Cavalieri, P. Mosesso, F. Ciaffardini, F. Melone and C. Crestini, Biomacromolecules, 2014, 15, 1634–1643 CrossRef CAS PubMed.
- Y. Pu, S. Cao and A. J. Ragauskas, Energy Environ. Sci., 2011, 4, 3154–3166 CAS.
- B. B. Hallac, Y. Pu and A. J. Ragauskas, Energy Fuels, 2010, 24, 2723–2732 CrossRef CAS.
- M. Q. Zhu, J. L. Wen, Y. Q. Su, Q. Wei and R. C. Sun, Bioresour. Technol., 2015, 185, 378–385 CrossRef CAS PubMed.
- P. Hayoz, W. Peter and D. Rogez, Prog. Org. Coat., 2003, 48, 297–309 CrossRef CAS.
- N. Li, Y. Chen, Y. Bao, Z. Zhang, Z. Wu and Z. Chen, Appl. Surf. Sci., 2015, 332, 186–191 CrossRef CAS.
- O. Ozgenc and U. C. Yildiz, J. Mater. Civ. Eng., 2016, 28, 04016015 CrossRef.
- S. Yildiz, U. C. Yildiz and E. D. Tomak, BioResources, 2011, 6, 2504–2521 CAS.
- M. V. Cristea, B. Riedl and P. Blanchet, Prog. Org. Coat., 2010, 69, 432–441 CrossRef.
- T. H. Yang, F. R. Chang, C. J. Lin and F. C. Chang, BioResources, 2016, 11, 3947–3963 CAS.
- M. Sehlstedt-Persson, 8th International IUFRO Wood drying conference, 2003, pp. 459–464 Search PubMed.
- B. Sundqvist and T. Morén, Holz Roh- Werkst., 2002, 60, 375–376 CrossRef CAS.
- A. G. McDonald, M. Fernandez, B. Kreber and F. Laytner, Holzforschung, 2000, 54, 12–22 CrossRef CAS.
- W. Shangguan, Y. Gong, R. Zhao and H. Ren, J. Wood Sci., 2016, 62, 383–391 CrossRef CAS.
- S. Shao, G. Wen and Z. Jin, Wood Sci. Technol., 2008, 42, 439–451 CrossRef CAS.
- V. Sharratt, C. A. S. Hill and D. P. R. Kint, Polym. Degrad. Stab., 2009, 94, 1589–1594 CrossRef CAS.
- N. Ayadi, F. Lejeune, F. Charrier, B. Charrier and A. Merlin, Holz Roh- Werkst., 2003, 61, 221–226 CAS.
- E. P. J. Beckers, M. De Meijer, H. Militz and M. Stevens, J. Coat. Technol. Res., 1998, 70, 59–67 CrossRef CAS.
- D. Kocaefe, S. Poncsak and Y. Boluk, BioResources, 2008, 3, 517–537 Search PubMed.
- K. Yan, F. Liu, Q. Chen, M. Ke, X. Huang, W. Hu and H. Yu, Biotechnol. Biofuels, 2016, 9, 1 CrossRef PubMed.
- A. Cogulet, P. Blanchet and V. Landry, J. Photochem. Photobiol., B, 2016, 158, 184–191 CrossRef CAS PubMed.
- K. Song, H. Zhang, Q. Wu, Z. Zhang, C. Zhou, Q. Zhang and T. Lei, J. Therm. Anal. Calorim., 2015, 119, 27–35 CrossRef CAS.
- Y. Qi, R. Hempelmann and D. A. Volmer, Anal. Bioanal. Chem., 2016, 408, 8203–8210 CrossRef CAS PubMed.
- T. He, Y. Zhang, Y. Zhu, W. Wen, Y. Pan, J. Wu and J. Wu, Energy Fuels, 2016, 30, 2204–2208 CrossRef CAS.
Footnote |
| † Electronic supplementary information (ESI) available. See DOI: 10.1039/c7ra02005h |
| This journal is © The Royal Society of Chemistry 2017 |

