
 Open Access Article
 This Open Access Article is licensed under a
 Creative Commons Attribution 3.0 Unported Licence
Construction of biomimetic long-circulation delivery platform encapsulated by zwitterionic polymers for enhanced penetration of blood–brain barrier†
Nan Wang ,
Xin Jin* and
Xinyuan Zhu*
,
Xin Jin* and
Xinyuan Zhu*
School of Chemistry and Chemical Engineering, State Key Laboratory of Metal Matrix Composites, Shanghai Jiao Tong University, 800 Dongchuan Road, Shanghai 200240, P. R. China. E-mail: jxcindy@sjtu.edu.cn; xyzhu@sjtu.edu.cn
First published on 11th April 2017
Abstract
The effective treatments for central nervous system (CNS) diseases are impeded mostly by the existence of the blood–brain barrier (BBB). The accumulation of therapeutic drugs inside the brain is far from the therapy threshold, which is closely related to the transient circulation time of drugs and their carriers. Herein, a core–shell protein-based long-circulation delivery platform was constructed. Through in situ free radical polymerization, a zwitterionic polymer poly(2-methacryloyloxyethyl phosphorylcholine) (PMPC) was modified on the surface to prolong the circulation lifetime with a biomimetic structure induced by a phosphorylcholine (PC) head-group similar to the lipids in the outer membrane of living cells. A cell-penetrating peptide, HIV-1 trans-activating transcriptor (TAT) was conjugated on the surface of the protein-based nanoparticles, endowing the delivery platform with BBB-crossing ability. The BBB-permeability of the nanoparticles was investigated both in vitro and in vivo. Encapsulated with zwitterionic polymer PMPC, the nanoparticles showed a long circulation lifetime due to strong resistance to nonspecific adsorption and provided a better chance for BBB penetration. The delivery platform had enhanced permeability for BBB and a longer retention time inside the brain in a healthy mouse model. Overall, the surface modification with zwitterionic polymer PMPC and cell-penetrating peptide TAT changes the circulation modality of the nanoparticles in vivo, and provides a promising pathway for BBB crossing as a potential drug delivery platform for CNS related disease therapy.
Introduction
Central nervous system (CNS) related diseases have an increasing occurrence now due to the aging of the population. However, effective therapies are greatly impeded by the strictly selective permeability of the blood–brain barrier (BBB).1–3 This high selectivity of the BBB results from the tight junctions (TJs) between endothelial cells in CNS capillaries,4 and the existence of P-glycoprotein (P-gp) on the cell membrane of brain capillaries which can rapidly pump the intrusive therapeutic agents out of the brain and back to the blood circulation.5 These specific features make it rather difficult for CNS therapeutic agents to reach the diseased brain sections or remain there for sufficient time. In recent years, various therapeutic BBB carriers have been developed for CNS diseases,6 such as chemical delivery systems,7,8 carrier-mediated transports,9–11 molecular Trojan horses,12–15 and colloidal carriers.16,17 However, the therapeutic efficacy of these delivery systems is barely satisfactory from expectation, resulting from their limited penetration and retention ability. Therefore, the drug concentration in the diseased sections is much lower than the threshold for therapy. To address these problems, receptor-mediated BBB delivery systems have been considered as a powerful strategy to promote BBB penetration efficacy. Many researchers have focused on searching for specific receptors which are over-expressed on the BBB cell membrane to gain access to the brain with the required concentration for therapy. Various systems have been developed based on this assumption, including receptors for transferrin,18 insulin,19 diphtheria toxin,20,21 and nicotinic acetylcholine.22–24 However, the BBB penetration efficiency is still not satisfactory due to factors such as the usually saturated binding sites under normal conditions in vivo.4Learning from successful strategies for the treatment of tumors in other parts of the body,25,26 a prolonged circulation time of the delivery system is always able to enhance tumor targeting and accumulation. This seems to indicate that the circulation time of the delivery system may play a key role in BBB penetration.27–29 To one's surprise, the importance of the in vivo circulation ability of the BBB carriers has long been ignored in the treatment of CNS diseases. It is well known that PEGylation is the most widely used strategy to prolong the circulation lifetime of various delivery systems. Nevertheless, due to the progression of the immune response to the polyethylene glycol (PEG) shell and the significantly accelerated blood clearance, the therapeutic efficacy of PEGylated nanocarriers for CNS diseases is greatly restricted.30–35 In this respect, a novel delivery system with lower immune response and longer circulation time is urgently needed. Inspired by the excellent stability and long circulation ability of cells under blood circulation and normal physiological conditions, the composition of the outer bilayer membrane of living cells arouses the interest of many scientists. The biomembrane of cells is mainly constructed of natural phospholipid molecules. Therefore, it is reasonable to deduce that a material which can mimic this special structure will meet the requirements mentioned above to the greatest extent. Owing to its similar structure to the head-group of phosphorylcholine (PC) lipids in the outer surface of living cells, the zwitterionic polymer poly(2-methacryloyloxyethyl phosphorylcholine) (PMPC) shows excellent hydrophilicity, biocompatibility, stability and bioavailability, which have even been confirmed clinically.36–39 PMPC encapsulation empowers the nanocarriers with a biomembrane-like structure, providing a biocompatible chemical structure which is the basis for an ability to circulate for a long time in the blood.40–42 Jiang and co-workers have demonstrated that PMPC shows a high non-fouling property of excellent resistance to nonspecific protein adsorption, which can reduce its quick recognition by the immune system and delay blood clearance.42–46 Consequently, coating with PMPC will endow the BBB delivery shuttles with a stealth property and therefore much longer circulation-lifetime in vivo with a better chance to contact with and penetrate through the BBB cell membrane.
As a proof of the concept whether circulation time is a key factor in BBB penetration, we report here for the first time a facile approach of constructing a protein-based biomimetic nanoplatform encapsulated with zwitterionic polymer PMPC and conjugated with HIV-1 trans-activating transcriptor (TAT) peptides to penetrate the BBB. The advantages of this delivery platform can be listed as follows: (1) encapsulation with PMPC endows the delivery shuttle with a stealth property and therefore much longer circulation-lifetime in vivo with little or even no immune response;47–56 (2) as the mechanism of TAT entering the CNS is the temporary disruption of the BBB mainly by decreasing the expression of and altering the distribution of TJs proteins,57–67 the delivery system conjugated with TAT can remain inside the brain parenchyma with reduced pumping back to blood circulation; (3) the model protein core can be replaced by any type of active protein, empowering the delivery system with additional therapeutic effects for different CNS diseases.
Experimental
Materials
Bovine serum albumin (BSA), 1-(3-dimethylaminopropyl)-3-ethylcarbodiimide hydrochloride (EDC), dimethyl sulfoxide (DMSO), CHCl3, HCl, trimethylamine and NaHCO3 were purchased from Aladdin Reagent Database Inc. (Shanghai, China). N-Hydroxy-succinimide ester (NAS), N,N′-methylene bisacrylamide (BIS), ammonium persulfate (APS), acrylic acid (AA), 2-methacryloyloxyethyl phosphorylcholine (MPC), N,N,N′,N′-tetramethylethylenediamine (TEMED) and N-hydroxysuccinimide (NHS) were all purchased from Sigma-Aldrich Co. LLC. (USA). TAT (GRKKRRQRRRPP-CH3O) was purchased from and synthesized by Shanghai Science Peptide Biological Technology CO., LTD. (Shanghai, China).Synthesis of TAT-modified BSA protein (TBSA)
EDC (4.3 mg) and NHS (2.3 mg) were added to BSA solution (0.5 mg mL−1, 5.0 mL) and stirred for 3 h. Then, 302.0 μL of TAT (1.0 mg mL−1 in DMSO) was added to this mixture and stirred for another 3 h. The solution was dialyzed (MWCO: 7000 Da) against 20 mM PB (pH = 7.4) for 48 h to give the TBSA nanoparticles.Synthesis of acryloylated BSA protein (aBSA)
BSA protein was dissolved in 20 mM pH 8.5 boric acid buffer (BB) solution to prepare a BSA solution with a concentration of 1.0 mg mL−1. 31.0 μL of 1% (w/w) DMSO solution of NAS was introduced to 13.3 mL of the above BSA solution. The mixture was stirred for 2 h at room temperature, and then dialyzed (MWCO: 7000 Da) against 20 mM phosphate buffer PB (pH 7.4) solution for 48 h (fresh PB solution was replaced every 6 h) to give an aBSA solution.Preparation of zwitterionic polymer capsuled protein-based nanogel (nBSA)
The typical procedure for the preparation of zwitterionic polymer capsuled protein-based nanogel via in situ free radical polymerization directly on the surface of aBSA is described below: an aqueous solution of 118.1 mg of MPC, 15.0 mg of BIS, 29.4 μL of TEMED and 5.0 mL of the above 0.5 mg mL−1 aBSA solution was added to a flask. The mixture was bubbled through nitrogen for 0.5 h to remove residual oxygen at room temperature. Then 11.0 mg of APS was rapidly added and the polymerization was allowed to proceed for an additional 3 h in a nitrogen atmosphere at room temperature. Finally, dialysis (MWCO: 100 kDa) was used to remove monomers and initiators in 20 mM PB solution (pH 7.4) for 48 h (fresh PB solution was replaced every 6 h) to give an nBSA solution.Bioconjugation of TAT with zwitterionic nanogel (TAT–nBSA)
The bioconjugation of cell penetrating peptide TAT with zwitterionic and protein-based nanogel was similar to that of BSA nanogel by modifying the protein-based nanogel using a conjugating technique. An aqueous solution of 118.1 mg of MPC, 1.4 μL of AA, 15.0 mg of BIS, 29.4 μL of TEMED and 5.0 mL of the above 0.5 mg mL−1 aBSA solution was added to a flask. The mixture was bubbled through nitrogen for 0.5 h to remove residual oxygen at room temperature. Then 11.0 mg of APS was rapidly added and the polymerization was allowed to proceed for an additional 3 h in a nitrogen atmosphere at room temperature. Finally, dialysis (MWCO: 100 kDa) was used to remove monomers and initiators in 20 mM PB solution (pH 7.4) for 48 h to give the nanogel acrylic nBSA. After that, EDC (4.3 mg) and NHS (2.3 mg) were added to the BSA-based nanogel solution (0.5 mg mL−1, 5.0 mL) and stirred for 3 h. Finally, different amounts of TAT (1.0 mg mL−1 in DMSO) were added to this mixture and stirred for another 3 h (60.4 μL of TAT for TAT-1-nBSA, 302.0 μL of TAT for TAT-5-nBSA and 604.0 μL of TAT for TAT-10-nBSA, where the number stands for the molar ratio of TAT to BSA). The solution was dialyzed (MWCO: 100 kDa) against 20 mM PB (pH = 7.4) for 48 h to give the final nanoparticles.Preparation of FITC labeled TAT
0.5 mg of FITC was dissolved in 0.5 mL of 20 mM PB solution (pH 8.5). 0.5 mg of TAT was dissolved in 0.5 mL of DMSO. Then FITC solution was added dropwise to the TAT solution, stirred for 8 h at 4 °C and kept in a dark place. Subsequently the solution was dialyzed against 20 mM PB solution (pH 7.4) for 24 h (MWCO: 500 Da) and fresh PB solution was exchanged every 6 h. FITC labeled TAT was only used for experiments in Fig. 2b and c.Preparation of FITC labeled protein-based nanogel
0.5 mg of FITC was dissolved in 0.5 mL of DMSO. Then the solution was added dropwise to 5.0 mL of BSA solution (in pH 8.5 BB solution, concentration of BSA was 0.5 mg mL−1) stirred for 8 h at 4 °C in a dark place. Subsequently the solution was dialyzed against 20 mM PB solution (pH 7.4) for 24 h (MWCO: 1000 Da) and fresh PB solution was exchanged every 6 h. All FITC labeled BSA-based nanogels were obtained from modifications based on this FITC-labeled BSA to ensure the same amount of FITC in each sample.Preparation of Cy5.5 labeled protein-based nanogel
0.4 mg of Cy5.5 was dissolved in 0.5 mL of DMSO. Then the solution was added dropwise to 5.0 mL of BSA solution (concentration of BSA was 0.5 mg mL−1) and stirred for 1 h at room temperature in a dark place. Subsequently the solution was dialyzed against 20 mM PB solution (pH 7.4) for 12 h (MWCO: 1000 Da) and fresh PB solution was exchanged every 4 h. To determine the content of Cy5.5 in the BSA solution, the solution was lyophilized and then redissolved in DMSO. The amount of Cy5.5 in the nanogel was determined by measuring the absorbance at 680 nm with a UV-Vis spectrophotometer. All the Cy5.5 labelled BSA-based nanogels were obtained from modifications based on this Cy5.5-labeled BSA to ensure the same amount of Cy5.5 in each sample.Characterizations
![[thin space (1/6-em)]](https://www.rsc.org/images/entities/char_2009.gif) 000 nanoparticles studied) to confirm the attachment of TAT onto the system.
000 nanoparticles studied) to confirm the attachment of TAT onto the system.Cell culture and animals
L929 (mouse fibroblast cells), C6 (mouse glioma cells) were purchased from the Shanghai Institute for Biological Sciences, Chinese Academy of Sciences Institute of Cell Resource Center (Shanghai, China). L929 cells were cultured using a medium of DMEM-high glucose with 10% FBS and 1% penicillin-streptomycin. C6 cells were cultured in a medium of DMEM/F12k (1:1) with 10% FBS and 1% penicillin-streptomycin. Rat brain-derived microvascular endothelial cells (RBMEC), astrocytes (RBAC) and pericytes (RBPC) and corresponding complete medium were all purchased from CHI Scientific, Inc., Jiangyin, China. Cells were cultured at 37 °C with 5% CO2.
KM mice and BalB/C nude mice were purchased from Shanghai SLAC Laboratory Animal CO. LTD. (Shanghai, China). Animals were placed in a particular pathogen-free animal house with free access to food and water. All animal experiments were conducted in agreement with the guidelines of the Institutional Animal Care and Use Committee (IACUC) of Shanghai Jiao Tong University and the IACUC of Shanghai Jiao Tong University and were conducted in agreement with the guidelines of the Association for Assessment and Accreditation of Laboratory Animal Care (AAALAC). The animal experiments protocol was approved by the Animal Experimentation Ethics Committee at Shanghai Jiao Tong University School of Pharmacy.
In vitro cytotoxicity assay
The cytotoxicity of the delivery system was assessed using MTT assay. L929 cells were plated in a 96-well plate at a cell density of 1.0 × 10⁴ cells per well and incubated for 24 h at 37 °C and 5% CO2 before they were treated with different concentrations of TBSA, nBSA and TAT–nBSA, respectively. All samples were incubated with the cells for 24 h. Before the MTT assay, each well was refilled with fresh medium. For the MTT assay, 20.0 μL of 5.0 mg mL−1 MTT (Beyotime Institute of Biotechnology, Shanghai, China) solution was added to each well and incubated for 4 h at 37 °C. After dissolving the formed fomazan with 150.0 μL of DMSO in each well, the plates were shaken for 5 min with a shaker. The absorbance (OD value) was measured at 490 nm with a microplate reader. The cytotoxicity was measured by comparing it with the absorbance at each concentration and the control group.Cell internalization of delivery system
The cell internalization assay was assessed using a flow cytometer (Accuri C6, Becton, Dickinson and Company, Shanghai, China). L929 and C6 cells were plated in 6-well plates at a cell density of 2 × 10⁵ cells per well and incubated for 24 h at 37 °C and 5% CO2 before they were treated with 62.5 μg mL−1 FITC-labeled TBAS, nBSA and TAT–nBSA, respectively. After treatment for 0.25, 0.5, 1, 2 and 3 h, respectively, the cells were washed with PBS three times and digested with 0.05% trypsin EDTA (Gibco, Life Technologies, Shanghai, China). After configuration at 104 rpm for 5 min, the cells were resuspended with 500.0 μL of fresh medium (without FBS). The control group was analyzed first by flow cytometer to draw the gate and all the other tested groups were collected and recorded with a limit of P1 = 10 K in the gate. The fluorescence signal of the labeled FITC was collected in the first channel named FL1. All other groups were collected in the same way as the control group.For in vitro imaging, C6 cells were seeded on 6-well plates at a density of 1 × 10⁵ cells per well with a cover glass on the bottom. After 24 h, 62.5 μg mL−1 FITC-labeled TBAS, nBSA and TAT–nBSA were incubated with cells for 0.25, 0.5, 1, 1.5, 2 and 3 h, respectively, at 37 °C. To remove the free conjugates, the cells were washed three times for 5 min with PBS and fixed in 3.7% formaldehyde solution (1.0 mL per well) for 30 min. The nuclear dye DAPI was used to stain the nuclei in the experiment. Images of cells were acquired using a Zeiss LSM 5 Pascal Confocal laser scanning microscope (Carl Zeiss AG, Oberkochen, Germany) imaging system.
In vitro BBB model-based assay
The in vitro BBB model was established using a primary co-culture with RBMEC, RBAC and RBPC, as described by Deli et al. A collagen-coated 0.4 μm PTFE membrane of the transwell inserts (12 well, Corning Life Sciences, MA, USA) was used. RBPC were seeded on the bottom side of the inserts at a density of 1.5 × 10⁴ cells cm−2 and RBAC were seeded on the bottom of the plate at the same density on day 1. The cells were allowed to undergo strong adhesion overnight. Then RBMEC were seeded on the upper side of the insert-chamber of the 12-well culture plates, and RBAC were seeded on the bottom of this culture plate, with a density of 1.5 × 10⁵ cells cm−2 on day 0. From day 1, the BBB models were maintained in RBMEC medium, supplemented with 500.0 nM hydrocortisone. The media was changed every other day and the in vitro BBB models were put into use from day 4. When trans-epithelial electric resistance (TEER) reached 250.0 Ω cm2 by subtraction of the resistance of an insert without cells, this showed that the in vitro BBB model was ready for the permeability assay. TEER was recorded using an Autolab PGSTAT302N (Metrohm, Switzerland) electrochemical test system and calculated using equation (eqn (1)):| TEER = (TEERfilter with cells − TEERfilter without cells) × A | (1) |
:100 dilution. As secondary antibodies FITC conjugated goat anti-rabbit IgG (from CHI Scientific, Inc., Jiangyin, China) were used in a dilution 1:1000. A Zeiss LSM 5 Pascal confocal microscope (Carl Zeiss AG, Oberkochen, Germany) was used to examine the staining.
Cells grown on the membrane were fixed with 2.5% glutaraldehyde for 30 min at 4 °C. After washing with 0.1 M PBS three times, the membranes of the culture inserts with the cells on the two sides were removed from their support and placed into a 24-well chamber slide and were postfixed in 1% OsO4 for 1 h. Following washing with 0.1 M PBS, the cells on the membrane were gradient dehydrated using ethanol, block-stained with resin in 99% acetone (1:1) for 1 h and embedded in 100% resin. A Leica UC6 ultramicrotome (Leica Microsystems, Milton Keynes, UK) was used to give ultrathin sections cut perpendicularly and a 120 kV biology transmission electron microscope (Tecnai G2 spirit Biotwin, FEI, USA) was used to examine the ultrathin membranes.
For the permeability assay, 0.5 mg mL−1 FITC labeled TBSA, nBSA and TAT–nBSA were added to the upper chamber of the transwells to yield a final concentration of 62.5 μg mL−1. At 20, 40 and 60 min post-treatment, inserts were moved to new well where fresh PBS was contained. The concentrations of transported nanoparticles were measured by flow cytometry and analyzed using the standard curve method. Transport was expressed as microliters of donor (luminal) compartment volume from which the tracer was completely cleared. The permeability coefficients (Pe, cm s−1) for the nanoparticles were calculated as previously described.4,70 Cleared volume was calculated from the concentration (C) of the nanoparticles in the basolateral side (BL) and apical side (AP) compartments and the volume (V) of the BL compartment by the following equation (eqn (2)):
| Cleared volume (μL) = (CBL × VBL)/CAP | (2) |
The average cleared volume was plotted versus time, and the permeability multiplied by the surface area product value for the endothelial monolayer (PSe) was calculated by the following formula (eqn (3)):
| 1/PSe = 1/PStotal − 1/PSinsert | (3) |
PSe divided by the surface area generated the endothelial permeability coefficient (Pe, in 10−6 cm s−1).
In vivo imaging studies
Whole-body in vivo biodistribution and brain accumulation in healthy Balb/C nude mice was examined using an eXplore Optix MX animal optical molecular imaging system (General Electric Company, USA) at 580 nm excitation and 692 nm emission wavelengths. Each mouse was injected in the tail vein with 200.0 μL per mouse of Cy5.5 labeled 0.5 mg mL−1 TBSA, nBSA and TAT–nBSA, respectively. Then the mice were given general anesthesia with glutaraldehyde (2%). At time points after injection of 0.5, 1, 2, 3, 4, 5, 6, 24, 48 and 72 h, the mice were fixed with tapes and pictures taken from the back.In vivo circulation time study
The in vivo circulation times of TBSA, nBSA and TAT–nBSA nanoparticles were investigated in healthy KM mice (∼40 g). The FITC-labeled TBSA, nBSA and TAT–nBSA nanoparticles were injected into the tail vein intravenously at a dose of 3.0 mg kg−1 (concentration of BSA) with three mice in each group. Time points selected for the nanoparticles were 0, 2, 6, 10, 24, 48, and 72 h post-injection. At each time point, mice were sacrificed and blood samples were collected in coagulating tubes to give serum. The samples were stored at 4 °C until analysis. The serum of each sample was analyzed using UV-Vis. The absorbance of each sample at 388 nm was recorded. The residual content in plasma at each time point was calculated as follows:| Residual content (%) = Abstime point/Abs0 h × 100 |
Biodistribution in tissues
Healthy 5–6 week male BalB/C mice, five mice for each group, were injected in the tail vein with 200.0 μL per mouse of FITC labeled 0.5 mg mL−1 TBSA, nBSA and TAT–nBSA. Mice treated with the same amount of saline were used as a blank control. The mice for the biodistribution test were sacrificed by cervical dislocation after bloodletting from the retinal vein plexus 2 h and 24 h post-injection. The blood was collected in pro-coagulation tubes to get the serum. The brain tissues, hearts, livers, spleens, lungs and kidneys of each mouse were separated, weighed and washed three times with ice-cold PBS. The tissues were ultrasonically decomposed by an Ultrasonic Processor (Scientz-IID, Ningbo Scientz Biotechnology CO., LTD, Ningbo, China) at a concentration of 100.0 mg weight tissue per milliliter of PBS. After centrifugation, the supernatant was collected and the fluorescence intensity (FI) of each sample was tested by a fluorescence spectrophotometer. The fluorescence intensity of each experimental sample was corrected by subtracting the fluorescence intensity value of the blank control. The final results were expressed as the percentage of FI of each tissue to the summary of all the organs of each mouse.Fluorescence microscopic examination of traversing the BBB
5–6 week healthy male BalB/C mice, five mice for each group, were injected in the tail vein with 200.0 μL per mouse of FITC labeled 0.5 mg mL−1 TBSA, nBSA and TAT–nBSA. The mice for the fluorescence intensity test were sacrificed by cervical dislocation at 1, 3, 9, 24, 48 and 72 h after i.p. injection, respectively. Brain tissues of each mouse were separated, weighed and washed once with PBS. The brains were ultrasonically decomposed at a concentration of 100.0 mg weight tissue per milliliter of PBS. After centrifugation, the fluorescence intensity of each collected supernatant was tested by a fluorescence spectrophotometer.To investigate nanoparticle accumulation inside the brain tissues, FITC-labeled nanoparticles (200.0 μL injection volume; 0.5 mg mL−1 nanoparticles in solution) were injected into the tail veins of 5–6 week healthy male BalB/C mice. 1, 2 and 24 h post treatment, the mice were sacrificed by cervical dislocation and their brains were separated and collected. The brain slices were taken by a freezing microtome section, 10 μm in thickness, and every 20th slice was kept (Cryotome E, Thermo Fisher Scientific, USA). The air-dried samples were imaged using a Zeiss LSM 5 Pascal Confocal laser scanning microscope (Carl Zeiss AG, Oberkochen, Germany). Pictures were taken from the lower left part of each slice (Ex./Em. = 488/518 nm).
To further confirm the intracerebral location of the nanoparticles and the relationship with the blood vessels, FITC-labeled nanoparticles (200.0 μL injection volume; 0.5 mg mL−1 nanoparticles in solution) were injected into the tail vein of 5–6 week healthy male BalB/C mice, 2 in each group. 2 h post treatment, the mice were sacrificed by cervical dislocation and their brains were separated and immersed in 4% paraformaldehyde overnight. The brain tissues were washed with PBS 3 times, each for 30 min, and immersed in 20% sucrose solution overnight and kept at 4 °C. The brain slices were taken by a freezing microtome section, 10.0 μm in thickness, and every 20th slice was kept (Cryotome E, Thermo Fisher Scientific, USA). The air-dried slices were fixed with cold acetone for 10 min and washed with PBS 3 times, 5 min each time. EDTA antigen repair buffer (pH = 8.0) was used to repair the slices within a microwave for 10 min. After air-drying, the slices were washed with PBS 3 times, 5 min each time. After blocking with 3% BSA in PBS for 30 min at room temperature, the slices were incubated with an antibody against PECAM-1 (CD31) (BD Biosciences) overnight at 4 °C. Cy-3 conjugated secondary antibody (Invitrogen Carlsbad, CA) was applied for 1 h at room temperature, together with DAPI. Samples were analyzed with a fluorescence microscope (Nikon Eclipse TI-SR, Japan).
Statistical analysis
The results were analyzed using Tukey's honest significant difference test for multiple comparisons followed by John Wilder Tukey's test to identify significant differences between groups. The family-wise significance and confidence level was p < 0.05. All results were expressed as means ± standard error of mean (SEM).Results and discussion
In this study, core–shell protein-based nanocarriers with long circulation ability (Fig. 1) have been developed via three typical steps according to our previous procedures.68,69 Bovine serum albumin (BSA) was chosen as the single-sized model protein core to guarantee an ultra-small size and a uniform size distribution of the nanoparticles. Then the PMPC shell could ensure a long delivery system lifetime in vivo and a biomembrane-like structure. The existence of a PMPC outer layer on the surface of MPC-modified BSA (nBSA) was confirmed by 31P nuclear magnetic resonance spectroscopy (31P NMR). As shown in Fig. 2a, the clean peak of MPC is at 0.57 ppm and native BSA shows no signal. The spectrum of nBSA shows peaks at 0.40 ppm, which represent the successful attachment of MPC onto the BSA surface. Meanwhile, to provide carboxyl groups for the conjugation of TAT, acrylic acid (AA) was introduced. As shown in Fig. 2f, the zeta potential of nBSA is −4.49 mV. After the introduction of AA, this decreases to −9.55 mV in acrylic nBSA. With the conjugation of TAT peptide onto the surface, the transport ability as well as the concentration and retention time of the nanoparticles inside brain will be extremely improved. To confirm the attachment of TAT peptides on the surface of the delivery platform (TAT–nBSA), TAT was labeled with FITC and the fluorescence signal of the nanoparticles was collected and analyzed. Compared with non-TAT-modified nBSA (Fig. 2b), TAT-modified TAT–nBSA nanoparticles show an extra FITC fluorescence signal (Fig. 2c), from which the attachment of TAT peptides on the surface of the delivery system can be confirmed.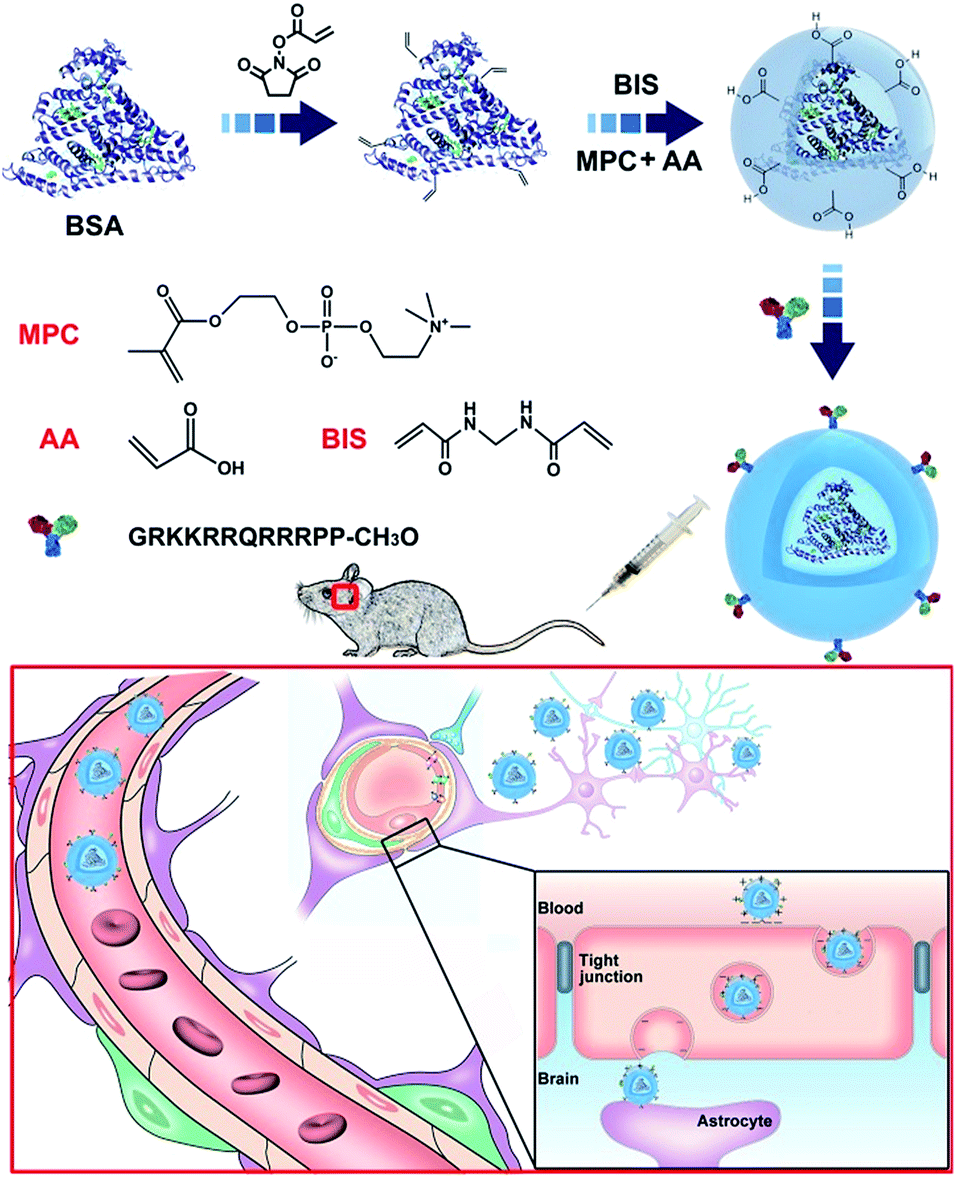 | ||
| Fig. 1 Synthesis of the TAT–nBSA nanoparticles with zwitterionic polymer encapsulation for prolonged retention in the brain. | ||
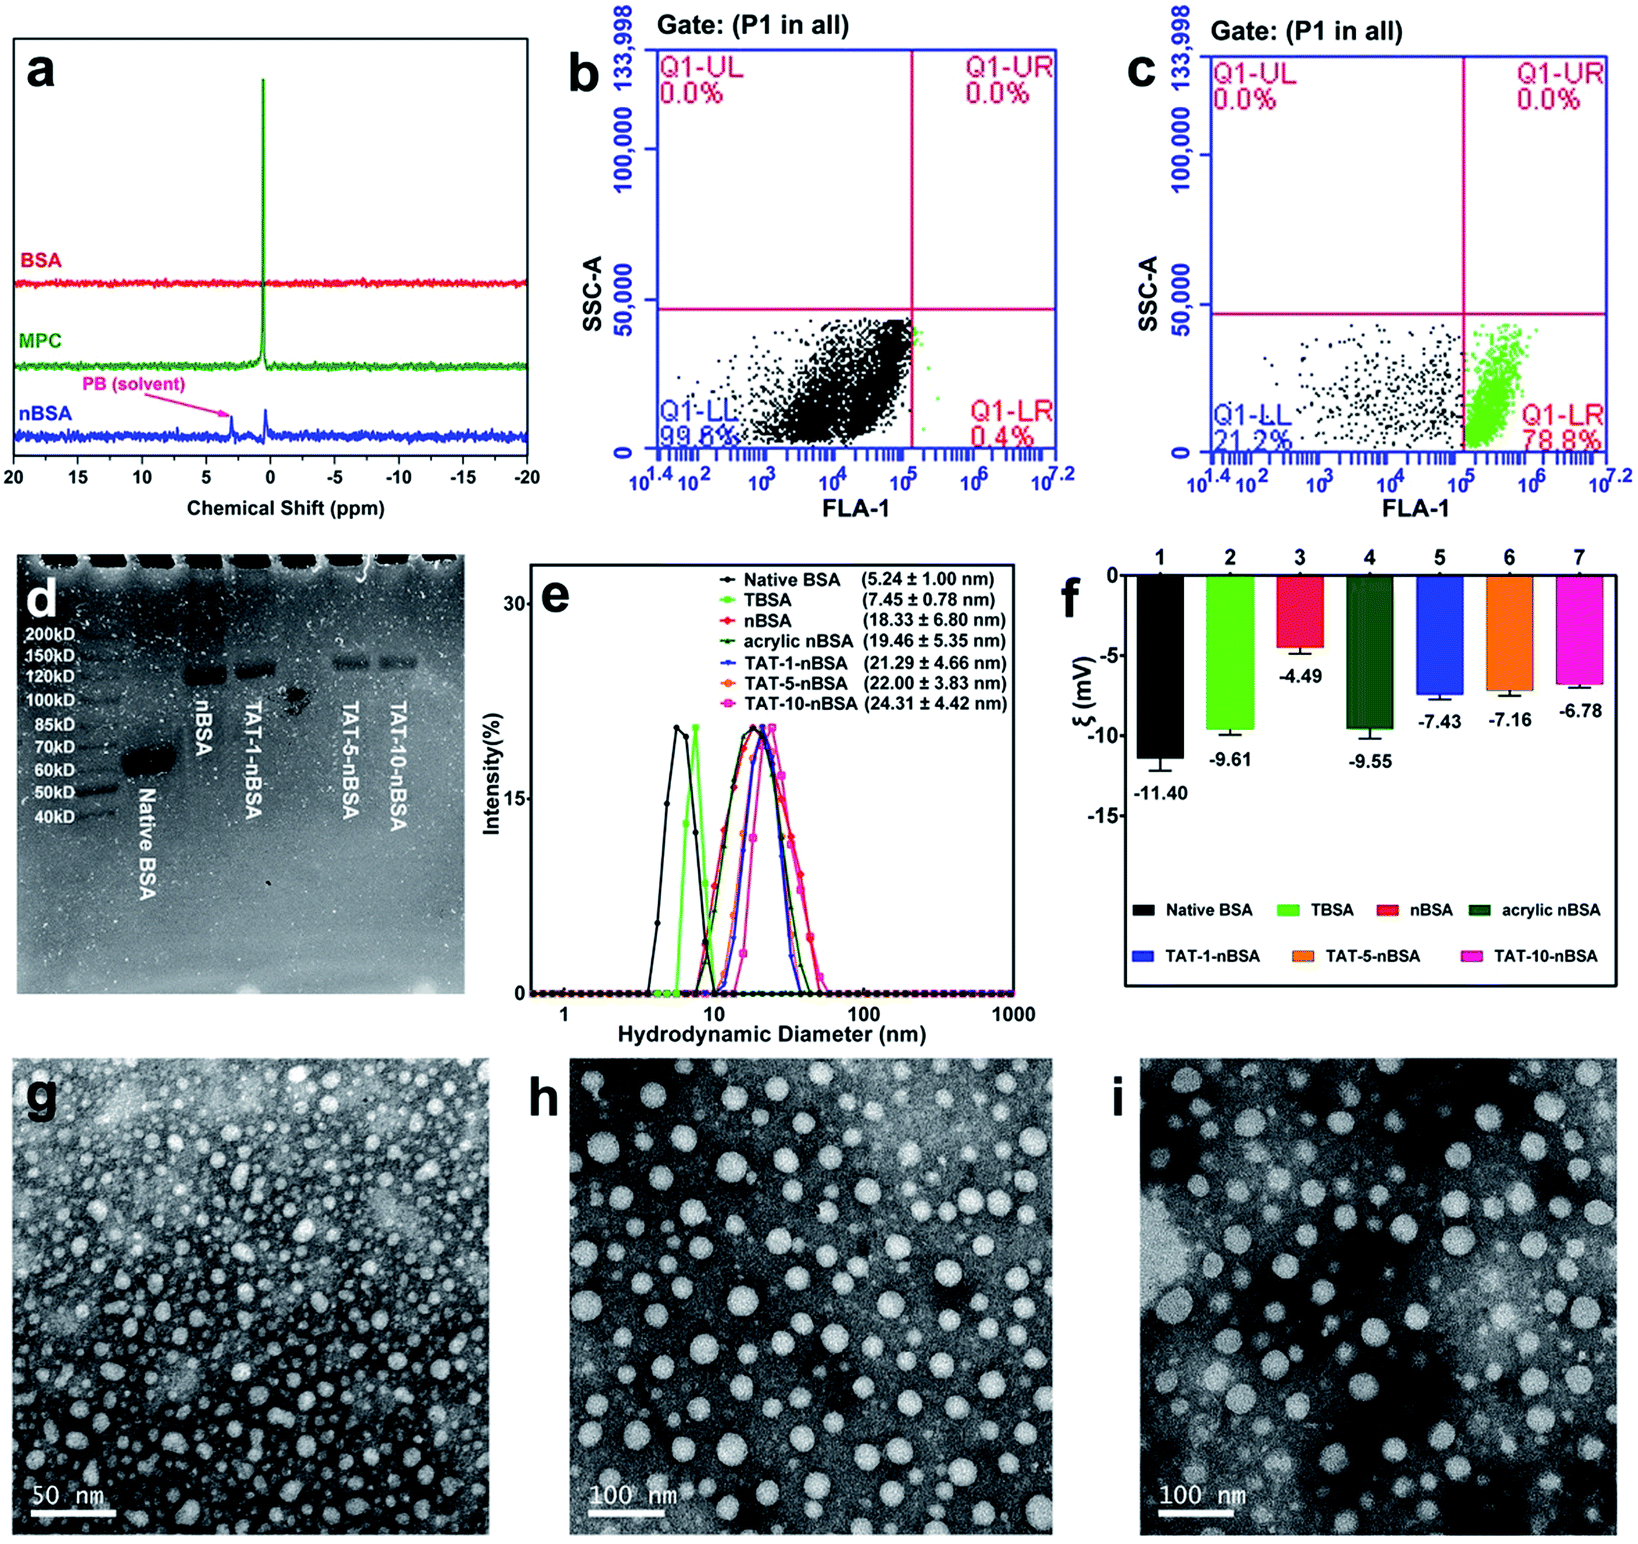 | ||
| Fig. 2 Characterization of BBB-crossing delivery system. (a) 31P NMR of phosphate buffer (PB, 20 mM, pH 7.4), MPC monomer, nBSA nanoparticles (0.5 mg mL−1 in PB), BSA (0.5 mg mL−1 in PB) in 50% H2O/50% D2O. Flow cytometry of the nanoparticles, signal of FITC was collected from FL1 channel, 100000 particles were recorded and analyzed (b, c). Acrylic nBSA (b), and FITC-labeled TAT–nBSA (c). (d) SDS-PAGE of native BSA, nBSA, TAT-1-nBSA, TAT-5-nBSA and TAT-10-nBSA nanoparticles. (e) The hydrodynamic sizes of native BSA, TBSA, nBSA, acrylic nBSA, TAT-1-nBSA, TAT-5-nBSA and TAT-10-nBSA nanoparticles. (f) Zeta potential of native BSA, TBSA, nBSA, acrylic nBSA, TAT-1-nBSA, TAT-5-nBSA and TAT-10-nBSA nanoparticles. The TEM images TBSA (g), nBSA (h), and TAT-1-nBSA (i) nanoparticles. | ||
With different amounts of TAT conjugated on the surface, a series of nanoparticles were obtained (TAT-1-nBSA, TAT-5-nBSA and TAT-10-nBSA, where the number stands for the molar ratio of TAT to BSA). The molecular weight (MW) of the resulting delivery platforms was characterized by SDS-PAGE (Fig. 2d). Native BSA shows an MW around 65 kD. After surface modification, the MW of nBSA and TAT–nBSA increases to around 120 kD. With several modification steps, the particle size and surface property were also changed. With the help of dynamic light scattering (DLS) and a transmission electron microscope (TEM), the size and morphology parameters of the BSA-based nanoparticles were recorded (Fig. S1†). As shown in Fig. 2e and f, TBSA, nBSA, acrylic nBSA and TAT–nBSA show differences in size but are similar in zeta potential, close to electrical neutrality. The sizes of the nanoparticles increase from 5.24 nm to around 22.00 nm after modification, and the zeta potentials of TAT–nBSA are around −7 mV (Table 1). The TEM images in Fig. 2g–i show that TBSA, nBSA and TAT-1-nBSA exhibit uniform spherical nanoparticles and well-defined size distributions, which correspond to the results of DLS observation very well. No significant morphological changes can be observed after the surface modifications, as evidenced by TEM imaging.
| Systems | MPC | AA | TAT | TAT/BSA (n/n) | d (nm) | ξ (mV) | MW (kD) |
|---|---|---|---|---|---|---|---|
| a Diameters (d) and zeta potentials (ξ) were all measured by dynamic light scattering (DLS). The dispersed phase is 20 mM phosphate buffer, pH = 7.4. MW stands for molecular weight obtained from SDS-PAGE. | |||||||
| Native BSA | No | No | No | 0 | 5.24 ± 1.00 | −11.40 | 65 |
| TBSA | No | No | Yes | 5/1 | 7.45 ± 0.78 | −9.61 | 65 |
| nBSA | Yes | No | No | 0 | 18.33 ± 6.80 | −4.49 | 120 |
| Acrylic nBSA | Yes | Yes | No | 0 | 19.46 ± 5.35 | −9.55 | 120 |
| TAT-1-nBSA | Yes | Yes | Yes | 1/1 | 21.29 ± 4.66 | −7.43 | 125 |
| TAT-5-nBSA | Yes | Yes | Yes | 5/1 | 22.00 ± 3.83 | −7.16 | 125 |
| TAT-10-nBSA | Yes | Yes | Yes | 10/1 | 24.31 ± 4.42 | −6.78 | 125 |
The biocompatibility of the materials is important for the delivery system. Here we used MTT to examine the cytotoxicity of the nanoparticles. As shown in Fig. S2a,† after the incubation of L929 cells with TBSA, nBSA, TAT-1-nBSA, TAT-5-nBSA and TAT-10-nBSA for 24 h, over 80% of the cells can survive even after co-incubation with an extremely high concentration (125.0 μg mL−1). The MTT assays confirm the low in vitro cytotoxicity of these nanoparticles.
The cell internalization ability of the delivery platform is the basis of in vivo BBB crossing efficacy. Herein we first tested the cell internalization ability with monolayer cells. As observed by confocal microscopy (Fig. S2b†), after 3 h of incubation, a small amount of non-TAT-modified nanoparticles is observed in C6 cells and localized in the cytoplasm. In contrast, TAT-modified nanoparticles (TBS, TAT-1-nBSA, TAT-5-nBSA and TAT-10-nBSA) can largely enter C6 cells. Among these four TAT-modified groups, the TAT-10-nBSA group shows the greatest permeability. To further demonstrate the extra cell penetrating ability of TAT-modified nanoparticles, quantitative results of flow cytometric analysis were collected (Fig. S2c and d†). With the increase in incubation time, the amount of TAT-modified nanoparticles internalized increases in both L929 and C6 cell lines. During the observed 3 h, the total amount of nanoparticles that penetrate the cell membranes is much higher for the TAT-modified groups than for the non-modified group both in L929 cells and C6 cells. In particular, for the TAT-10-nBSA group, 28.2% of all the nanoparticles can go into the L929 cells and 65.2% into the C6 cells, while the numbers for the TBSA group are 10.3% and 24.3%, for TAT-1-nBSA group they are 2.7% and 13.8%, and for TAT-5-nBSA group they are 10.7% and 29.2%, respectively. In contrast, for non-modified group nBSA nanoparticles, there are only 0.7% and 0.6% nanoparticles internalized by the cells. In summary, the conjugation of TAT peptide on the surface of nanoparticles can significantly improve cell internalization ability. The enhanced cell uptake of TAT-modified nanoparticles is beneficial for improving the potential drug delivery efficiency. Besides, for fibroblast cells and glioma cells in our study, the delivery system shows a propensity for much more internalization by the glioma cells no matter in which TBSA, TAT-1-nBSA, TAT-5-nBSA or TAT-10-nBSA group, and this might be a hint for targeting delivery in vivo.
To further demonstrate the cell transport ability in a model much more similar to the real BBB in vivo than the monolayer cell lines, we constructed an in vitro BBB model to test the permeability efficacy of the delivery platforms. The set-up of the BBB model is shown in Fig. 3a, as previously described by Deli and co-workers.70 Rat brain microvascular endothelial cells (RBMEC) grew into a non-overlapping continuous monolayer film, showing close connections with each other, small size, and positive staining for von Willebrand factor (Fig. 3c). Rat brain astrocyte cells (RBAC) give positive immunostaining for GFAP, resembling astrocytic endfeet with a distinct morphology (Fig. 3b). Rat brain pericyte cells (RBPC) are different from RBMEC and RBAC both in morphology and size and have a large spread with irregular projections, and they are positive for alpha-smooth muscle actin immunostaining (Fig. 3d). From the TEM images (Fig. 3e) it can be clearly observed that with the existence of both RBAC and RBPC, RBMEC grow on the membrane of the transwell with TJs and kissing points (white arrows in Fig. 3e).
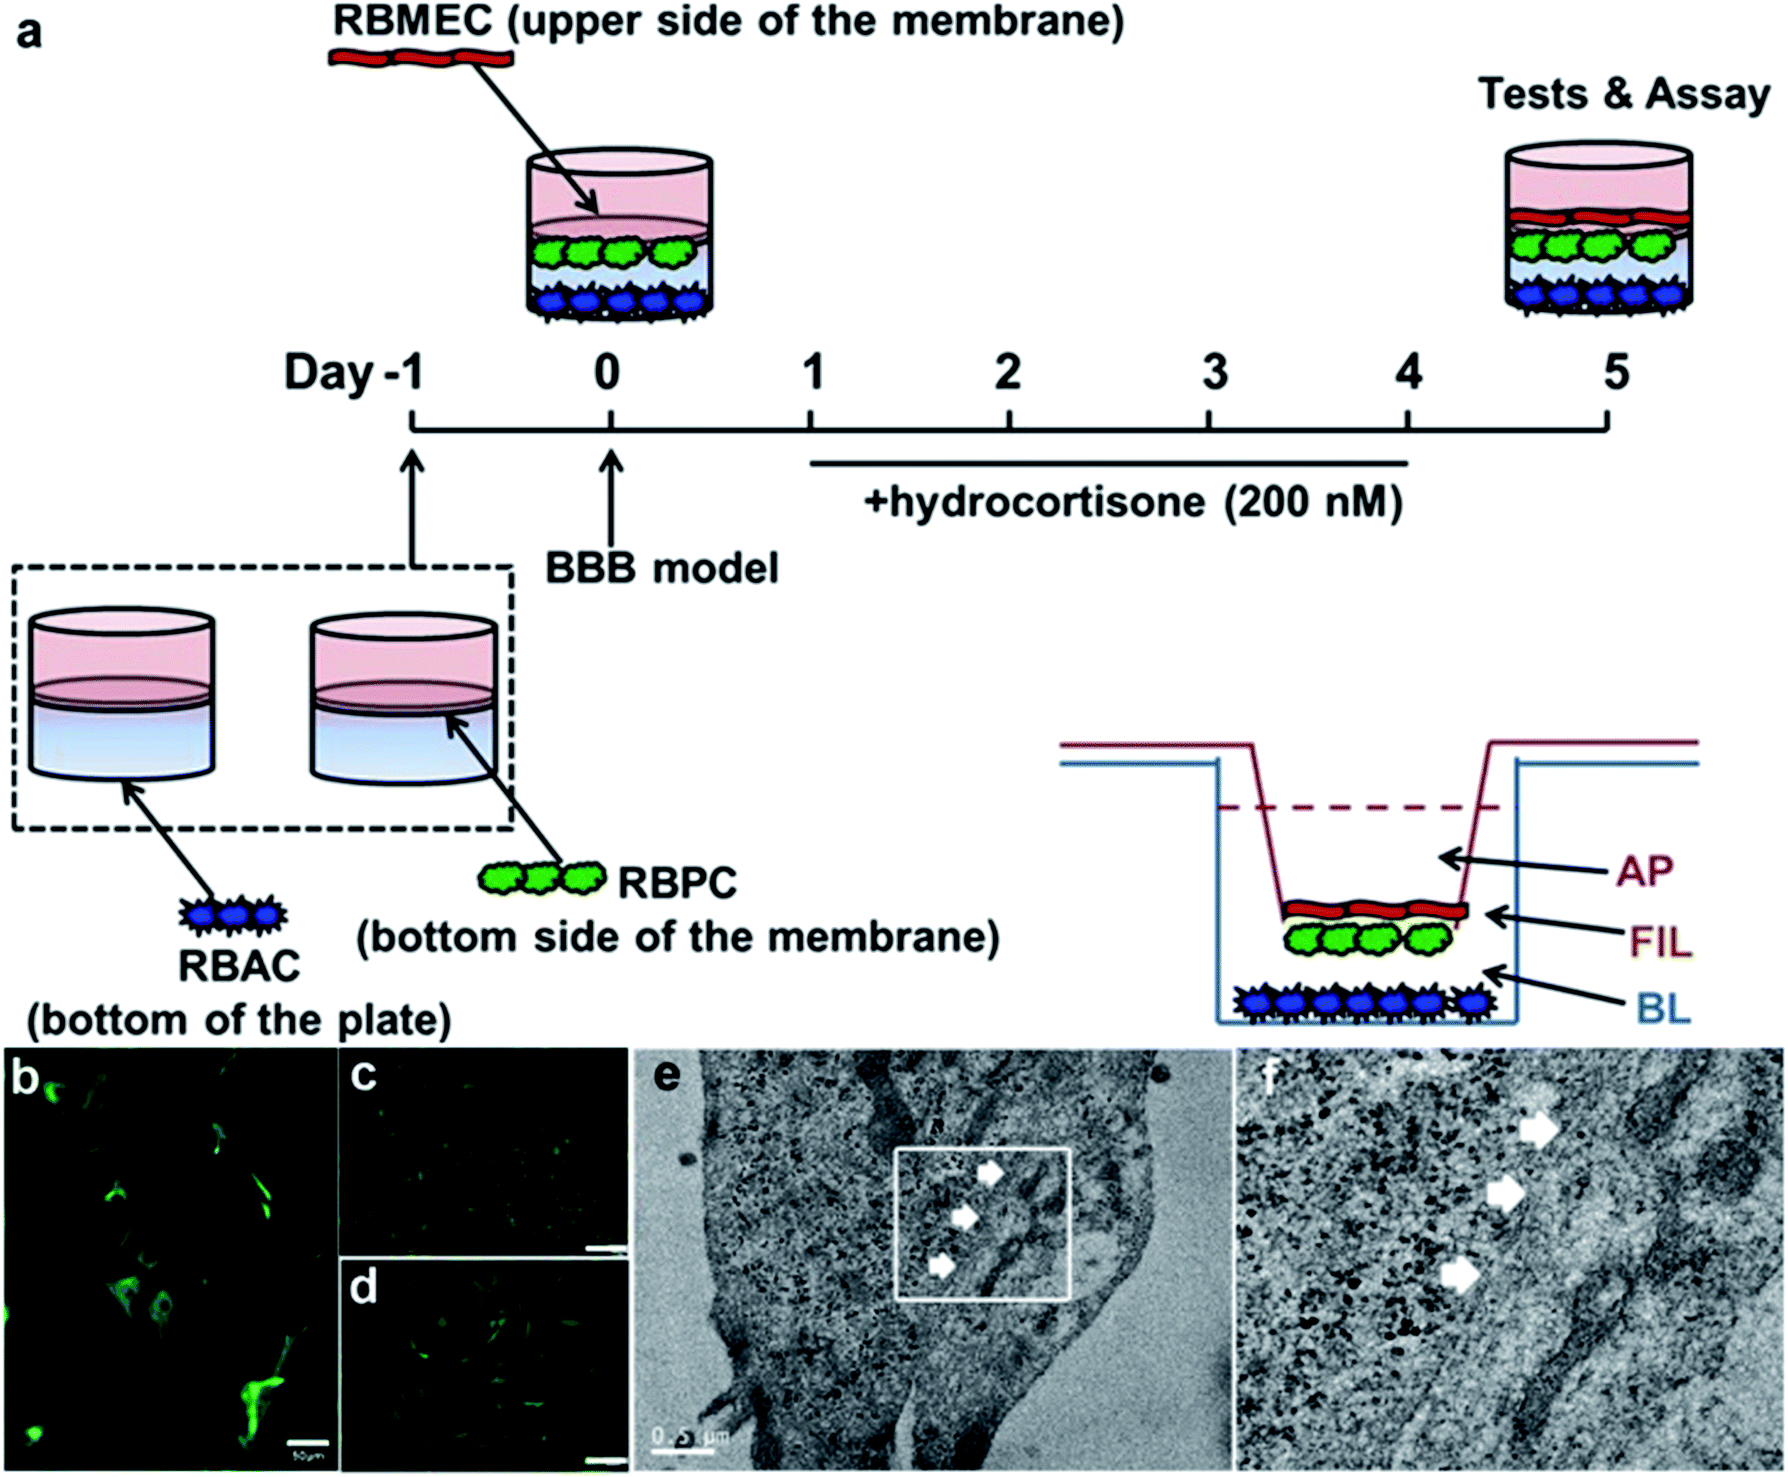 | ||
| Fig. 3 In vitro BBB study. (a) Schematic drawing of the preparation of the in vitro BBB model. On day 0, RBMEC was added to the luminal compartment of the inserts with RBPC on the bottom side of the inserts and RBAC on the bottom of the 12-well plates. From day 1, cells were grown with 500 nM hydrocortisone in the medium. Experiments were performed on day 4. (b–d) Characterization of primary cells by immunofluorescence microscopy. RBAC was positive for glial fibrillary acidic protein (GFAP, Fig. 3b), RBMEC was positive for factor VIII-related antigen/von Willebrand factor (Fig. 3c), and RBPC gave a positive immunostaining for alpha smooth muscle actin (Fig. 3d). Scale bar was 100 μm for Fig. 3c and d. (e) TEM image of RBMEC grown on the upper side of the inserts. (f) Magnified version of white box part in (e). White arrows were the kissing points (part of tight junctions). | ||
The integrity of the RBMEC monolayer in the in vitro BBB model was monitored by the trans epithelial electric resistance (TEER) value during the experiments, which was typically above 250.0 Ω cm2. The permeability coefficients Pe of the different groups are collected in Table 2. This reveals that TAT-5-nBSA possesses the most prominent transport capability with an endothelial permeability coefficient Pe of 17.703 × 10⁻⁶ cm s−1 compared to other groups. 4.09% of initial TBSA, 3.93% of initial TAT-1-nBSA, 4.29% of initial TAT-5-nBSA and 2.43% of initial TAT-10-nBSA nanoparticles are found in BL after 60 min of incubation, but only 0.75% of non-TAT-modified nBSA could be detected under the same conditions. In addition to the enhancement in transport ratio over the BBB, the TAT-modified delivery systems show an enhanced affinity with the cells (Fig. S3,† RBMEC cellular monolayer (FIL)). After 60 min of incubation, about 55.81% of the total dosed TAT-modified nanoparticles (TAT-5-nBSA) remain inside the cells, 60 times as high as that of nBSA nanoparticles (0.91%). This indicates that TAT peptides have played a specific role in mediating the BBB-penetration of the nanoparticles. In addition, comparing these four TAT-modified groups, TAT-5-nBSA nanoparticles possess the strongest ability both in crossing the in vitro BBB model and in contacting the RBMEC monolayers. As shown in Fig. S3,† as the number of modified TAT peptides increases from 5 to 10 for different TAT-modified groups, fewer particles are internalized by the RBMEC monolayer or transported from the apical side (AP) to the basolateral side (BL) during the observed 60 min. However, more TAT-10-nBSA nanoparticles appear in AP than TAT-5-nBSA nanoparticles. Unlike the results in monolayer cell line conditions, because of the existence of BBB in the in vitro BBB model, TAT shows both the penetration ability and the recognition effects of P-glycoproteins. Then the final permeation efficacy is the competition of these two opposite abilities. We suppose that excess TAT peptides (10 times BSA in molar ratio in our case) will give rise to more easy recognition of the delivery system by the BBB rather than better transport efficiency. Thus we could draw a conclusion that the BBB-crossing permeability is proportional to the amount of TAT peptides on the surface within a certain range. Beyond that, this efficacy would decline as the number of TAT increases. No big difference can be seen between the TBSA and TAT-5-nBSA groups. However, in this in vitro BBB model, the total amounts of nanoparticles in each group at the beginning and end of the whole test are equal to each other, and they will not be metabolized or cleared as happens in the real animal. Under such conditions, the non-fouling shell made no difference.
| Systems | Pe (10−6 cm s−1)a | R2b | Transport in BL (%, 60 min) | Uptake in FIL (%, 60 min) |
|---|---|---|---|---|
| a Pe: endothelial permeability coefficient for each system.b R2: goodness of fit for each system at three time points. | ||||
| TBSA | 11.695 | 0.9911 | 4.09 | 43.18 |
| nBSA | 0.778 | 0.9857 | 0.75 | 0.91 |
| TAT-1-nBSA | 9.585 | 0.9993 | 3.93 | 42.50 |
| TAT-5-nBSA | 17.703 | 0.9897 | 4.29 | 55.81 |
| TAT-10-nBSA | 7.822 | 0.9895 | 2.43 | 38.99 |
In order to show the real BBB-transport ability of the delivery systems, healthy nude mice were used for animal imaging. Firstly, through pharmacokinetic study, we can evaluate the circulation behavior of each group in vivo. As revealed in Fig. 4b, after encapsulation of zwitterionic polymer PMPC on the surface, the in vivo lifetime of nBSA and TAT–nBSA groups can be more than 72 h, and their half-lifetimes were prolonged to about 24 h. In contrast, due to the lack of this non-fouling shell, TBSA showed short circulation time and will be quickly cleared from the blood with a half-lifetime of around 10 h. Based on this situation and difference, their BBB-permeability will be quite different from the in vitro BBB model-based test which takes no metabolism into consideration. As shown in Fig. 4a, 1 h after intravenous injection, a strong near-infrared (NIR) fluorescence signal shows up in the cerebral area and heart for both non-TAT-modified-nBSA and TAT-modified-nBSA groups. In contrast, non-PMPC-modified nanoparticles mainly located in lungs and kidneys due to their ultra-small size. 3 h after injection, the signal in the brain becomes much weaker in the nBSA group, while the signal remains strong in this area for TAT–nBSA nanoparticles. Even after 24 and 48 h, the fluorescence signals of these three TAT-modified-nBSA groups remain strong in the brain and heart. However, weak signals continue to be present in the cerebral area of the control group treated with nBSA during the same time window. Conversely, due to its relatively short in vivo lifetime, TBSA was quickly cleared from the kidney and hence did not have much chance to contact with and penetrate through the BBB. Compared to the results in cell line conditions and the in vitro BBB model case, we can clearly see the difference between the TBSA and TAT-5-nBSA groups in BBB permeability. We propose that this difference mainly comes from their in vivo circulation time, which can be obviously changed by the modification of the zwitterionic polymer shell on the surface. These in vivo results strongly demonstrate the critical role of long circulation in crossing the BBB of the delivery platform.
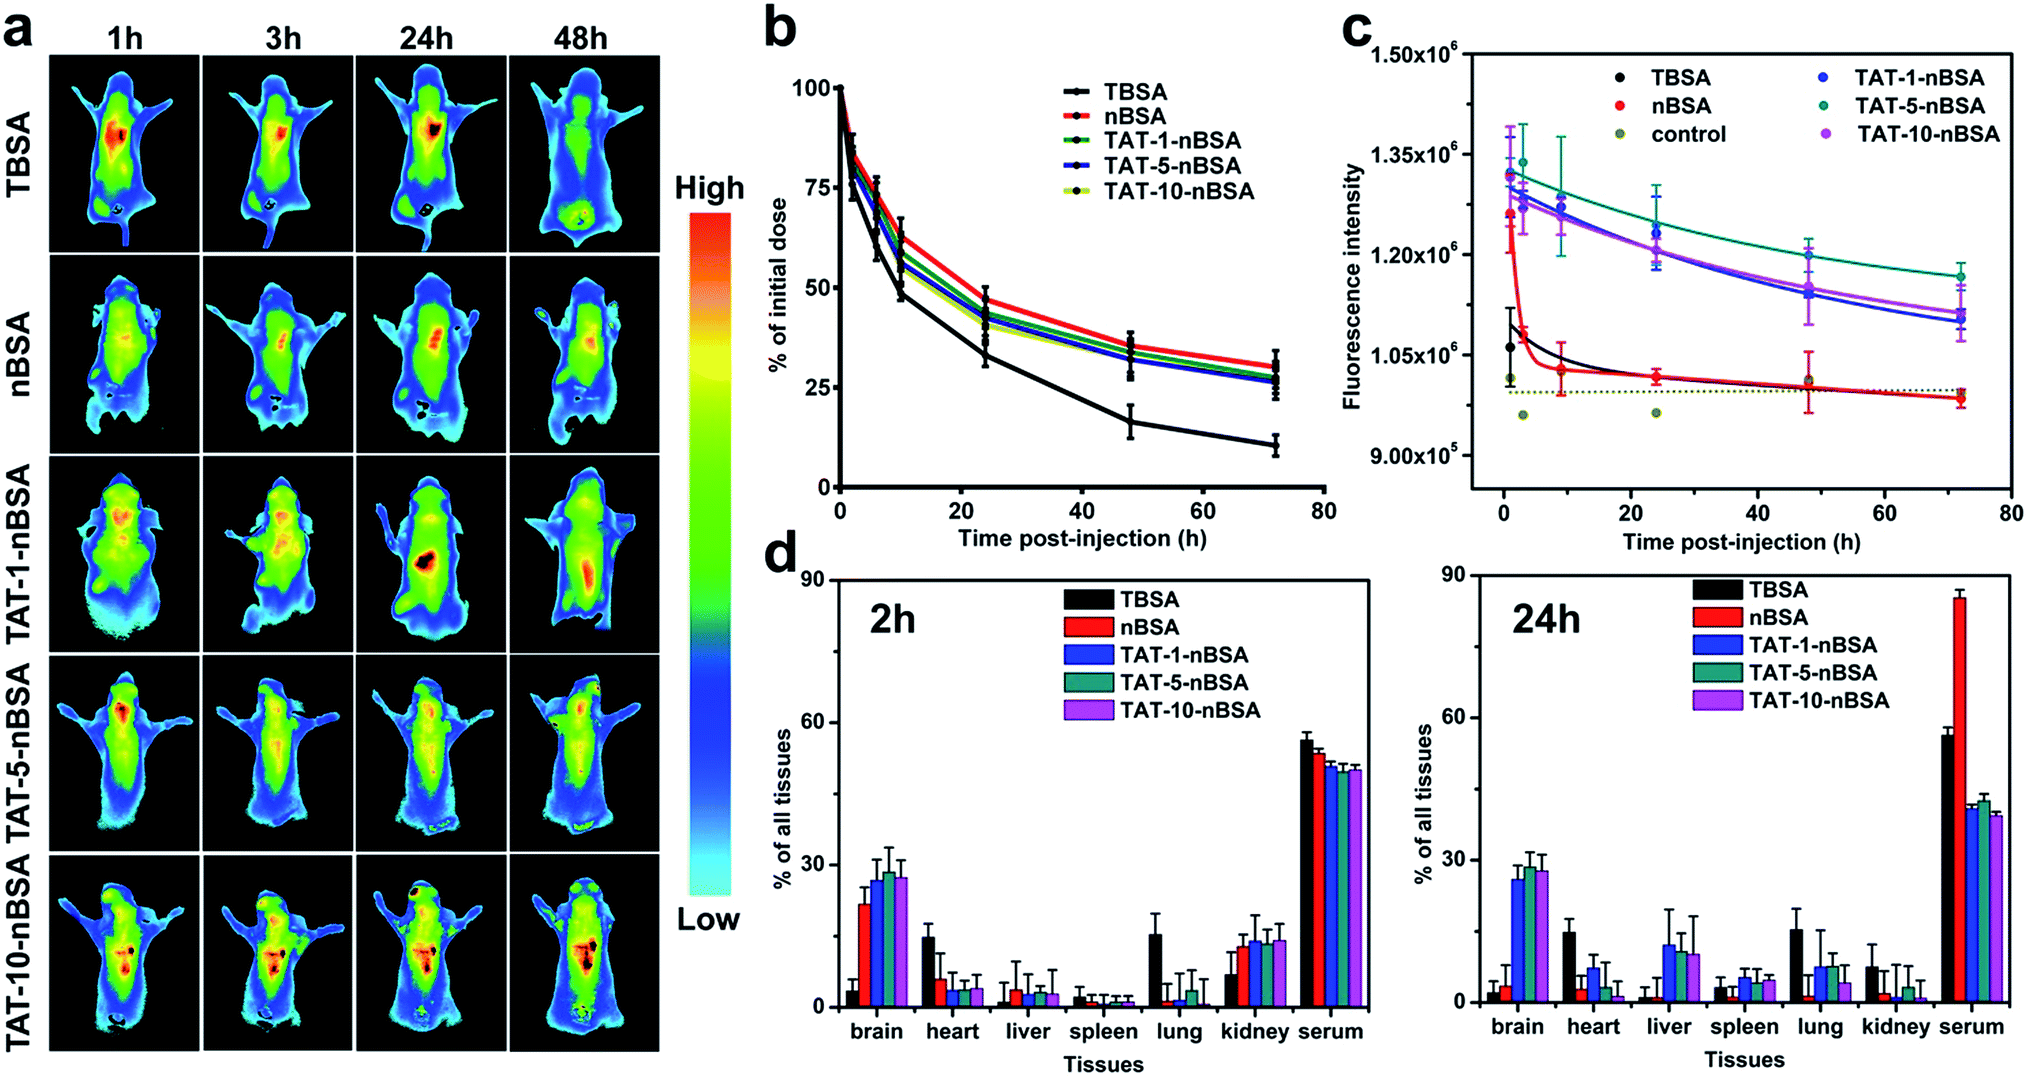 | ||
| Fig. 4 In vivo study of the delivery system. (a) In vivo imaging of mice injected with Cy5.5-labeled TAT-modified and non-TAT-modified nanoparticles, post-injection for 1 h, 3 h, 24 h and 48 h. (b) In vivo circulation time of FITC-labeled TBSA, nBSA and TAT–nBSA from 1 h to 72 h post-injection. (c) Intracerebral fluorescence of TBSA, nBSA and TAT–nBSA from 1 h to 72 h post-injection. (d) 2 h and 24 h post-injection biodistribution in brain, serum, heart, liver, spleen, lung and kidney. | ||
In addition, to better understand the biodistribution and accumulation of the nanoparticles, major organs including brain, heart, liver, spleen, lung, kidney and serum were collected and analyzed 2 h and 24 h after injection. As shown in Fig. 4d and S3,† for TBSA nanoparticle treated mice, 2 h post-injection, the fluorescence signals are distributed extensively in serum (53.32%) lung (15.35%) and heart (14.79%), and less in the liver (1.09%). And a similar biodistribution can be observed for the TBAS group 24 h post-injection. And it was mainly cleared through the kidney. In the case of nBSA nanoparticle treated mice, 2 h post-injection, the fluorescence signals were distributed extensively in serum (53.56%) and brain (21.72%), and less in the liver (3.65%). Nevertheless, after 24 h, the nanoparticles nearly completely disappear from the brain (3.43%). In contrast, for TAT-modified-nBSA nanoparticles, there are still 25.94%, 28.58% and 27.75%, respectively, in the brain even 24 h after treatment. The ability of these three groups of nanoparticles to go into the brain is much stronger than for the non-TAT-modified nBSA and non-zwitterionic polymer-modified TBAS. nBSA nanoparticles could go across the BBB in the first 2 h after injection maybe because of the existence of gaps in the BBB and their similar structure to the head-group of PC lipids in the outer membrane of living cells. Though the nBSA nanocarriers have a biomembrane-like structure, they would soon be expelled from the brain section due to the P-glycoproteins efflux pump on the BBB.
To make a further precise quantitative examination of the BBB-crossing ability of the nanoparticles, we used fluorescence examination by fluorescence spectrophotometer and imaging. As shown in Fig. 4b, the intracerebral retention time of the TAT–nBSA delivery systems is as long as 72 h according to the time window of the investigation period after single intravenous injection. In contrast, though conjugated with TAT, the TBSA group cannot effectively penetrate through the BBB due to its short lifetime in vivo. The results (Fig. S5†) show that TAT-modification gives extra permeability of the BBB to the nanoparticles when compared with the non-TAT-labeled nBSA group. No matter whether 1 h, 2 h or 24 h post-injection, those nanoparticles could continue being seen inside the brain. In contrast, although nBSA nanoparticles could accumulate in the brain 1 and 2 h after injection, they could not remain there later and could barely be seen 24 h post-injection. Moreover, the TAT-5-nBSA group shows a stronger ability to light the brain section than TBAS, TAT-1-nBSA and TAT-10-nBSA. As shown in Fig. 5, 2 h after tail vein injection, TAT–nBSA nanoparticles locate not only in the brain vascular endothelial cells but also in the brain parenchyma. However, for TBSA nanoparticles, though they can be largely internalized by brain vascular endothelial cells, due to their relatively short circulation time, hardly any can be observed in brain parenchyma. Comparing the results in Fig. 4c and S4,† the TBSA and nBSA groups show the worst ability to go across the BBB from the blood circulation.
 | ||
| Fig. 5 Immunofluorescence image of mouse brain sections (10 μm) from animals injected with FITC-labeled TBSA, nBSA, TAT–nBSA 2 h post-injection of the mice, respectively. Blue is the nucleus, red is the blood vessels and green is the nanoparticles. The last row is the magnified version of the white box in merge. Scale bar = 50 μm. | ||
Conclusions
In conclusion, the aim of this work is to verify if long circulation lifetime is a critical issue for nanocarriers to deliver biologically active substances through the BBB, which could develop new effective strategies for drug delivery into the brain. In this regard, we have successfully fabricated an albumin-based nanoparticle delivery platform TAT–nBSA with distinct sizes for BBB-crossing. TAT–nBSA could simultaneously serve as a long lifetime circulating vehicle and an effective BBB-crossing agent. The TAT–nBSA nanoparticles are not recognized by the multidrug efflux system and remain inside the brain even up to 72 h with a high ratio of nearly 30% to the initial dose. Thus, this delivery system would be a suitable candidate as a BBB nanocarrier in clinical practice, whether for chronic or acute treatment. Moreover, BSA used in this system is just a model protein, which could be replaced by any type of active protein such as catalase, transferrin or even antibiotics for various additional functions to assist different types of drugs to bind onto the proteins for various kinds of CNS-related diseases. We believe this potential BBB-crossing platform could act as a meaningful addition to satisfy the unmet clinical need for various types of CNS disorders.Conflict of interest
The authors declare no competing financial interest.Acknowledgements
This work was financially supported by the National Basic Research Program of China (2015CB931801) and National Natural Science Foundation of China (51690151, 91527304, 51473093).References
- I. U. Ali and X. Chen, ACS Nano, 2015, 9, 9470 CrossRef CAS PubMed.
- S. Wohlfart, S. Gelperina and J. Kreuter, J. Controlled Release, 2012, 161, 264 CrossRef CAS PubMed.
- P. Arranz-Gibert, B. Guixer, M. Malakoutikhah, M. Muttenthaler, F. Guzman, M. Teixido and E. Giralt, J. Am. Chem. Soc., 2015, 137, 7357 CrossRef CAS PubMed.
- R. Prades, B. Oller-Salvia, S. M. Schwarzmaier, J. Selva, M. Moros, M. Balbi, V. Grazu, J. M. de La Fuente, G. Egea, N. Plesnila, M. Teixido and E. Giralt, Angew. Chem., Int. Ed., 2015, 54, 3967 CrossRef CAS PubMed.
- J. V. Georgieva, R. P. Brinkhuis, K. Stojanov, C. A. Weijers, H. Zuilhof, F. P. Rutjes, D. Hoekstra, J. C. van Hest and I. S. Zuhorn, Angew. Chem., Int. Ed., 2012, 51, 8339 CrossRef CAS PubMed.
- M. Malakoutikhah, M. Teixido and E. Giralt, Angew. Chem., Int. Ed., 2011, 50, 7998 CrossRef CAS PubMed.
- M. E. Brewster, W. R. Anderson, A. I. Webb, L. M. Pablo, D. Meinsma, D. Moreno, H. Derendorf, N. Bodor and E. Pop, Antimicrob. Agents Chemother., 1997, 41, 122 CAS.
- V. Carelli, F. Liberatore, L. Scipione, M. Impicciatore, E. Barocelli, M. Cardellini and G. Giorgioni, J. Controlled Release, 1996, 42, 209 CrossRef CAS.
- S. Manfredini, B. Pavan, S. Vertuani, M. Scaglianti, D. Compagnone, C. Biondi, A. Scatturin, S. Tanganelli, L. Ferraro and P. Prasad, J. Med. Chem., 2002, 45, 559 CrossRef CAS PubMed.
- M. Gynther, K. Laine, J. Ropponen, J. Leppänen, A. Mannila, T. Nevalainen, J. Savolainen, T. Järvinen and J. Rautio, J. Med. Chem., 2008, 51, 932 CrossRef CAS PubMed.
- M. Gynther, J. Ropponen, K. Laine, J. Leppänen, P. Haapakoski, L. Peura, T. Järvinen and J. Rautio, J. Med. Chem., 2009, 52, 3348 CrossRef CAS PubMed.
- R. J. Boado, Q.-H. Zhou, J. Z. Lu, E. K.-W. Hui and W. M. Pardridge, Mol. Pharmaceutics, 2009, 7, 237 CrossRef PubMed.
- R. J. Boado, Y. Zhang, Y. Zhang, C. F. Xia, Y. Wang and W. M. Pardridge, Biotechnol. Bioeng., 2008, 99, 475 CrossRef CAS PubMed.
- R. J. Boado, Y. Zhang, Y. Zhang, C.-F. Xia and W. M. Pardridge, Bioconjugate Chem., 2007, 18, 447 CrossRef CAS PubMed.
- R. J. Boado, E. K. Hui, J. Z. Lu, R. K. Sumbria and W. M. Pardridge, Bioconjugate Chem., 2013, 24, 1741 CrossRef CAS PubMed.
- Y. L. Xie, W. Lu and X. G. Jiang, Behav. Brain Res., 2006, 173, 76 CrossRef CAS PubMed.
- X. Ying, H. Wen, W. L. Lu, J. Du, J. Guo, W. Tian, Y. Men, Y. Zhang, R. J. Li, T. Y. Yang, D. W. Shang, J. N. Lou, L. R. Zhang and Q. Zhang, J. Controlled Release, 2010, 141, 183 CrossRef CAS PubMed.
- H. Ding, V. Sagar, M. Agudelo, S. Pilakka-Kanthikeel, V. S. Atluri, A. Raymond, T. Samikkannu and M. P. Nair, Nanotechnology, 2014, 25, 055101 CrossRef PubMed.
- H. Xaio, W. Banks, M. L. Niehoff and J. Morley, Brain Res., 2001, 896, 36 CrossRef CAS PubMed.
- P. Wang, Y. Xue, X. Shang and Y. Liu, Cell. Mol. Neurobiol., 2010, 30, 717 CrossRef CAS PubMed.
- D. Camerino, P. M. Conway, B. I. J. M. van der Heijden, E. van der Schoot, J. Pokorski, M. Estryn-Behar and H. M. Hasselhorn, Int. Congr. Ser., 2005, 1280, 61 CrossRef.
- T. J. Abbruscato, S. P. Lopez, K. S. Mark, B. T. Hawkins and T. P. Davis, J. Pharm. Sci., 2002, 91, 2525 CrossRef CAS PubMed.
- X. Wei, C. Zhan, Q. Shen, W. Fu, C. Xie, J. Gao, C. Peng, P. Zheng and W. Lu, Angew. Chem., Int. Ed., 2015, 54, 3023 CrossRef CAS PubMed.
- X. Wei, C. Zhan, X. Chen, J. Hou, C. Xie and W. Lu, Mol. Pharmaceutics, 2014, 11, 3261 CrossRef CAS PubMed.
- T. R. Pearce, K. Shroff and E. Kokkoli, Adv. Mater., 2012, 24, 3803 CrossRef CAS PubMed.
- J. A. Barreto, W. O'Malley, M. Kubeil, B. Graham, H. Stephan and L. Spiccia, Adv. Mater., 2011, 23, H18 CrossRef CAS PubMed.
- H. Yan, L. Wang, J. Wang, X. Weng, H. Lei, X. Wang, L. Jiang, J. Zhu, W. Lu and X. Wei, ACS Nano, 2011, 6, 410 CrossRef PubMed.
- J. Li, P. Cai, A. Shalviri, J. T. Henderson, C. He, W. D. Foltz, P. Prasad, P. M. Brodersen, Y. Chen and R. DaCosta, ACS Nano, 2014, 8, 9925 CrossRef CAS PubMed.
- R. Qiao, Q. Jia, S. Hüwel, R. Xia, T. Liu, F. Gao, H.-J. Galla and M. Gao, ACS Nano, 2012, 6, 3304 CrossRef CAS PubMed.
- X. Wang, T. Ishida and H. Kiwada, J. Controlled Release, 2007, 119, 236 CrossRef CAS PubMed.
- T. Ishida, X. Wang, T. Shimizu, K. Nawata and H. Kiwada, J. Controlled Release, 2007, 122, 349 CrossRef CAS PubMed.
- T. Ishida and H. Kiwada, Int. J. Pharm., 2008, 354, 56 CrossRef CAS PubMed.
- Y. Liu, H. Reidler, J. Pan, D. Milunic, D. Qin, D. Chen, Y. R. Vallejo and R. Yin, J. Pharmacol. Toxicol. Methods, 2011, 64, 238 CrossRef CAS PubMed.
- Y. Hashimoto, T. Shimizu, A. S. Abu Lila, T. Ishida and H. Kiwada, Biol. Pharm. Bull., 2015, 38, 417 CAS.
- M. J. Haney, N. L. Klyachko, Y. Zhao, R. Gupta, E. G. Plotnikova, Z. He, T. Patel, A. Piroyan, M. Sokolsky, A. V. Kabanov and E. V. Batrakova, J. Controlled Release, 2015, 207, 18 CrossRef CAS PubMed.
- M. Sakakida, K. Nishida, M. Shichiri, K. Ishihara and N. Nakabayashi, Sensors and Actuators B, 1993, 319, 13–14 Search PubMed.
- K. Ishihara, Y. Abe, S. Enomoto, A. Watanabe, S. Tanaka and N. Nakabayashi, Biomedical Materials Research in the Far East (1), Kobunshi Kankokai, Kyoto, 1993, p. 7 Search PubMed.
- T. Yoneyama, K. Ishihara, N. Nakabayashi, M. Ito and Y. Mishima, J. Biomed. Mater. Res., 1998, 43, 15 CrossRef CAS PubMed.
- K. Ishihara, T. Shinozuka, Y. Hanazaki, Y. Iwasaki and N. Nakabayashi, J. Biomater. Sci., Polym. Ed., 1999, 10, 271 CrossRef CAS PubMed.
- M. Kyomoto, T. Moro, Y. Iwasaki, F. Miyaji, H. Kawaguchi, Y. Takatori, K. Nakamura and K. Ishihara, J. Biomed. Mater. Res., Part A, 2009, 91, 730 CrossRef PubMed.
- Y. Iwasaki, S.-i. Sawada, N. Nakabayashi, G. Khang, H. B. Lee and K. Ishihara, Biomaterials, 1999, 20, 2185 CrossRef CAS PubMed.
- S. Chen, J. Zheng, L. Li and S. Jiang, J. Am. Chem. Soc., 2005, 127, 14473 CrossRef CAS PubMed.
- Y. He, J. Hower, S. Chen, M. T. Bernards, Y. Chang and S. Jiang, Langmuir, 2008, 24, 10358 CrossRef CAS PubMed.
- Q. Shao and S. Jiang, Adv. Mater., 2015, 27, 15 CrossRef CAS PubMed.
- B. Gao, Y. Feng, J. Lu, L. Zhang, M. Zhao, C. Shi, M. Khan and J. Guo, Mater. Sci. Eng. C, 2013, 33, 2871 CrossRef CAS PubMed.
- B. Wang, T. Jin, Y. Han, C. Shen, Q. Li, Q. Lin and H. Chen, J. Mater. Chem. B, 2015, 3, 5501 RSC.
- S. Sawada, Y. Iwasaki, N. Nakabayashi and K. Ishihara, J. Biomed. Mater. Res., Part A, 2006, 79, 476 CrossRef PubMed.
- T. Goda, T. Konno, M. Takai, T. Moro and K. Ishihara, Biomaterials, 2006, 27, 5151 CrossRef CAS PubMed.
- J. Sibarani, M. Takai and K. Ishihara, Colloids Surf., B, 2007, 54, 88 CrossRef CAS PubMed.
- H. Ueda, J. Watanabe, T. Konno, M. Takai, A. Saito and K. Ishihara, J. Biomed. Mater. Res., Part A, 2006, 77, 19 CrossRef PubMed.
- A. Bakhai, J. Booth, N. Delahunty, F. Nugara, T. Clayton, J. McNeill, S. W. Davies, D. C. Cumberland, R. H. Stables and S. V. S. Investigators, Int. J. Cardiol., 2005, 102, 95 CrossRef CAS PubMed.
- J. Watanabe and K. Ishihara, Biomacromolecules, 2005, 6, 1797 CrossRef CAS PubMed.
- S. Abraham, S. Brahim, K. Ishihara and A. Guiseppi-Elie, Biomaterials, 2005, 26, 4767 CrossRef CAS PubMed.
- T. Konno, H. Hasuda, K. Ishihara and Y. Ito, Biomaterials, 2005, 26, 1381 CrossRef CAS PubMed.
- R. R. Palmer, A. L. Lewis, L. C. Kirkwood, S. F. Rose, A. W. Lloyd, T. A. Vick and P. W. Stratford, Biomaterials, 2004, 25, 4785 CrossRef CAS PubMed.
- S. Long, Biomaterials, 2003, 24, 4115 CrossRef CAS PubMed.
- H. K. Avraham, S. Jiang, T. H. Lee, O. Prakash and S. Avraham, J. Immunol., 2004, 173, 6228 CrossRef CAS.
- H. Pu, J. Tian, I. E. Andras, K. Hayashi, G. Flora, B. Hennig and M. Toborek, J. Cereb. Blood Flow Metab., 2005, 25, 1325 CrossRef CAS PubMed.
- I. E. Andras, H. Pu, J. Tian, M. A. Deli, A. Nath, B. Hennig and M. Toborek, J. Cereb. Blood Flow Metab., 2005, 25, 1159 CrossRef CAS PubMed.
- K. S. Rao, M. K. Reddy, J. L. Horning and V. Labhasetwar, Biomaterials, 2008, 29, 4429 CrossRef CAS PubMed.
- I. E. András, H. Pu, M. A. Deli, A. Nath, B. Hennig and M. Toborek, J. Neurosci. Res., 2003, 74, 255 CrossRef PubMed.
- R. Yu, Z. Zeng, X. Guo, H. Zhang, X. Liu, Y. Ding and J. Chen, Neurosci. Lett., 2012, 527, 1 CrossRef CAS PubMed.
- M. J. Simon, S. Gao, W. H. Kang, S. Banta and B. Morrison, 3rd, Biotechnol. Bioeng., 2009, 104, 10 CrossRef CAS PubMed.
- Y. Qin, H. Chen, W. Yuan, R. Kuai, Q. Zhang, F. Xie, L. Zhang, Z. Zhang, J. Liu and Q. He, Int. J. Pharm., 2011, 419, 85 CrossRef CAS PubMed.
- Y. Qin, H. Chen, Q. Zhang, X. Wang, W. Yuan, R. Kuai, J. Tang, L. Zhang, Z. Zhang, Q. Zhang, J. Liu and Q. He, Int. J. Pharm., 2011, 420, 304 CrossRef CAS PubMed.
- H. Brooks, B. Lebleu and E. Vives, Adv. Drug Delivery Rev., 2005, 57, 559 CrossRef CAS PubMed.
- W. A. Banks, S. M. Robinson and A. Nath, Exp. Neurol., 2005, 193, 218 CrossRef CAS PubMed.
- M. Yan, J. Du, Z. Gu, M. Liang, Y. Hu, W. Zhang, S. Priceman, L. Wu, Z. H. Zhou and Z. Liu, Nat. Nanotechnol., 2010, 5, 48 CrossRef CAS PubMed.
- J. Zhang, Y. Lei, A. Dhaliwal, Q. K. Ng, J. Du, M. Yan, Y. Lu and T. Segura, Biomacromolecules, 2011, 12, 1006 CrossRef CAS PubMed.
- S. Nakagawa, M. A. Deli, H. Kawaguchi, T. Shimizudani, T. Shimono, A. Kittel, K. Tanaka and M. Niwa, Neurochem. Int., 2009, 54, 253 CrossRef CAS PubMed.
Footnote |
| † Electronic supplementary information (ESI) available: Experimental details and supplementary data. See DOI: 10.1039/c7ra01532a |
| This journal is © The Royal Society of Chemistry 2017 |