
 Open Access Article
 This Open Access Article is licensed under a
 Creative Commons Attribution 3.0 Unported Licence
Silk/agarose scaffolds with tunable properties via SDS assisted rapid gelation†
Yue Lua,
Shupeng Zhanga,
Xiangyang Liubc,
Shefang Yea,
Xi Zhoua,
Qiaoling Huang*b and
Lei Ren *a
*a
aDepartment of Biomaterials, Fujian Collaborative Innovation Center for Exploitation and Utilization of Marine Biological Resources, College of Materials, Xiamen University, Xiamen 361005, China. E-mail: renlei@xmu.edu.cn
bResearch Institute for Soft Matter and Biomimetics, Xiamen University, Xiamen 361005, China. E-mail: qlhuang@xmu.edu.cn
cDepartment of Physics, FOS National University of Singapore, Singapore 117542, Singapore
First published on 19th April 2017
Abstract
Scaffolds with appropriate properties and a suitable shape based on the nature of the target tissue are essential in tissue engineering. In the present study, we developed a simple method to fabricate lyophilized silk/agarose scaffolds with tunable features (mechanical properties and pore structure) via controlling the gelation degree of silk fibroin and freeze-drying the gels with different gelation degrees. Sodium dodecyl sulfate (SDS) was utilized to control the gelling process of silk. Agarose helped retain the shape of the scaffolds after hydration and sterilization. Moreover, the scaffolds could be easily realized with the desired shape for specific applications by shaping the corresponding gels. The compressive modulus of the scaffolds was tunable within a range of 18.6–58.8 kPa, and inner pore sizes could be tuned from 52.3 ± 10.4 to 426.5 ± 138.5 μm. In vitro MC3T3-E1 cell proliferation indicated good biocompatibility of the silk/agarose scaffolds. Alkaline phosphatase (ALP) activity assay and mineralization analysis indicated that scaffolds with higher mechanical properties were more beneficial for osteogenic differentiation and mineralization. Thus, silk/agarose scaffolds are promising candidates for tissue engineering.
1. Introduction
With the increasing emergence of research on regenerative medicine and tissue engineering, numerous biomaterials have been developed for tissue engineering in clinical practice.1 The most widely applied commercial materials for tissue repair and healing are based on natural and synthetic biomaterials, such as collagen, polylactic acid (PLA), and poly(ethylene terephthalate) (PET). The therapeutic effects of these materials are often less than satisfactory for certain applications, as they often bring inflammation, infection or even fatality. This is due to the fact that the commercial biomaterials are typically elected on the basis of previous regulatory approval, instead of being optimal products for the specific injury.2Usually, more than one tissue is injured in common injuries. For example, musculoskeletal injuries involve not only bone fractures, but also soft tissue injuries such as tendons or ligaments. Bone tissues are the rigid part of body with dense small pores and not prone to deformation.3 In sharp contrast, soft tissue, such as subcutaneous tissues are soft and elastic with large pore size.4 Thus, the repair of different types of tissues requires biomaterials with appropriate properties.5,6 On one hand, the mechanical properties of biomaterials should mimic the target tissues to be sustainable to maintain tissue shape and facilitate the formation of new tissues.7,8 On the other hand, appropriate pore structure enhances free exchange of nutrients, gases and metabolites, infiltration of cells and vascular ingrowth.9 Therefore, design and fabricate implants with tunable properties for specific injuries have become an urgent need in medical practice.
Silk fibroin (SF) is a natural insoluble fibrous protein with unique mechanical properties, tunable degradation rate and good biocompatibility.10,11 It has been widely applied in soft tissue engineering (skin,12 vessel,13 nerve14 and bone tissues15) in the form of sponges, films, nonwovens and hydrogels. Structurally, SF consists of highly ordered crystalline domains and less-ordered amorphous domains. The crystalline domains are predominated by ordered β-sheet segments, which are composed of long (GAGAGS)n (G: glycine, A: alanine, S: serine) sequences.16 Fresh regenerated SF solutions are predominated by random coils, which can gradually transform to β-sheet during gelation. Moreover, the gel structure changes over time with increasing degree of gelation.17 Thus, it could be speculated that freeze-drying of SF gel from different gelation stages could generate three dimensional scaffolds with tunable properties. Unfortunately, there are three issues to consider when applying this method. Firstly, the natural sol–gel transition is slow that it takes several days up to weeks depending on SF concentrations and temperature.17 Consequently, it's difficult to obtain SF scaffolds with desired properties on the basis of actual requirements. Secondly, SF scaffolds with low β-sheet content are water soluble18 that scaffolds prepared by freeze-drying of gels at early gelation stage are unusable for biomedical applications. Thirdly, it is difficult to reconstruct lyophilized SF sponges to desired shape unless a particular mold is used for freeze-drying process.19 But specific molds need to be tailored to meet specific patient needs which is not economical enough.
For the first issue, external stimuli methods have been developed to accelerate the gelation process, such as ultrasound,20 temperature,21 surfactants,22 acids,23 etc. Among those methods, sodium dodecyl sulfate (SDS) is a gelling agent which can shorten and control the sol–gel transition to within tens of minutes.22 Herein, we used SDS to control gelation process of SF. For the second issue, numerous methods have been developed to improve water stability of SF scaffolds, including cross-linking,21 water-annealing,18 and organic solvent treatments.18,24,25 But most of those methods change the shape and/or morphology of scaffolds when increasing β-sheet content. Therefore, new methods have to be developed to obtain SF scaffolds with desired β-sheet fraction from gelation.
Agarose is a natural plant polysaccharide, which has been widely used in tissue engineering owing to its high mechanical strength, controllable degradation and ability to maintain cellular phenotype.26,27 Similar to SF, agarose could be constructed into flexible scaffolds using freeze-drying method. It has been demonstrated that agarose scaffolds were stable for more than a month without immune or inflammatory responses.12,28 Moreover, SF/agarose blended hydrogel has been proven to bring together the innate advantages of SF and agarose for cartilage tissue engineering.29 Thus, incorporation of SF with agarose might be able to improve the stability of pure SF scaffolds in aqueous solutions. In addition, agarose can cure into hydrogel under room temperature and the shape of hydrogel could be easily designed and constructed through a cutting process, thus solving the third issue mentioned above.
In this study, SF scaffolds with tunable mechanical property and morphology were fabricated by controlling gelation process before freeze-drying. SDS was used to accelerate and control SF gelation process. Agarose was introduced to improve water stability of SF scaffolds. The effect of SF gelation degree on scaffolds physical properties (conformation, mechanical properties, porosity, morphology, et al.) was investigated. The biocompatibility of scaffolds was evaluated by in vitro cell proliferation, osteogenic differentiation and mineralization.
2. Materials and experimental
2.1 Preparation of regenerated SF solutions
Regenerated silk fibroin (RSF) solutions were prepared as reported previously.30 Briefly, 5 g of raw silk were degummed twice with 1 L of 0.04 M sodium carbonate (Na2CO3) (Sinopharm Chemical Reagent, China) solution for 30 min and washed thoroughly with deionized water. The degummed fibers were dissolved in 9.3 M lithium bromide (LiBr) (Alfa Aesar, America) for 4 h at 60 °C. The solution was dialyzed using dialysis bag (3500 MWCO) (Solarbio, China) against deionized water for two days to remove LiBr. Then the RSF was concentrated by PEG (Mw = 20 kDa, Sinopharm Chemical Reagent, China) dialysis for 3 h. The concentration of the RSF solution was calculated by drying a certain volume of the solution and weighing the dried sample. The final concentration of the RSF solutions was about 8 wt%. RSF solutions were kept at 4 °C for further use.2.2 Screening for silk gelation
A mixed solution of agarose (Sangon, China) and sodium dodecyl sulfate (SDS) (Sinopharm Chemical Reagent, China) was prepared by adding SDS to warm agarose solution to obtain various concentrations of SDS. The RSF solution was thoroughly mixed with agarose/SDS solution by pipetting. The final concentration for each component was as follows: SF 4 wt%, agarose 1.5 wt% and SDS 4.5–6.5 mM. Aliquots (200 μL) of the mixed solutions were gently transferred into 96-well plates and incubated in a SpectraMax M2 Microplate Reader (Molecular Devices, CA, USA) at 37 °C. The gelation process was monitored by measuring the change of optical density (OD) at wavelength 550 nm.17 Five samples were analyzed for each concentration of SDS. And the OD changes were expressed as the mean value of each time point. The rapid gelation starting time (RGST) was defined as the time point at which the gelation rate increased to more than 0.01 min−1. The rapid gelation ending time (RGET) was determined as the time point at which the gelation rate decreased to less than 0.01 min−1. The preparation time was described as the time from 0 to RGST, and the gelling time (GT) was described as the time interval between RGET and RGST.2.3 Preparation of scaffolds
The most suitable SDS concentration for controlling fibroin gelation was selected according to the silk gelation kinetics curve (Fig. 1D). The mixed SF/agarose/SDS solutions were allowed to gel in a 24-well plate at 37 °C for different time periods before freezing. Then the mixture at different gelation stages was frozen directly at −20 °C for a day and lyophilized for 48 h, to obtain porous scaffolds.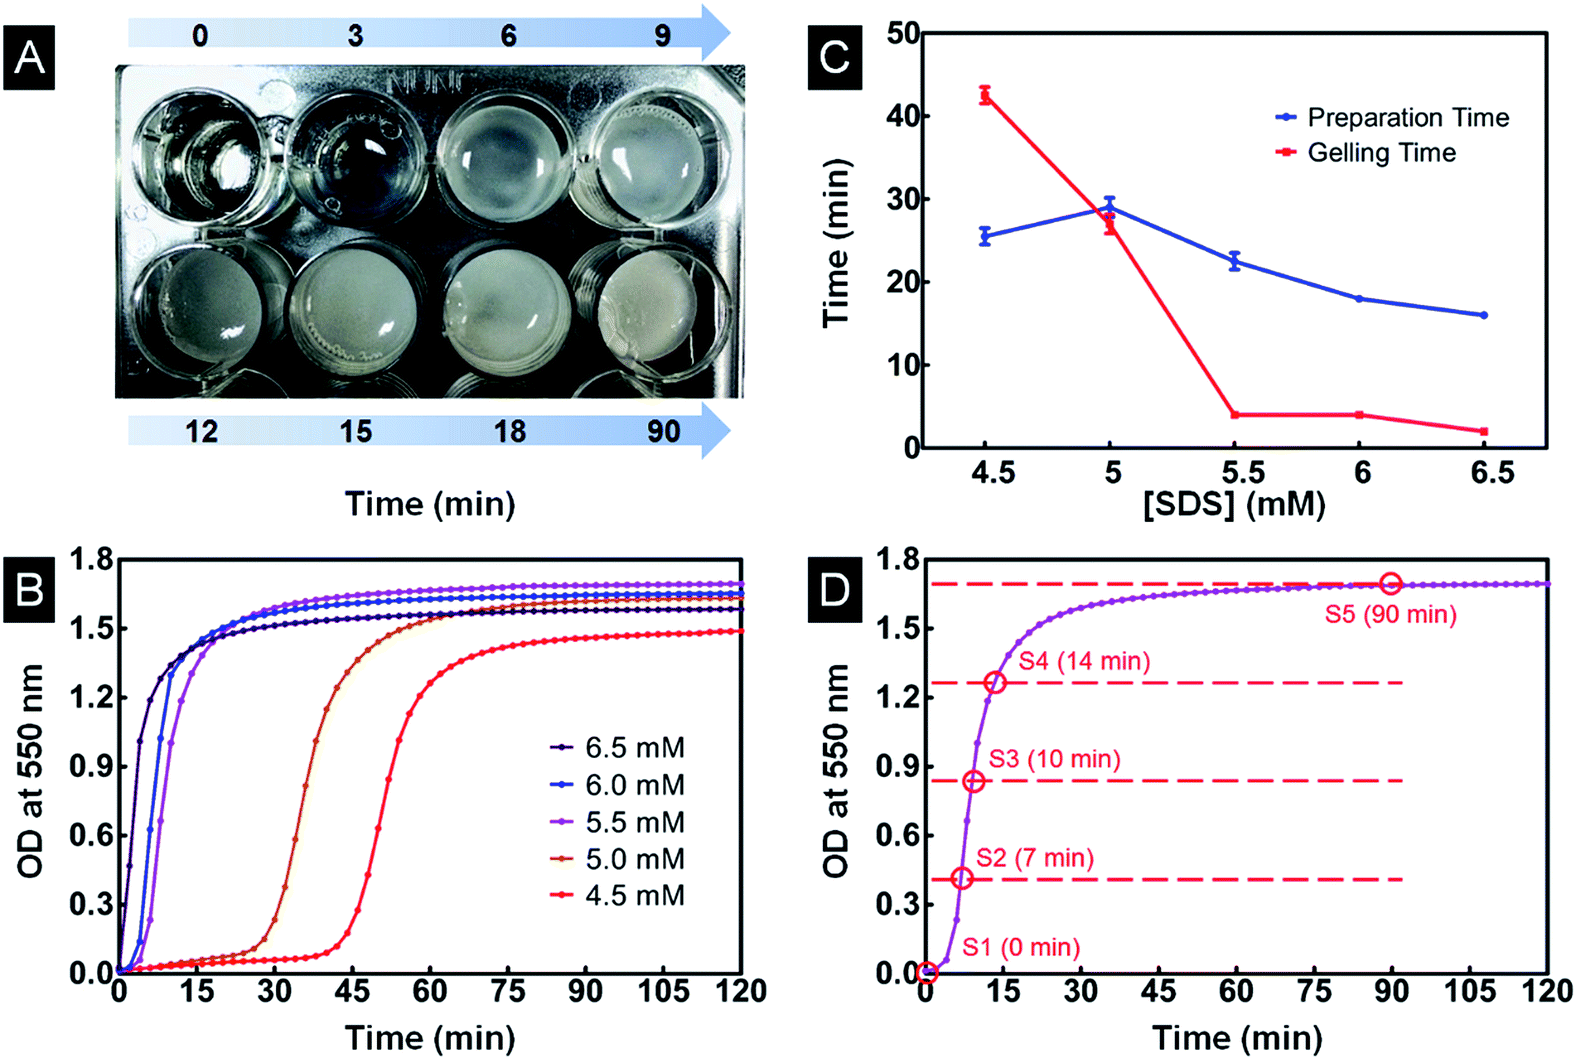 | ||
| Fig. 1 (A) The optical image of SF/agarose mixtures in a 96-well plate showing turbidity change with time at 5.5 mM [SDS]. (B) OD changes of SF/agarose solutions with time at various [SDS]s, [SDS] = 4.5–6.5 mM. (C) PT and GT change as a function of [SDS]. (D) Five time points are selected at equal OD intervals according to the gelation kinetic curve at 5.5 mM [SDS]. | ||
2.4 Characterization of scaffolds crystallinity (β-sheet content)
Fourier transform infrared spectroscopy (FTIR) investigation was carried out using a Thermo Scientific Nicolet iZ10 Spectrometer to evaluate the β-sheet content of scaffolds prepared from different gelation stages. All spectra were recorded at the range of 400–4000 cm−1 with a resolution of 4 cm−1. An attenuated total reflection (ATR) was used to analyze 64 repeated scans. In accordance with previous described procedures,31 the Fourier self-deconvolution (FSD) technique was employed to identify silk secondary structures covering the amide I region (1595–1705 cm−1) of the infrared spectra using Peakfit 4.12 software. FSD spectra were analyzed and curve-fitted to calculate the relative areas of components of the amide I region.2.5 Characterization of scaffolds morphology
The cross-sectional morphology of scaffolds was visualized by scanning electron microscope (SEM, Hitachi SU70). Scaffolds were glued on a copper plate and sputtered with platinum before SEM imaging. The pore diameters of scaffolds were measured by Image-J software. Above 100 different pores were measured from each of the sample sets for the calculation of the average values and the distribution of pore diameters.2.6 Analysis of scaffolds porosity
The porosity of scaffolds was analyzed using a liquid displacement method. Scaffold was submerged in cyclohexane (V1), and the total volume of scaffold with cyclohexane was documented as V2. Then the scaffold was carefully removed from cyclohexane and the remaining cyclohexane volume was recorded as V3. The porosity of the scaffolds was determined using the following equation:| Porosity (%) = (V1 − V3)/(V2 − V3) × 100% |
2.7 Characterization of scaffolds mechanical properties
The compressive properties of the scaffolds in wet state were evaluated by an Instron Microtester 5525X equipped with a 100 N capacity load cell. The cylinder-shaped scaffolds of approximately 10 mm in diameter and 6 mm in height were applied for the measurement. Scaffolds were immersed in water for hydration for 1 h before measuring with a cross-head speed of 2 mm min−1 at 25 °C and 65% RH. The load was applied till the scaffold had been compressed by 50% of its original length. The compressive modulus was determined as the slope of the linear region of the stress–strain curve. Each compressive modulus was collected from at least three samples.2.8 Cell fluorescence imaging
MC3T3-E1 cells, purchased from the Type Culture Collection of the Chinese Academy of Sciences, were used to investigate the biocompatibility of the scaffolds. Cells were maintained in Minimum Essential Medium Alpha with Earle's salts media (Hyclone, China) supplemented with 10% fetal bovine serum (Gibco, China) and 1% penicillin–streptomycin (Gibco, China). Cells were cultured in tissue culture dishes at 37 °C in atmosphere of 5% CO2. Scaffolds were soaked in ultra-pure water for several hours to release SDS from scaffolds. The scaffolds were cut into standard 6 mm diameter discs for culturing in 96-wells. Then the scaffolds were sterilized by 75% ethanol for 30 min and washed by phosphate buffered saline (PBS). The cells were cultured on the scaffolds with a density of 1 × 10⁵ cells per sample. Scaffolds were incubated in an incubator for 1 and 3 days. The cells were stained with Calcein-AM (Sigma, America) before observation using confocal fluorescence microscopy (Leica TCS SP5).2.9 MTT assay
Cell suspension was seeded onto the scaffolds held in the 96-well plate at a density of 500 cells per sample. Tissue culture plate (TCP) was used as control group. After different incubation periods, all samples were washed three times with PBS, and 100 μL of α-MEM was added and mixed with 20 μL of 5 mg mL−1 3-(4,5-dimethyl-2-thiazolyl)-2,5-diphenyl-2-H-tetrazolium bromide (MTT). After 4 h incubation at 37 °C, reagents were replaced with 200 μL of dimethyl sulfoxide (DMSO) followed by agitation. The absorbance at 570 nm was read using a SpectraMax M2 Microplate Reader (Molecular Devices, CA, USA).2.10 ALP activity assay
ALP activity was evaluated to determine the osteogenic capacity of scaffolds following the manufacturer's instructions (Beyotime, China) scaffolds of cylinder shape were cut into thin slices. Cells in a seeding density of 3 × 10³ cells per well were seeded on each scaffolds and incubated for 4 and 7 days. Then samples were carefully washed thrice with PBS and treated with RIPA lysis buffer (Solarbio, China) for 20 min. After removing the sediment by centrifugation, a 50 μL aliquot of each supernatant was transferred to a 96-well plate, followed by adding 50 μL p-nitrophenyl phosphate (pNPP) solution. 100 μL of stop buffer was added to the samples after 20 min incubation at 37 °C, and the absorbance was read in the microplate reader at 405 nm. Total protein content in the supernatant was determined by the bicinchoninic acid (BCA) method using the BCA assay kit (Biotechnology, China). ALP levels were normalized to the total protein content.2.11 Mineralization assay
Alizarin Red staining was used to evaluate cell mineralization on scaffolds. After 10 days culture with cells, samples were rinsed five times with PBS before fixing with 70% ethanol for 10 min. Calcium deposits in bone nodules were stained by 0.2% Alizarin Red S (Solarbio, China) for 30 min and rinsed with distilled water thoroughly. Results were observed under an upright polarizing microscope (DM 6000B).2.12 Statistical analysis
Results are reported as mean ± standard deviation (n = 3). Statistically significant differences analysis was performed by a one-way analysis of variance (ANOVA). P value < 0.05 was considered to be statistically significant.3. Results and discussion
3.1 Gelation kinetics of SF/agarose/SDS solutions
During the gelation process, transparent SF/agarose/SDS solution gradually changed into an opaque hydrogel, accompanied by a gradual decrease in transparency (Fig. 1A). The opaque color was caused by the light scattering from the heterogeneous structure of the silk fibroin gel.17 The optical density changes of the SF/agarose/SDS solution at 550 nm were thus investigated during gelation (Fig. 1B). It has been demonstrated that SDS at low concentration can greatly facilitate the sol–gel transition of SF based on hydrophobic and electrostatic interactions.32 Herein, only low concentration of SDS (4.5, 5, 5.5, 6, 6.5 mM) was used for this study. As illustrated in Fig. 1B, for the [SDS] concentration studied, the gelation process had been greatly accelerated with the increase of [SDS], consistent with previous report.22,32 The gelling time (GT) and preparation time (PT) were determined from time-dependent OD values. GT reflected how fast the gelation process occurs and the PT reflected the lag time before rapid gelation process. As shown in Fig. 1C, PT decreased sharply to zero with increasing [SDS]. GT decreased with the increased concentration of SDS. In order to use gelation process to fabricate SF/agarose scaffolds with desired conformation, the appropriate [SDS] is needed. As the β-sheet content barely changes during PT process,17 it is not necessary to utilize gelation process with long PT ([SDS] lower than 5.0 mM). On the other hand, the longer GT, the easier to control scaffolds structure using gelation process. Thus, 5.5 mM [SDS] was selected for further research owing to its shorter PT and longer GT. Herein, the gelation process was divided equally into four sections by OD value as presented in Fig. 1D. Five samples from each time interval were freeze-dried for further study (Section 2.3) and will be hereafter referred to as S1, S2, S3, S4 and S5.3.2 Structure stability and shape designability of scaffolds
We hypothesized that agarose could improve the stability of silk scaffolds. In order to test this assumption, five lyophilized SF scaffolds from different gelation stage without agarose were prepared using the same method of preparing SF/agarose scaffolds. As shown in Fig. 2A, the SF scaffold without agarose prepared from the beginning of the gelation (P1) dissolved immediately upon contact with water. This is because the scaffold consists mainly of water soluble silk I conformation. The other four silk scaffolds (P2–P5) prepared from the rest of the gelation stages were fragile and difficult to handle (data not shown). By contrast, the incorporation of agarose stabilized scaffolds, and that all scaffolds were water insoluble (Fig. 2B, second row) and easy to handle. Specially, when subjected to high temperature autoclaving, all SF/agarose scaffolds retained the original shapes (Fig. 2B, third row), indicating good stability. Agarose blended fibroin/SDS solution quickly formed elastic hydrogel within a minute when placed at −20 °C (Fig. 2C). On the contrary, fibroin/SDS solution remained liquid. Another advantage of introducing agarose was the shape of scaffold could be easily designed by cutting corresponding hydrogel as shown in Fig. 2D. And further freeze-drying process retained the shape of hydrogel.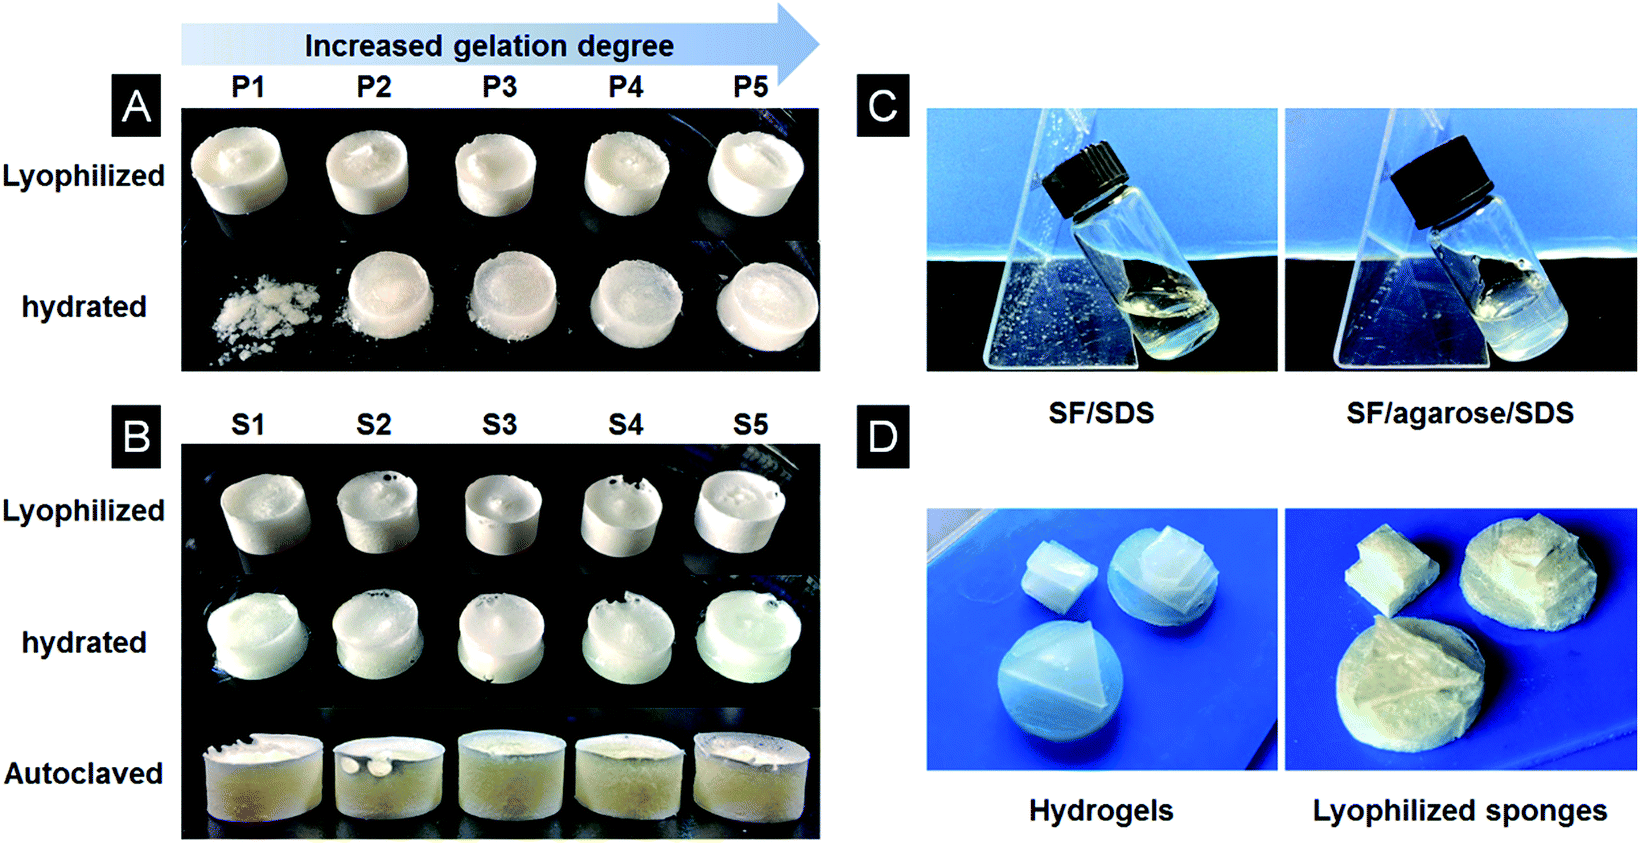 | ||
| Fig. 2 (A) Lyophilized SF scaffolds prepared from different gelation stages and corresponding hydrated samples. (B) Lyophilized SF/agarose scaffolds prepared from different gelation stages and corresponding hydrated or autoclaved samples. (C) SF/SDS and SF/agarose/SDS mixtures after 1 min storage at −20 °C. (D) SF/agarose hydrogels with different shapes and corresponding lyophilized scaffolds. | ||
3.3 Conformation of lyophilized scaffolds
The conformation changes of SF/agarose scaffolds were determined by FTIR as shown in Fig. 3A. Amide I in the infrared spectral region between 1580 and 1720 cm−1 was used for the investigation of different secondary structures of scaffolds. The peaks at 1647–1655 cm−1 were characteristic of random coil, while absorption band at 1625 cm−1 was assigned to β-sheets.31 Scaffold S1 (0 min) had a broad peak at 1640 cm−1, indicating the scaffold was dominated by random coils. When the gelation time increased to 7 min, a weak β-sheet peak began to appear at 1621 cm−1 for sample S2. With the increase of the gelation degree, the β-sheet peaks became sharper, indicating the increase of β-sheet content in corresponding scaffolds. To determine the fraction of individual secondary structure components, the amide I band was resolved by Fourier self-deconvolution analysis FSD based on the second derivative of the original spectra (Fig. S1†),31 FSD of the infrared spectra implied that the β-sheet content escalated significantly from 19.8% to 25.9%, 30.2%, 33.0%, 39.3% in the S1, S2, S3, S4, S5 scaffolds, respectively. On the contrary, random coil content reduced from 26.5% to 22.7%, 21.4%, 19.4%, 15.2%, respectively (Fig. 3B). The increase of the β-sheet content and the decrease of the random coil were linear with the gelation degree. It is thus suggested that SF/agarose scaffolds with desirable β-sheet content could be controlled by gelation process.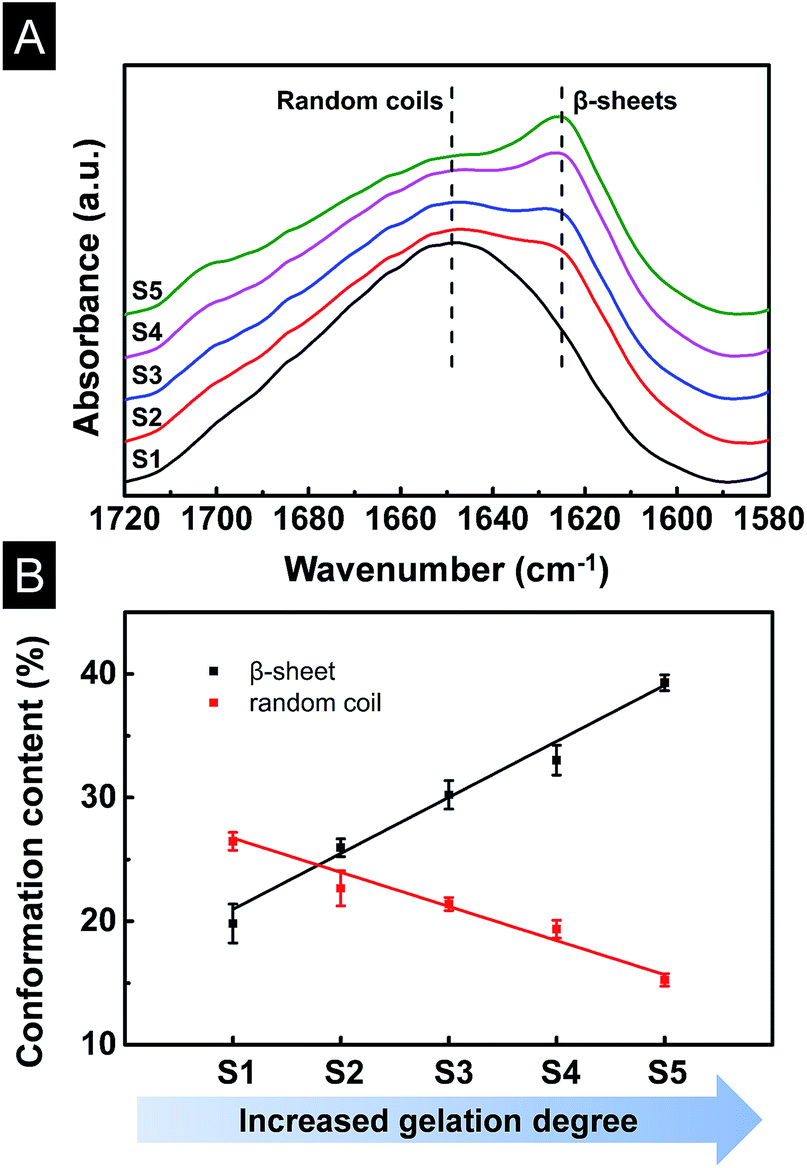 | ||
| Fig. 3 (A) FTIR spectra of SF/agarose scaffolds. S1–S5 represent scaffolds prepared from different gelation stages (Section 3.1). (B) β-sheet and random coil conformation content of SF/agarose scaffolds change with gelation degree. | ||
3.4 Pore morphologies of scaffolds
Previous studies suggested that adequate porous structure could supply sufficient surface for cell adhesion, and facilitate nutrition exchange.33 For example, scaffolds with larger pore size are more conducive to cell diffusion and migration, while scaffolds with smaller pore size provide higher surface area for cell adhesion.34 In this paper, scaffolds with a wide range of pore size were prepared by controlling the gelation degree as shown in Fig. 4. The SEM images of lyophilized SF/agarose scaffolds revealed interconnected porous structures. Obviously, as the gelation degree increased, the pore size increased too. The average pore size and its distribution were obtained by analysing the cross-sectional SEM images of scaffolds (Fig. S2†). The wall thickness also changed from thin wall (<1 μm) to thick wall (∼10 μm) as the gelation degree increased (Fig. 4, lower row).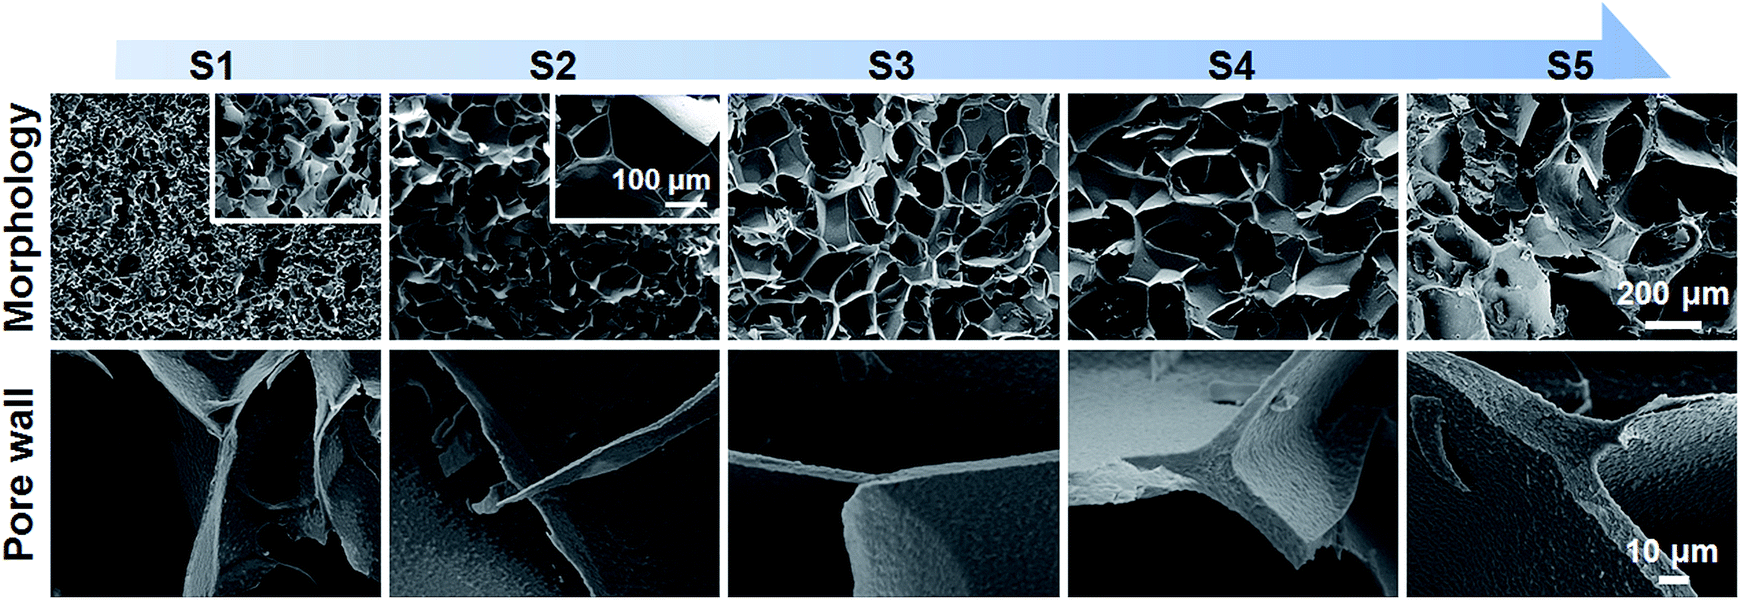 | ||
| Fig. 4 SEM morphologies of SF/agarose scaffolds prepared from different gelation degree. | ||
Fig. 5 is a schematic illustration of scaffolds formation. SF molecules are predominated by random coils before mixture with agarose. Upon mixture, both SF and agarose molecules are freely dispersed in the solution (Fig. 5, stage 1). At the second stage, agarose rapidly forms a gel network within several minutes by virtue of hydrogen bonding.35 With the interaction with the long tail hydrocarbon chain and negative charge of SDS molecules, SF molecules rapidly unfold and expose the hydrophobic regions.22,36 Then agglomeration among SF and SDS molecules occurs due to intermolecular hydrophobic forces, subsequently forming single-domain networks (Fig. 5, stage 2). At the third stage, these single-domain networks grow up by involving more SF molecules and interconnecting multi-domain networks forms (Fig. 5, stage 3). At the last stage, the gelation process completes with formation of entire SF networks (Fig. 5, stage 4).
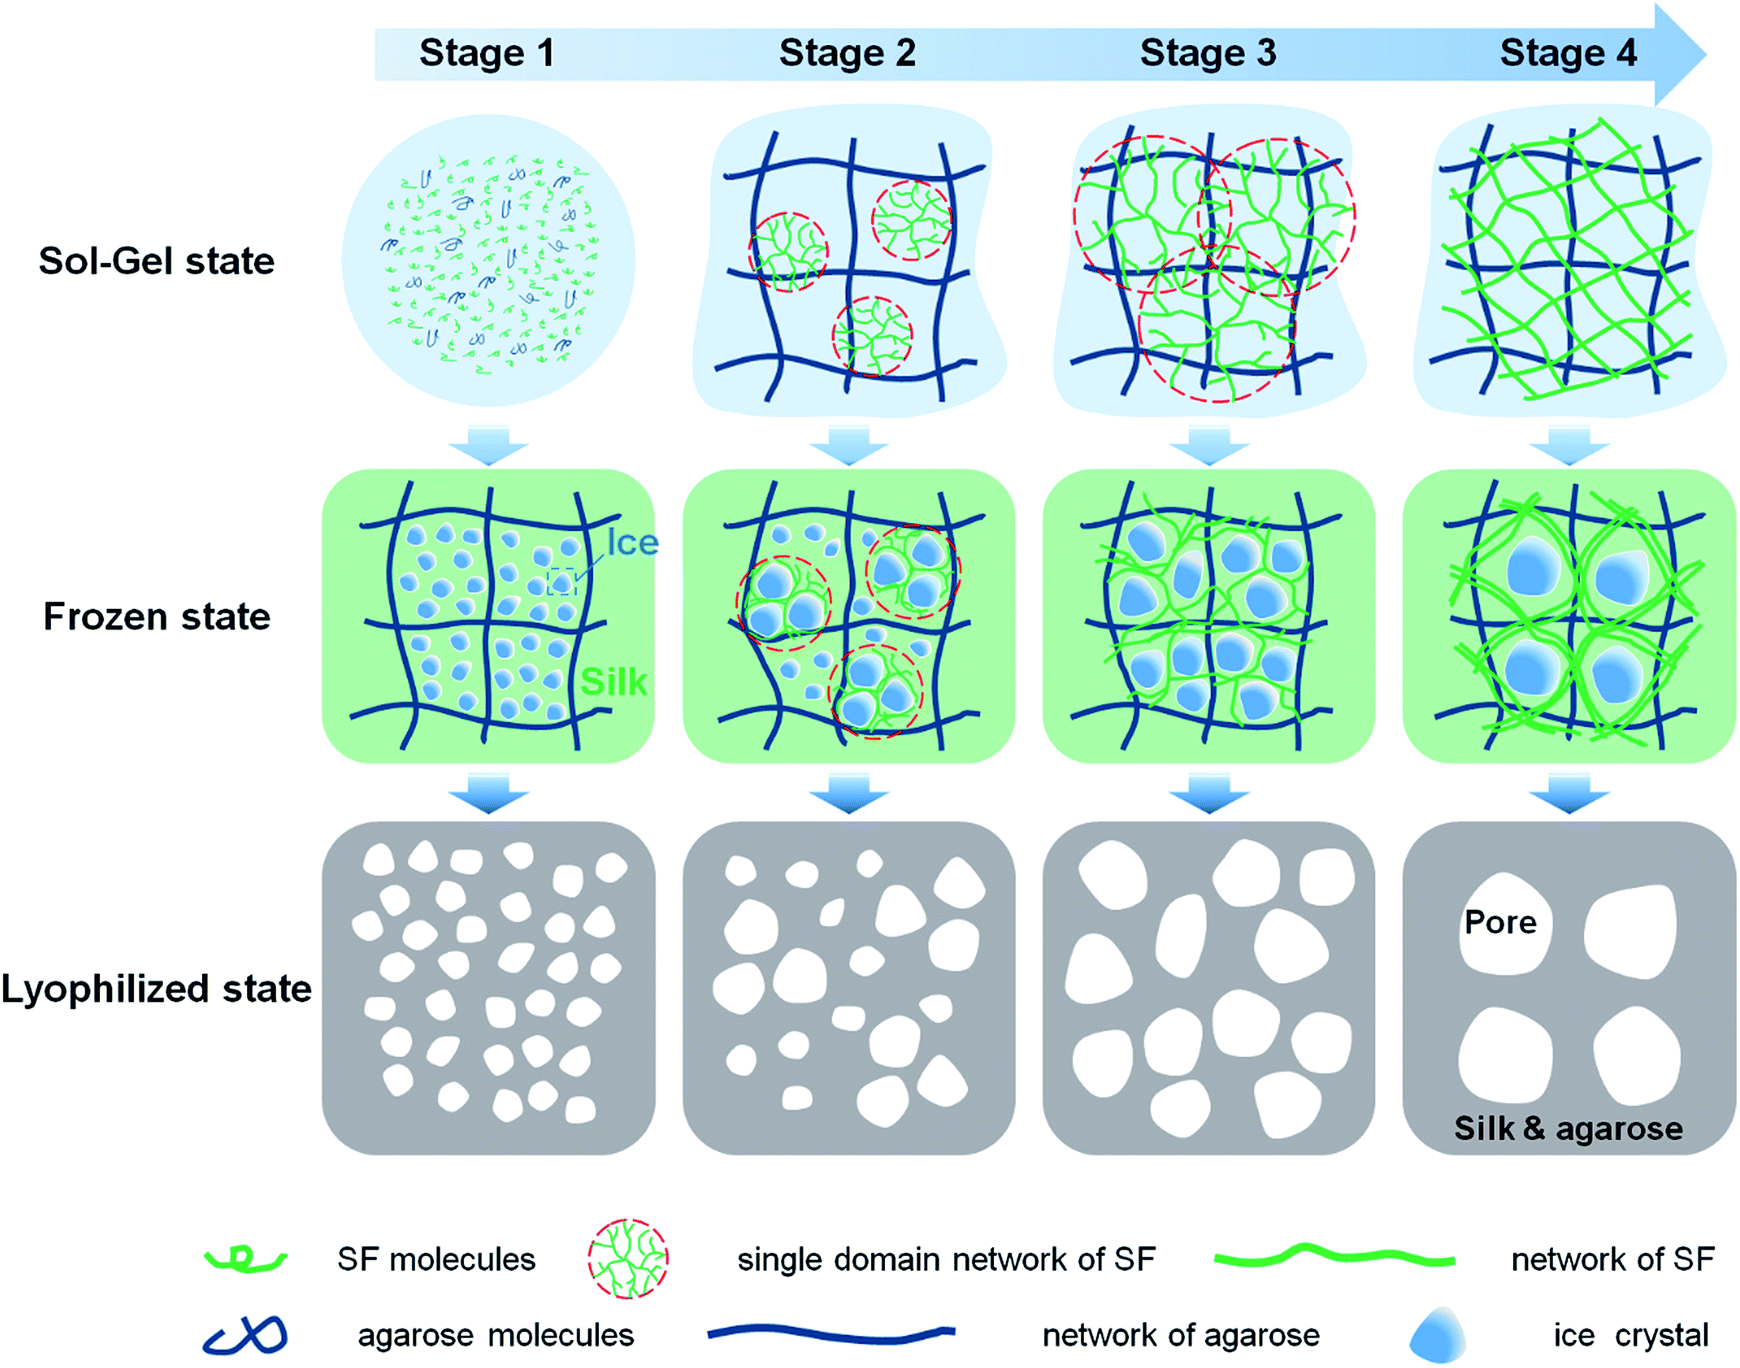 | ||
| Fig. 5 Schematic illustration of the formation of SF/agarose scaffolds. | ||
During the freezing process, with temperature decrease, ice crystals grow that solutes (agarose, silk and SDS) are excluded from the ice.37 At the beginning of the gelation, agarose molecules rapidly form a gel network within a minute upon freezin at −20 °C (data not shown). At this stage, silk fibroin molecules are predominated by random coil and well dispersed and trapped in the agarose gel. Thus, ice crystals are small as the growth of ice crystals is hindered by disordered SF molecules. With the increment of the gelation degree, ice crystals can grow bigger as the SF domain network is larger and less disordered SF molecules left in the solution. Then at drying stage, ice crystals sublimate directly leaving corresponding pore structures. Thus the corresponding pore size of scaffolds is small and the pore wall is thin at the early stage of the gelation. And the pore size and pore wall thickness grow with the increment of gelation degree.
3.5 Porosity and interconnectivity
The porosity and interconnectivity of the scaffolds are substantial characteristics for tissue engineering. A liquid discharge method was introduced to measure the porosity of scaffolds. The porosity gradually changed from 69% to 86% with the increased gelation degree (Fig. 6A), consistent with SEM results. To illustrate pore interconnectivity and elasticity of the scaffolds, a S3 scaffold was used as a representative and placed in a dish containing trypan blue dye. The entire scaffold hydrated fast and appeared blue once exposed to the trypan blue solution, indicating good interconnectivity of the scaffold. When the scaffold was pressed and released, the scaffold quickly restored its shape implying good elasticity (Fig. 6B).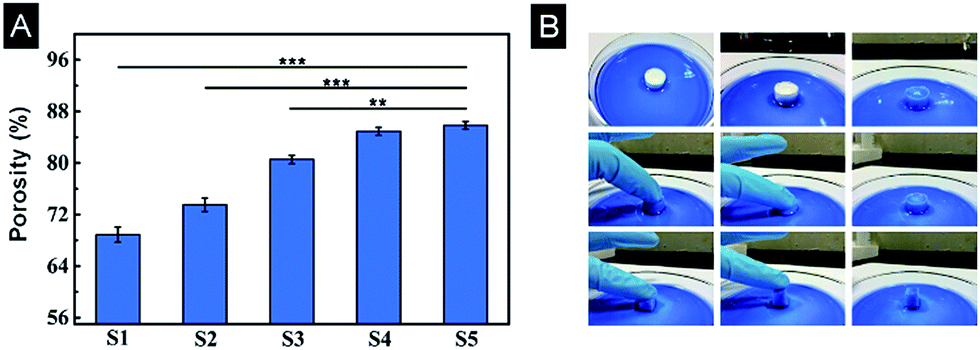 | ||
| Fig. 6 (A) Porosity of SF/agarose scaffolds. Data are shown as mean ± standard deviation, n = 3. (**p ≤ 0.01, ***p ≤ 0.001) (B) A scaffold was placed in a Petri dish filled with trypan blue dye for illustration of the elasticity of the scaffold and dye migration through the scaffold and thus pore interconnectivity. | ||
3.6 Mechanical properties of scaffolds
Scaffolds were hydrated with PBS to simulate the in vivo environment before the compression test. The compression stress–strain curves showed that all scaffolds from different gelation degrees had non-linear stress–strain responses (Fig. 7A). The maximum stress decreased with increasing gelation degree. A typical linear elastic region was found at small strains for all scaffolds, indicating flexural deformation with escalating strain. The compression modulus was determined from the incipiently linear portion of strain–stress curves, as shown in Fig. 7B. Apparently, the compression modulus decreased with increasing gelation degree, 58.8 kPa for S1 scaffold and reduced to 18.6 kPa for S5 scaffold, consistent with the maximum stress (Fig. 7A). The decrease of compression modulus with higher β-sheet could be ascribed to the enlarged pore size and porosity (Sections 3.4 and 3.5). The mechanical change of scaffolds indicates that the compression modulus could be tuned in a large range (18.6–58.8 kPa) by controlling suitable gelation degree.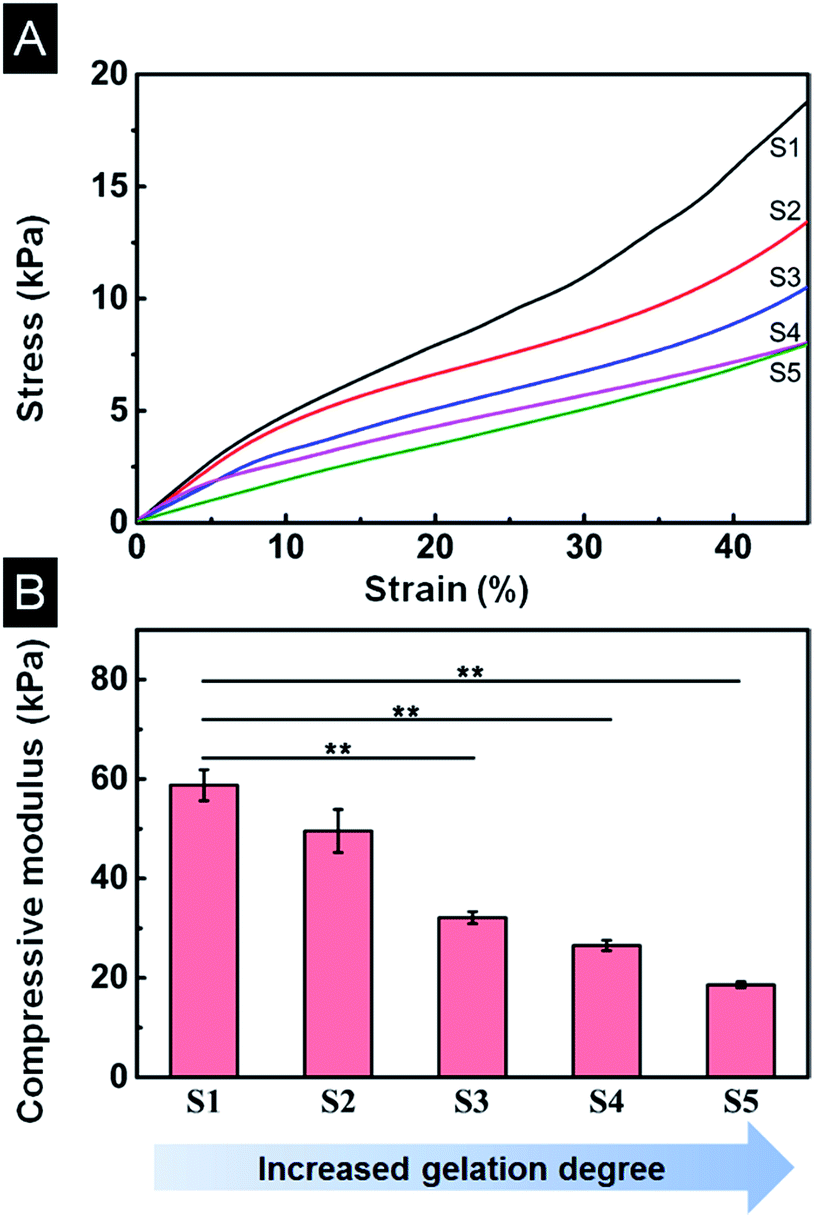 | ||
| Fig. 7 Mechanical properties of SF/agarose scaffolds in wet conditions. (A) Compressive strain–stress curves of scaffolds. (B) Compression modulus of scaffolds. Data are shown as mean ± standard deviation, n = 3 (**p ≤ 0.01). | ||
3.7 In vitro biocompatibility of SF/agarose scaffolds
MC3T3-E1 cells, preosteoblasts derived from mouse calvaria, were used to investigate the biocompatibility of scaffolds. Although SDS content was very low in scaffolds, SDS gradually dissolved in the cell culture media might be toxic for cells. To overcome this problem, scaffolds were pre-soaked in ultra-pure water for several hours to release SDS from scaffolds before cell culture. Cell staining by calcein AM validated cell viability for all kind of scaffolds indicating non-toxic effect of scaffolds (Fig. 8). When cultured for 1 day on scaffolds, cells were independently dispersed in the scaffolds and followed the contours of the scaffold pores. The cell density gradually reduced from S1 to S5 owing to the increasing pore size. When cultured for 3 days, cells grew well and connected to each other on the pore walls. The results indicate SF/agarose hybrid scaffolds are promising for tissue engineering.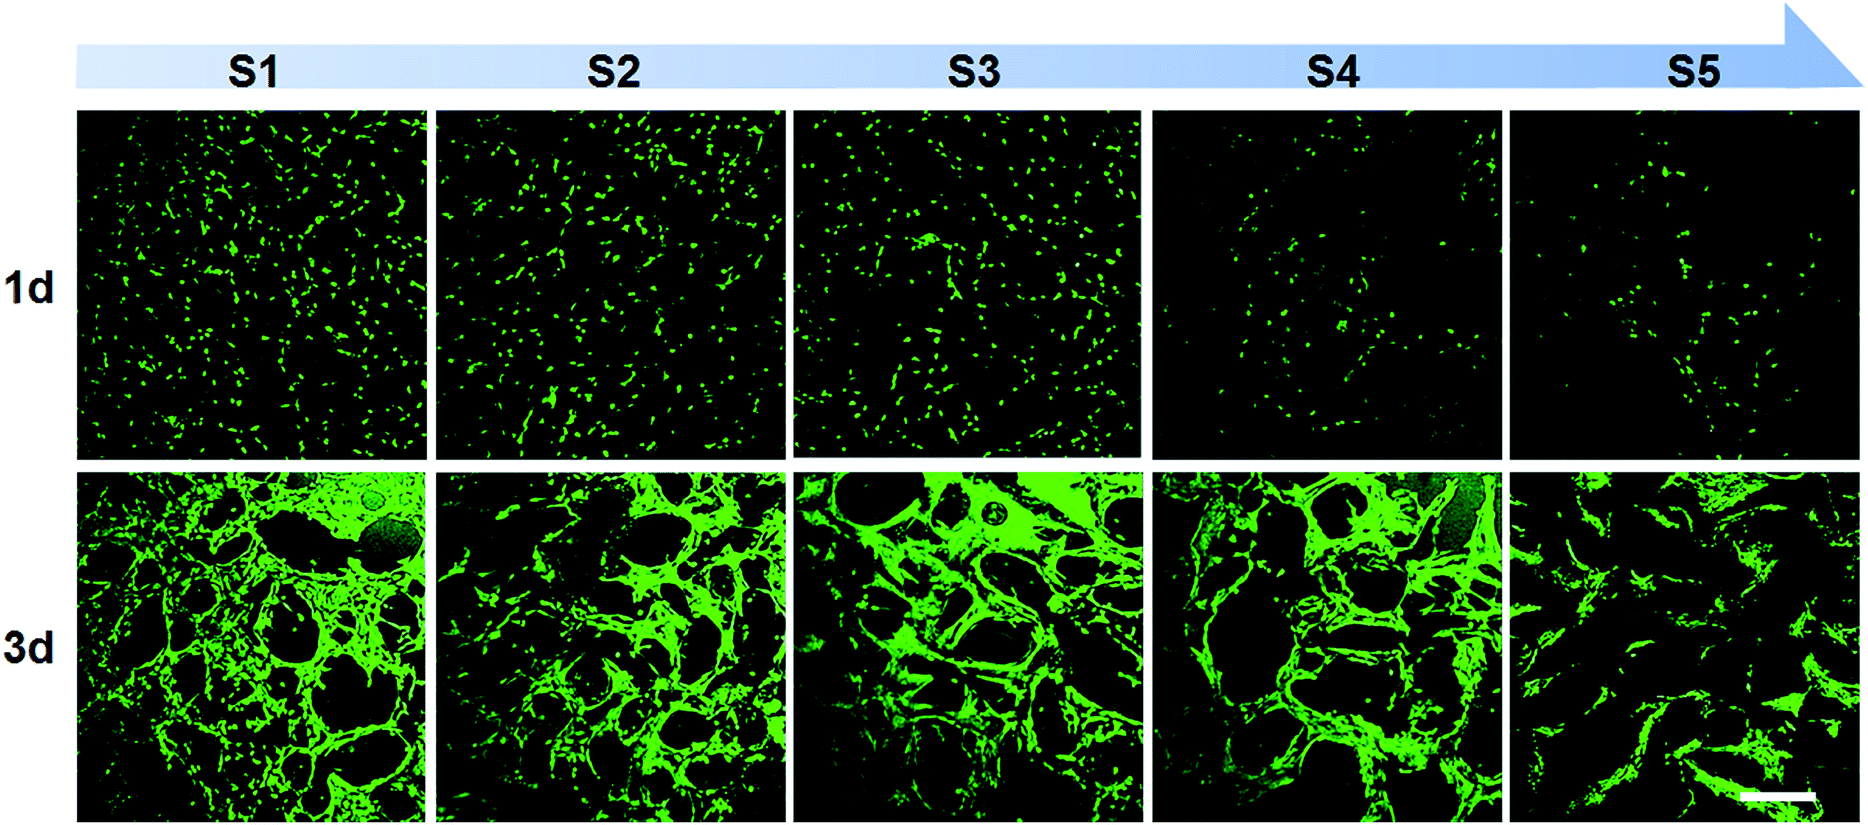 | ||
| Fig. 8 Confocal imaging of calcein AM (live cells, green) staining of MC3T3-E1 cells on SF/agarose scaffolds at day 1, 3 post seeding. Scale bar = 300 μm. | ||
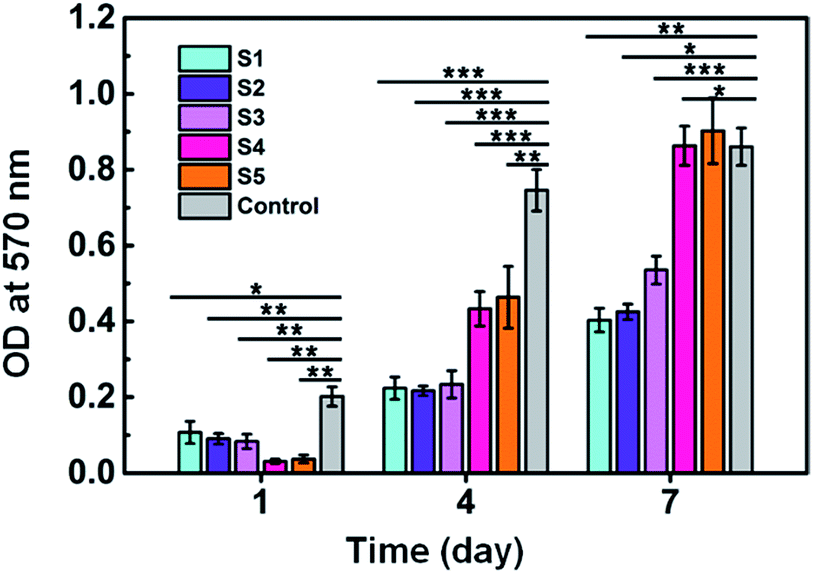
MTT assay was used to evaluate cell proliferation rate on different scaffolds. As shown in Fig. 9, on day 1, the number of cells on TCP (control) was significantly more than SF/agarose scaffolds. This is because cells could penetrate through the scaffolds to the bottom of the plate and result in fewer cells in scaffolds than on plate. Therefore, samples S4 and S5 showed the smallest cells number owing to their larger pore size and relative lower cross sectional area compared to samples S1–S3. After 4 days, cell numbers rapidly increased on all samples. Particularly, cell numbers on samples S4 and S5 exceeded samples S1–S3. 7 days later, the cell numbers on samples S4 and S5 were even higher than control group. This phenomenon could be explained by the following two reasons. First, porous three dimensional scaffolds have large space for osteoblast growth and proliferation comparing to two dimensional surfaces. Second, larger pore size could facilitate cell migration and nutrient/gas exchange.
 | ||
| Fig. 9 MTT analysis of MC3T3-E1 cells. Data are shown as mean ± standard deviation, n = 3 (*p ≤ 0.05, **p ≤ 0.01, ***p ≤ 0.001). | ||
3.8 ALP activity and mineralization analysis
The ALP activities of MC3T3-E1 cells were quantitatively measured to evaluate osteogenic differentiation.38 As shown in Fig. 10A, the ALP activity was highest on sample S1 and lowest on TCP (control) at day 4. And there was no significant difference among sample S2, S3 and S4. At day 7, the ALP activity increased for all samples. Sample S1 displayed the highest ALP activity and TPC showed the lowest value. However, there was no observable difference among other samples. The highest ALP activity on sample S1 might due to its highest mechanical properties (58.8 kPa).38,39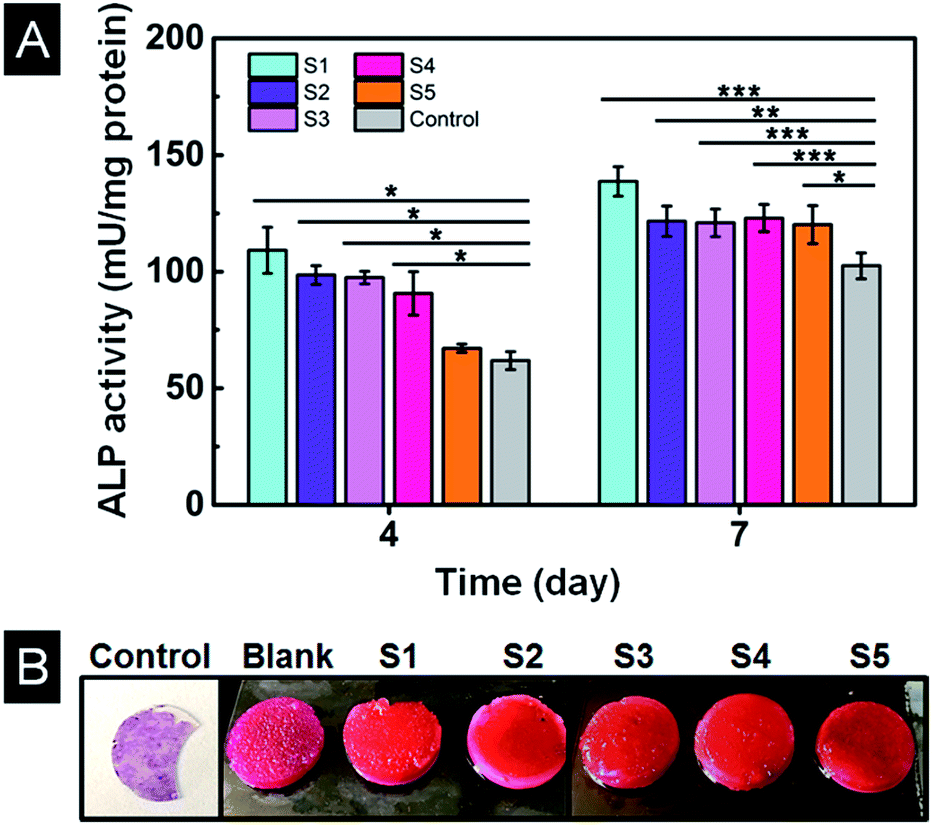 | ||
| Fig. 10 (A) ALP analysis of MC3T3-E1 cells. (B) Alizarin Red-S staining of different scaffolds after 10 days culture. Data are shown as mean ± standard deviation, n = 3 (*p ≤ 0.05, **p ≤ 0.01, ***p ≤ 0.001). | ||
Intracellular calcium deposits mainly occurred in cell calcification period following the increase of ALP activity.40 Alizarin Red-S staining of scaffolds revealed that only a small amount of calcium nodules formed on the control cell culture slide after ten days of culture as shown in Fig. 10B. All the scaffolds showed a clear orange colour comparing to bright pink colour of the scaffold without cells (blank), indicating a large number of calcium nodules had formed on all scaffolds. The colour of sample S1 is a little bit deeper and uniform through the scaffold indicating more calcium nodules were formed, consistent with the result of ALP activity. Thus, scaffold S1 is most promising for osteogenic differentiation and mineralization.
4. Conclusions
Silk-agarose hybrid scaffolds with tunable mechanical property and morphology were fabricated from gelation process. The gelation kinetic of SF/agarose was controlled by SDS and the scaffolds were fabricated via freeze-drying process of the hybrid gels from different gelation degrees. The agarose hybrid silk hydrogels from any gelling degree could be cut into desirable shapes which can be retained after freeze-drying. The relationships between SF/agarose scaffolds properties and silk gelation degree were studied. It was found that the pore size and porosity of scaffolds gradually increased with gelation degree, whereas the compression modulus decreased accordingly. In vitro cell culture indicated all kind of SF/agarose scaffolds had good biocompatibility. Results of alkaline phosphatase (ALP) activity assay and mineralization analysis revealed that scaffolds with higher mechanical properties were more beneficial for osteogenic differentiation. Those results indicated silk-agarose hybrid scaffolds with tunable mechanical property and pore size are potential candidates for tissue engineering.Acknowledgements
Authors gratefully acknowledge financial supports from the State Key Project of Research and Development (2016YFC1100300), National Nature Science Foundation (U1405226, U1505228, 31371012), 111 project (B16029), Guangdong Natural Science Foundation (2016A030310370) and The Fundamental Research Funds for the Central Universities (20720150218).Notes and references
- C. Mason, Regener. Med., 2008, 3, 1–5 CrossRef PubMed.
- D. Williams, The clinical necessity of biomaterials in the twenty-first century, 2014 Search PubMed.
- J. Y. Rho, L. Kuhn-Spearing and P. Zioupos, Med. Eng. Phys., 1998, 20, 92–102 CrossRef CAS PubMed.
- J. C. Iatridis, J. R. Wu, J. A. Yandow and H. M. Langevin, Connect. Tissue Res., 2003, 44, 208–217 CrossRef PubMed.
- S. Bai, H. Han, X. Huang, W. Xu, D. L. Kaplan, H. Zhu and Q. Lu, Acta Biomater., 2015, 20, 22–31 CrossRef CAS PubMed.
- J. Rnjak-Kovacina, L. S. Wray, K. A. Burke, T. Torregrosa, J. M. Golinski, W. Huang and D. L. Kaplan, ACS Biomater. Sci. Eng., 2015, 1, 260–270 CrossRef CAS PubMed.
- D. Y. Yao, S. Dong, Q. Lu, X. Hu, D. L. Kaplan, B. B. Zhang and H. S. Zhu, Biomacromolecules, 2012, 13, 3723–3729 CrossRef CAS PubMed.
- E. K. U. Larsen, N. B. Larsen, K. Almdal, E. K. U. Larsen, N. B. Larsen and K. Almdal, J. Polym. Sci., Part B: Polym. Phys., 2016, 54, 1195–1201 CrossRef CAS.
- M. P. Lutolf and J. A. Hubbell, Nat. Biotechnol., 2005, 23, 47–55 CrossRef CAS PubMed.
- Z. Z. Shao and F. Vollrath, Nature, 2002, 418, 741 CrossRef CAS PubMed.
- Y. Wang, D. D. Rudym, A. Walsh, L. Abrahamsen, H. J. Kim, H. S. Kim, C. Kirker-Head and D. L. Kaplan, Biomaterials, 2008, 29, 3415–3428 CrossRef CAS PubMed.
- A. Schneider, X. Y. Wang, D. L. Kaplan, J. A. Garlick and C. Egles, Acta Biomater., 2009, 5, 2570–2578 CrossRef CAS PubMed.
- X. H. Zhang, C. B. Baughman and D. L. Kaplan, Biomaterials, 2008, 29, 2217–2227 CrossRef CAS PubMed.
- Y. Yang, F. Ding, H. Wu, W. Hu, W. Liu, H. Liu and X. Gu, Biomaterials, 2007, 28, 5526–5535 CrossRef CAS PubMed.
- S. L. McNamara, J. Rnjak-Kovacina, D. F. Schmidt, T. J. Lo and D. L. Kaplan, Biomaterials, 2014, 35, 6941–6953 CrossRef CAS PubMed.
- A. Matsumoto, J. Chen, A. L. Collette, U.-J. Kim, G. H. Altman, P. Cebe and D. L. Kaplan, J. Phys. Chem. B, 2006, 110, 21630–21638 CrossRef CAS PubMed.
- A. Matsumoto, J. Chen, A. L. Collette, U. J. Kim, G. H. Altman, P. Cebe and D. L. Kaplan, J. Phys. Chem. B, 2006, 110, 21630–21638 CrossRef CAS PubMed.
- X. Hu, K. Shmelev, L. Sun, E.-S. Gil, S.-H. Park, P. Cebe and D. L. Kaplan, Biomacromolecules, 2011, 12, 1686–1696 CrossRef CAS PubMed.
- C. H. Chen, J. M. J. Liu, C. K. Chua, S. M. Chou, V. B. H. Shyu and J. P. Chen, Materials, 2014, 7, 2104–2119 CrossRef.
- S. K. Saml, D. L. Kaplan and E. Chiellini, Macromol. Mater. Eng., 2013, 298, 1201–1208 CrossRef.
- U. J. Kim, J. Y. Park, C. M. Li, H. J. Jin, R. Valluzzi and D. L. Kaplan, Biomacromolecules, 2004, 5, 786–792 CrossRef CAS PubMed.
- X. L. Wu, J. Hou, M. Z. Li, J. N. Wang, D. L. Kaplan and S. Z. Lu, Acta Biomater., 2012, 8, 2185–2192 CrossRef CAS PubMed.
- C. W. P. Foo, E. Bini, J. Hensman, D. P. Knight, R. V. Lewis and D. L. Kaplan, Appl. Phys. A: Mater. Sci. Process., 2006, 82, 223–233 CrossRef CAS.
- A. Motta, D. Maniglio, C. Migliaresi, H.-J. Kim, X. Wan, X. Hu and D. L. Kaplan, J. Biomater. Sci., Polym. Ed., 2009, 20, 1875–1897 CrossRef CAS PubMed.
- B. D. Lawrence, F. Omenetto, K. Chui and D. L. Kaplan, J. Mater. Sci., 2008, 43, 6967–6985 CrossRef CAS.
- Q. Zeng, Y. Han, H. Li and J. Chang, J. Mater. Chem. B, 2015, 3, 8856–8864 RSC.
- J. X. Hu, J. B. Ran, S. Chen, P. Jiang, X. Y. Shen and H. Tong, Biomacromolecules, 2016, 17, 2437–2447 CrossRef CAS PubMed.
- L. Meinel, S. Hofmann, V. Karageorgiou, C. Kirker-Head, J. McCool, G. Gronowicz, L. Zichner, R. Langer, G. Vunjak-Novakovic and D. L. Kaplan, Biomaterials, 2005, 26, 147–155 CrossRef CAS PubMed.
- Y. P. Singh, N. Bhardwaj and B. B. Mandal, ACS Appl. Mater. Interfaces, 2016, 8, 21236–21249 CAS.
- D. N. Rockwood, R. C. Preda, T. Yucel, X. Wang, M. L. Lovett and D. L. Kaplan, Nat. Protoc., 2011, 6, 1612–1631 CrossRef CAS PubMed.
- E. Rodenas-Torralba, B. F. Reis, A. Morales-Rubio and M. de la Guardia, Talanta, 2005, 66, 591–599 CrossRef CAS PubMed.
- X. Hu, D. Kaplan and P. Cebe, Macromolecules, 2006, 39, 6161–6170 CrossRef CAS.
- A. Matsiko, J. P. Gleeson and F. J. O'Brien, Tissue Eng., Part A, 2015, 21, 486–497 CrossRef CAS PubMed.
- F. J. O'Brien, B. A. Harley, I. V. Yannas and L. J. Gibson, Biomaterials, 2005, 26, 433–441 CrossRef PubMed.
- B. N. Dai and S. Matsukawa, Carbohydr. Res., 2013, 365, 38–45 CrossRef CAS PubMed.
- A. T. Nguyen, Q. L. Huang, Z. Yang, N. Lin, G. Xu and X. Y. Liu, Small, 2015, 11, 1039–1054 CrossRef CAS PubMed.
- H. Wang, X. Y. Liu, Y. J. Chuah, J. C. H. Goh, J. L. Li and H. Y. Xu, Chem. Commun., 2013, 49, 1431–1433 RSC.
- L. D. Quarles, D. A. Yohay, L. W. Lecer, R. Caton and R. J. Wenstrup, J. Bone Miner. Res., 1992, 7, 683–692 CrossRef CAS PubMed.
- C. A. Mullen, T. J. Vaughan, K. L. Billiar and L. M. McNamara, Biophys. J., 2015, 108, 1604–1612 CrossRef CAS PubMed.
- A. Ehara, K. Ogata, S. Imazato, S. Ebisu, T. Nakano and Y. Umakoshi, Biomaterials, 2003, 24, 831–836 CrossRef CAS PubMed.
Footnote |
| † Electronic supplementary information (ESI) available. See DOI: 10.1039/c7ra01981e |
| This journal is © The Royal Society of Chemistry 2017 |