 Open Access Article
Creative Commons Attribution 3.0 Unported Licence
A rhodamine-based chemosensor with diphenylselenium for highly selective fluorescence turn-on detection of Hg2+ in vitro and in vivo†
Parthiban Venkatesan,
Natesan Thirumalivasan and
Shu-Pao Wu *
*
Department of Applied Chemistry, National Chiao Tung University, Hsinchu 300, Taiwan. E-mail: spwu@mail.nctu.edu.tw; Fax: +886-3-5723764; Tel: +886-3-5712121 ext 56506
First published on 18th April 2017
Abstract
A rhodamine-B based chemosensor with diphenylselenium, RhoSe, has been synthesized, and its detection behavior towards various metal ions is studied via UV/Vis and fluorescence spectroscopy. RhoSe shows a selective response to Hg2+ in CH3OH/H2O (v/v = 9![[thin space (1/6-em)]](https://www.rsc.org/images/entities/char_2009.gif) :
:![[thin space (1/6-em)]](https://www.rsc.org/images/entities/char_2009.gif) 1) solutions over other metal ions. After addition of Hg2+, the solution of RhoSe displays an obvious color change from colorless to pink and a significant, 48-fold fluorescence enhancement. The color change and fluorescence enhancement are attributed to the ring-opening of the spirolactam in the rhodamine fluorophore, which is induced by Hg2+ binding. The binding ratio of RhoSe–Hg2+ was determined by a Job plot as a 1
1) solutions over other metal ions. After addition of Hg2+, the solution of RhoSe displays an obvious color change from colorless to pink and a significant, 48-fold fluorescence enhancement. The color change and fluorescence enhancement are attributed to the ring-opening of the spirolactam in the rhodamine fluorophore, which is induced by Hg2+ binding. The binding ratio of RhoSe–Hg2+ was determined by a Job plot as a 1![[thin space (1/6-em)]](https://www.rsc.org/images/entities/char_2009.gif) :
:![[thin space (1/6-em)]](https://www.rsc.org/images/entities/char_2009.gif) 1 ratio, and the effective pH range for Hg2+ detection was 4.0–10. Importantly, the reversibility of the RhoSe–Hg2+ complex was observed through the addition of Na2S. For practical applications, the strip method was utilized to detect Hg2+ in water/methanol solution. In addition, confocal fluorescence microscopy experiments demonstrated that RhoSe is an effective fluorescent probe for Hg2+ detection in vitro and in vivo.
1 ratio, and the effective pH range for Hg2+ detection was 4.0–10. Importantly, the reversibility of the RhoSe–Hg2+ complex was observed through the addition of Na2S. For practical applications, the strip method was utilized to detect Hg2+ in water/methanol solution. In addition, confocal fluorescence microscopy experiments demonstrated that RhoSe is an effective fluorescent probe for Hg2+ detection in vitro and in vivo.
Introduction
There is a growing demand to develop selective and sensitive chemosensors for toxic metal ions in environmental and biological studies.1–4 Mercury is known as a highly toxic heavy metal even at very low concentrations. Mercury can be found in various products, such as batteries, light bulbs, and thermometers. Three forms of mercury exist: metallic mercury, ionic mercury, and organic mercury. Metallic mercury can be converted into methylated forms, mainly methylmercury and dimethylmercury, by bacteria.5,6 Mercury ions show high affinities with the thiol groups in proteins, and their accumulation in the body has harmful effects on the brain, central nervous system, and kidneys. Minamata disease, discovered in Minamata city, Japan, is a typical disease caused by severe mercury poisoning.7 Due to the high toxicity of mercury, the highest permitted concentration of mercury in environmental and dietary samples has been established by the EPA in the USA as 2 ppb.8Many analytical methods for mercury determination in environmental and clinical samples have been developed, such as inductively coupled plasma atomic emission spectrometry (ICP-AES),9 atomic absorption spectroscopy (AA),10 electrochemical method11 and inductively coupled plasma mass spectrometry (ICP-MS).12 Fluorescence chemosensors provide a direct way for mercury detection due to their high sensitivity, selectivity, and their applications in environmental and biological analysis.13–25 Among various available fluorophores, rhodamine is remarkable due to its exceptional optical properties, such as a long absorption and emission wavelength, high extinction coefficient and quantum yield, and low detection limit.4,26 Furthermore, rhodamine exists in two forms, a spirolactam (non-fluorescent) form and a ring-opened amide (fluorescent) form, providing an ideal model for the design of metal ion sensing with light “off–on” switching. Binding metal ions to rhodamine derivative induces ring-opening of rhodamine. This resulted in a red emission and a color change from colorless to pink because of a shift in the equilibrium state from a spirolactam to a ring-open amide.27–35
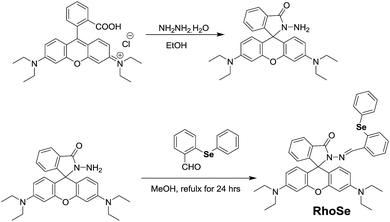
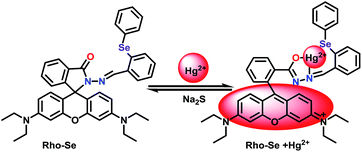
In this work, a chemosensor RhoSe containing a rhodamine B hydrazide linked with diphenyl selenium was synthesized for Hg2+ detection (Scheme 1). Due to its spirolactam form, RhoSe has no visible absorption and is colorless. The binding of Hg2+ to the chemosensor RhoSe induced a switch from the spirolactam form to the ring-opened amide form, which was observed as a pink color. More importantly, RhoSe could potentially be applied to test strips, living cell imaging, and zebrafish studies.
Results and discussion
Synthesis of RhoSe
The chemosensor RhoSe was synthesized by the reaction of rhodamine B hydrazide and 2-(phenylselanyl) benzaldehyde to form a Schiff base (Scheme 1). RhoSe was characterized by 1H NMR, 13C NMR, and HRMS (ESI) (see the ESI†).The selectivity towards metal ions measured by UV-visible and fluorescence spectra
The metal ion detection ability of chemosensor RhoSe was further evaluated. Fig. 1 shows the metal ion selectivity of RhoSe; only Hg2+ causes a color change and produces a yellow fluorescence. Other metal ions cause no change in the fluorescence and color. Fig. 2 shows the UV/Vis and fluorescence spectra of chemosensor RhoSe in the presence of several metal ions. Only Hg2+ caused significant absorption and emission peaks at 561 and 584 nm, respectively. Hg2+ titration of chemosensor RhoSe was monitored by UV/Vis spectra (Fig. 3a). During the sequential addition of Hg2+ ions, a new absorption band at 561 nm was observed with an intense pink color. Free RhoSe does not exhibit any absorption peak in the visible region due to its spirocyclic form. When RhoSe binds with Hg2+, the binding induces the ring-opening of rhodamine, resulting in the pink color. During Hg2+ titration, an emission peak at 584 nm was produced (Fig. 3b). Based on the fluorescence titration profile, the detection limit of RhoSe for the Hg2+ ion was calculated to be 12 nM (see Fig. S5 in the ESI†).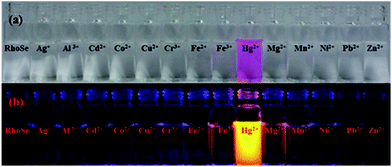 | ||
Fig. 1 (a) Color and (b) fluorescence changes of RhoSe (100 μM) with metal ions (100 μM) in CH3OH/H2O (v/v = 9![[thin space (1/6-em)]](https://www.rsc.org/images/entities/char_2009.gif) : :![[thin space (1/6-em)]](https://www.rsc.org/images/entities/char_2009.gif) 1) solution. 1) solution. | ||
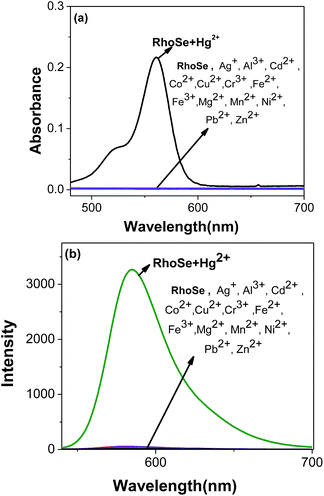 | ||
Fig. 2 Absorption and fluorescence spectra of RhoSe (10.0 μM) in the presence of different metal ions in CH3OH/H2O (v/v = 9![[thin space (1/6-em)]](https://www.rsc.org/images/entities/char_2009.gif) : :![[thin space (1/6-em)]](https://www.rsc.org/images/entities/char_2009.gif) 1) solution. 1) solution. | ||
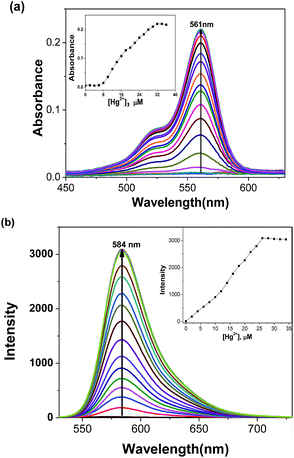 | ||
Fig. 3 Absorption and fluorescence titration spectra of RhoSe (10 μM) with gradual addition of Hg2+ in CH3OH/H2O (v/v = 9![[thin space (1/6-em)]](https://www.rsc.org/images/entities/char_2009.gif) : :![[thin space (1/6-em)]](https://www.rsc.org/images/entities/char_2009.gif) 1) solution. 1) solution. | ||
In order to quantify the effective fluorogenic change, a quantum yield calculation was carried out. The quantum yield of RhoSe was found to be as low as Φ = 0.006. Upon coordination with Hg2+, the quantum yield of RhoSe–Hg2+ was Φ = 0.29, which is a 48-fold enhancement. Next, the binding ratio of RhoSe–Hg2+ was evaluated by Job plot experiments. The fluorescence intensity at 584 nm was plotted against the molar fraction of RhoSe. The highest fluorescence intensity was reached at a molar fraction of 0.5, indicating that RhoSe binds to Hg2+ with a 1![[thin space (1/6-em)]](https://www.rsc.org/images/entities/char_2009.gif) :
:![[thin space (1/6-em)]](https://www.rsc.org/images/entities/char_2009.gif) 1 ratio (see Fig. S6 in the ESI†). ESI mass spectra also provided further support for a 1
1 ratio (see Fig. S6 in the ESI†). ESI mass spectra also provided further support for a 1![[thin space (1/6-em)]](https://www.rsc.org/images/entities/char_2009.gif) :
:![[thin space (1/6-em)]](https://www.rsc.org/images/entities/char_2009.gif) 1 metal complex, with m/z = 1002.13 (see Fig. S7 in the ESI†). Furthermore, the binding constant was obtained as 7.44 × 10⁴ M−1, which indicates the strong binding affinity of RhoSe for the Hg2+ ion (see Fig. S8 in the ESI†).
1 metal complex, with m/z = 1002.13 (see Fig. S7 in the ESI†). Furthermore, the binding constant was obtained as 7.44 × 10⁴ M−1, which indicates the strong binding affinity of RhoSe for the Hg2+ ion (see Fig. S8 in the ESI†).
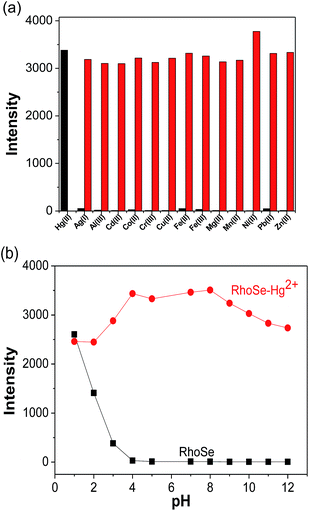
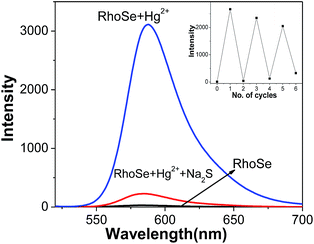
To further evaluate the influence of other metal ions, experiments with coexisting ions were carried out. RhoSe (10 μM) was examined with various metal ions in the presence of Hg2+. As shown in Fig. 4a, the fluorescence intensity with coexisting ions is similar to that from Hg2+ alone. This observation indicates that there was no interference from the other metal ions. Owing to the importance of pH, we also studied the emission behavior of RhoSe towards the Hg2+ ion with respect to different pH environments. As shown in Fig. 4b, only a low emission intensity was observed for RhoSe at pH 4.0–10.0. When the pH is lower than 4, the emission intensity increases remarkably; this is due to the protonation-induced ring opening in RhoSe. With Hg2+, a high emission intensity at 584 nm was observed at pH 4.0–10. Furthermore, the emission intensity of RhoSe decreased slightly when the pH was higher than 10.0. This is due to the reduced stability of RhoSe–Hg2+ at high pH values. These observations confirm that RhoSe can be used to detect Hg2+ over a wide pH range. In order to examine the reversibility of RhoSe–Hg2+, Na2S was added to remove the Hg2+. In Fig. 5, the emission peak at 584 nm decreased after the addition of Na2S. With further addition of Hg2+, the fluorescence of RhoSe–Hg2+ was regained. The collective data clearly indicates the reversible binding character of the chemosensor RhoSe to Hg2+.
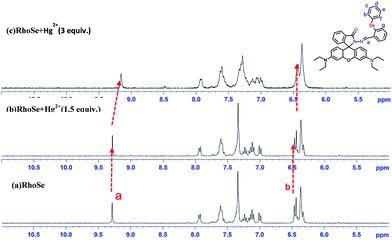
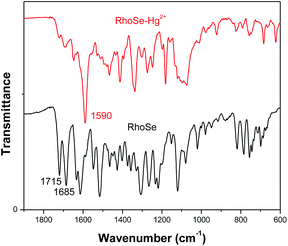
We further performed Hg2+ titrations monitored by 1H NMR to determine the binding interaction between RhoSe and Hg2+. As a heavy metal ion, Hg2+ affects the proton signals near the Hg2+ binding site.36 The 1H NMR signal of the imine nitrogen proton (–CH![[double bond, length as m-dash]](https://www.rsc.org/images/entities/char_e001.gif) N) was shifted upfield upon the addition of Hg2+ (Fig. 6). Two protons signals, Hb and Hf, which are located adjacent to the selenium atom on the diphenyl-selenium moiety, were also shifted upfield and became much broader after the sequential addition of Hg2+ ions. Furthermore, the IR spectra of RhoSe and RhoSe–Hg2+ were recorded (Fig. 7). Without Hg2+, two peaks at 1715 cm−1 and 1684 cm−1 are the strength mode of the carbonyl oxygen (C
N) was shifted upfield upon the addition of Hg2+ (Fig. 6). Two protons signals, Hb and Hf, which are located adjacent to the selenium atom on the diphenyl-selenium moiety, were also shifted upfield and became much broader after the sequential addition of Hg2+ ions. Furthermore, the IR spectra of RhoSe and RhoSe–Hg2+ were recorded (Fig. 7). Without Hg2+, two peaks at 1715 cm−1 and 1684 cm−1 are the strength mode of the carbonyl oxygen (C![[double bond, length as m-dash]](https://www.rsc.org/images/entities/char_e001.gif) O). After addition of Hg2+ ions, the peak corresponding to the carbonyl oxygen (C
O). After addition of Hg2+ ions, the peak corresponding to the carbonyl oxygen (C![[double bond, length as m-dash]](https://www.rsc.org/images/entities/char_e001.gif) O) in rhodamine disappeared. In addition, a new stretching frequency at 1618 cm−1 (C
O) in rhodamine disappeared. In addition, a new stretching frequency at 1618 cm−1 (C![[double bond, length as m-dash]](https://www.rsc.org/images/entities/char_e001.gif) N) is corresponding to its ring opened amide conformation. The collective data indicates that Hg2+ binds to RhoSe through the selenium atom at a diphenyl-selenium moiety, one nitrogen atom, and one oxygen atom. Some recently reported fluorescence Hg2+-sensors based on rhodamine derivatives are shown in Table 1. Some rhodamine based Hg2+ sensors show response to Hg2+ and the other metal ions, such as Cu2+ and Zn2+. The probe RhoSe only responses to Hg2+ with a low detection limit 12 nM. Also, the probe RhoSe can be applied in test strip detection and bioimaging in cells and zebrafish.
N) is corresponding to its ring opened amide conformation. The collective data indicates that Hg2+ binds to RhoSe through the selenium atom at a diphenyl-selenium moiety, one nitrogen atom, and one oxygen atom. Some recently reported fluorescence Hg2+-sensors based on rhodamine derivatives are shown in Table 1. Some rhodamine based Hg2+ sensors show response to Hg2+ and the other metal ions, such as Cu2+ and Zn2+. The probe RhoSe only responses to Hg2+ with a low detection limit 12 nM. Also, the probe RhoSe can be applied in test strip detection and bioimaging in cells and zebrafish.
| Materials | Methods/analyte (LOD) | Solvent | Comments | Ref. |
|---|---|---|---|---|
| Rhodamine derivative | Fluorescence on Cu2+ (1.63 μM) | EtOH/H2O (10 mM HEPES, pH 7.4) 4![[thin space (1/6-em)]](https://www.rsc.org/images/entities/char_2009.gif) : :![[thin space (1/6-em)]](https://www.rsc.org/images/entities/char_2009.gif) 1 1 |
Response to Cu2+ and Hg2+, cell imaging | 27 |
| Hg2+ (2.36 μM) | ||||
| Rhodamine derivative | Fluorescence on Hg2+ (0.067 μM) | EtOH/H2O (1/1, v/v) | High selectivity | 28 |
| Rhodamine derivative | Fluorescence on Hg2+ (3.2 nM) | EtOH/H2O (1/1, v/v) | High selectivity, cell imaging | 29 |
| Rhodamine derivative | Fluorescence on Hg2+ | EtOH–H2O (8![[thin space (1/6-em)]](https://www.rsc.org/images/entities/char_2009.gif) : :![[thin space (1/6-em)]](https://www.rsc.org/images/entities/char_2009.gif) 2 v/v, PBS, pH 7.1) 2 v/v, PBS, pH 7.1) |
High selectivity | 30 |
| Rhodamine derivative | Fluorescence on Zn2+ (2.21 μM) | CH3CN/H2O (HEPES, 2.5 mM, pH 7) 8![[thin space (1/6-em)]](https://www.rsc.org/images/entities/char_2009.gif) : :![[thin space (1/6-em)]](https://www.rsc.org/images/entities/char_2009.gif) 2 2 |
Response to Zn2+ and Hg2+, cell imaging | 31 |
| Hg2+ (2.16 μM) | ||||
| Rhodamine derivative | Fluorescence on Hg2+ (32 nM) | CH3CN/H2O 1![[thin space (1/6-em)]](https://www.rsc.org/images/entities/char_2009.gif) : :![[thin space (1/6-em)]](https://www.rsc.org/images/entities/char_2009.gif) 1 1 |
Response to Cu2+ and Hg2+ | 32 |
| Rhodamine derivative | Fluorescence on Hg2+ (9.32 nM) | CH3OH/H2O (phosphate, pH 7.0) 1![[thin space (1/6-em)]](https://www.rsc.org/images/entities/char_2009.gif) : :![[thin space (1/6-em)]](https://www.rsc.org/images/entities/char_2009.gif) 2 2 |
Response to Hg2+ and uric acid, cell imaging | 33 |
| Uric acid (15.4 nM) | ||||
| Rhodamine derivative | Fluorescence on Hg2+ (12 nM) | CH3CN/H2O 9![[thin space (1/6-em)]](https://www.rsc.org/images/entities/char_2009.gif) : :![[thin space (1/6-em)]](https://www.rsc.org/images/entities/char_2009.gif) 1 1 |
Highly selective and sensitive, good reversibility, strip method and used in vitro and in vivo | This work |
According to the collective results, the binding mechanism is shown in Scheme 2. When the probe RhoSe is in the spirolactam form, it has no visible absorption and is colorless. Upon the complexation of RhoSe with Hg2+, Hg2+ binding induced a switch from the spirolactam form to the ring-opened amide form, which was observed as a pink color.
In order to elucidate the structures of RhoSe and RhoSe–Hg2+, density functional theory (DFT) calculations using the Gaussian 09 software package were carried out. We applied the B3LYP/LANL2DZ energy optimization to determine the optimal structures of RhoSe and RhoSe–Hg2+ (Fig. 8). The structure of RhoSe–Hg2+ shows that Hg2+ binds to the chemosensor RhoSe by one nitrogen atom, one oxygen atom, and one selenium atom at distances of 2.30, 2.20, and 2.70 Å, respectively. The energy gaps between the HOMO and LUMO levels of RhoSe and RhoSe–Hg2+ are ΔE = 3.81 eV and 1.08 eV, respectively (see Fig. S9 in the ESI†). RhoSe–Hg2+ has a smaller energy gap compared with that of RhoSe.
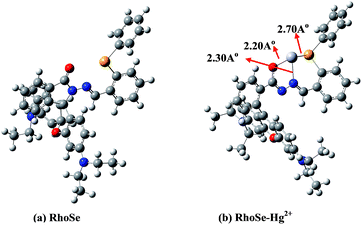 | ||
| Fig. 8 DFT-optimized structures of (a) RhoSe and (b) RhoSe–Hg2+ complex using the B3LYP/LanL2DZ method. Black atom, C; blue atom, N; red atom, O; yellow atom, Se; gray atom, Hg. | ||
Application of RhoSe in test strips
To apply the chemosensor RhoSe to a practical use, test strips were prepared by immersing filter paper in RhoSe solution, followed by drying in air. The selectivity of the test strips for various metal ions was first evaluated (see Fig. S10 in the ESI†). Only in the presence of Hg2+ were a pink color and yellow emission observed; other metal ions did not cause any color or fluorescence changes in the test strips. In addition, the test strips were immersed in different concentrations of Hg2+, and exhibited a clear color change from colorless to pink with increasing Hg2+ concentration (Fig. 9). The detection limit of the test strips was found to be 1 × 10⁻⁶ M, allowing for sensitive detection of Hg2+ ions.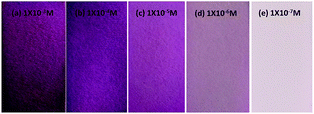 | ||
| Fig. 9 Colorimetric test strips of RhoSe (1 mM) with Hg2+. (a) 1 × 10⁻³ M, (b) 1 × 10⁻⁴ M, (c) 1 × 10⁻⁵ M, (d) 1 × 10⁻⁶ M, (e) 1 × 10⁻⁷ M. | ||
Bioimaging of RhoSe
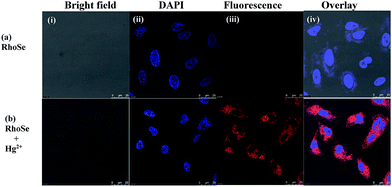
The bioimaging potential of RhoSe for Hg2+ was further explored. Firstly, the cytotoxicity of RhoSe was evaluated by an MTT assay using HeLa cells. The cellular viability of HeLa cells treated with RhoSe was greater than 80%, which indicates a low cytotoxicity of RhoSe (<20 μM) (see Fig. S11 in the ESI†). Thereafter, RhoSe was applied to image Hg2+ using confocal fluorescence microscopy. Fig. 10a shows that no fluorescence was observed from HeLa cells treated with RhoSe. With Hg2+, a bright red fluorescence emission in the HeLa cells can be clearly observed (Fig. 10b). The overlay image revealed that the red fluorescence was distributed throughout the intracellular area. This observation shows the good cell-membrane permeability of RhoSe.Fluorescence imaging experiments of RhoSe in zebrafish
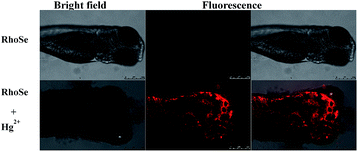
Furthermore, RhoSe was used for Hg2+ imaging in zebrafish. First, 3 day-old fish were treated with the chemosensor RhoSe (20 μM) for 30 min at 28 °C. No red fluorescence was found (Fig. 11a). With Hg2+, a strong red fluorescence in the 3 day-old zebrafish was observed (Fig. 11b). Remarkably, the organs in the zebrafish, such as the heart, liver, and brain, were clearly seen.37,38 In addition, a lower fluorescence intensity was observed in the brain (Fig. 12). This indicates a relatively lower level of mercury in the brain. The zebrafish fluorescent images demonstrate that the chemosensor RhoSe can be used to study the accumulation of mercury species in vivo.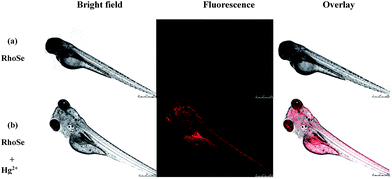 | ||
| Fig. 11 Confocal microscopy images of 3 day-old zebrafish. (a) The zebrafish incubated with RhoSe (20 μM) for 30 min. (b) Subsequent treatment with Hg2+ (60 μM) for 30 min. | ||
Experimental
Instruments
Hitachi F-7000 fluorescence spectrophotometer was used for fluorescence spectra measurements. 1H and 13C NMR spectra were obtained with a 300 MHz Bruker spectrometer. UV/Vis spectra were recorded on an Agilent 8453 UV/Vis spectrometer. Fluorescence microscope images were obtained from a Leica TCS SP5 X AOBS Confocal Fluorescence Microscope.Synthesis of RhoSe
Rhodamine B hydrazide39 (500 mg, 1.0 mmol) and 2-(phenylselanyl) benzaldehyde40 (314 mg, 1.1 mmol) were added to methanol (20 mL). The reaction mixture was refluxed for 24 h. The subsequent precipitate was filtrated and column chromatography (DCM: hexane = 1![[thin space (1/6-em)]](https://www.rsc.org/images/entities/char_2009.gif) :
:![[thin space (1/6-em)]](https://www.rsc.org/images/entities/char_2009.gif) 1) was used to purify the compound. Yield: 698 mg (89%). Melting point: 178–180 °C. 1H NMR (300 MHz, DMSO-d6): δ 9.28 (s, 1H), 7.93 (d, 1H, J = 7.2 Hz), 7.60 (t, 3H, J = 6.3 Hz), 7.33 (s, 4H), 7.23 (t, 3H, J = 7.5Hz), 7.16–7.09 (m, 2H), 7.0 (d, 1H, J = 7.8Hz), 6.51–6.28 (m, 7H), 3.25 (q, 8H, J = 6.6 Hz), 1.01 (t, 12H, J = 6.6 Hz); 13C NMR (75 MHz, DMSO-d6): 164.2, 153.1, 152.0, 149.0, 148.8, 135.2, 134.5, 134.4, 134.1, 131.9, 130.7, 130.5, 130.0, 129.2, 129.0, 128.7, 128.3, 126.8, 124.3, 123.4, 108.5, 105.5, 97.9, 66.0, 44.1, 12.7. MS (ESI): m/z = 701.2 ([M + H]+); HRMS (ESI): calcd for C41H41N4O2Se ([M + H]+) 701.2354; found 701.2390.
1) was used to purify the compound. Yield: 698 mg (89%). Melting point: 178–180 °C. 1H NMR (300 MHz, DMSO-d6): δ 9.28 (s, 1H), 7.93 (d, 1H, J = 7.2 Hz), 7.60 (t, 3H, J = 6.3 Hz), 7.33 (s, 4H), 7.23 (t, 3H, J = 7.5Hz), 7.16–7.09 (m, 2H), 7.0 (d, 1H, J = 7.8Hz), 6.51–6.28 (m, 7H), 3.25 (q, 8H, J = 6.6 Hz), 1.01 (t, 12H, J = 6.6 Hz); 13C NMR (75 MHz, DMSO-d6): 164.2, 153.1, 152.0, 149.0, 148.8, 135.2, 134.5, 134.4, 134.1, 131.9, 130.7, 130.5, 130.0, 129.2, 129.0, 128.7, 128.3, 126.8, 124.3, 123.4, 108.5, 105.5, 97.9, 66.0, 44.1, 12.7. MS (ESI): m/z = 701.2 ([M + H]+); HRMS (ESI): calcd for C41H41N4O2Se ([M + H]+) 701.2354; found 701.2390.
Binding stoichiometry and the association constant (Ka) of RhoSe with Hg2+
Job plot was used to decide the binding ratio of the complex RhoSe–Hg2+. The molar fraction of RhoSe was plotted against the fluorescence intensity at 584 nm. The total concentration of RhoSe and Hg2+ was 50 μM. The binding stoichiometry of the complex RhoSe–Hg2+ was determined from the molar ratio with maximum fluorescence intensity. The association constant (Ka) of the complex RhoSe–Hg2+ was obtained by using the Benesi–Hilderbrand equation.41| 1/ΔF = 1/ΔFsat + 1/(ΔFsatKa[Hg2+]) | (1) |
Cytotoxicity assay
The cytotoxicity of RhoSe was determined by the methyl thiazolyl tetrazolium (MTT) assay. HeLa cells were grown in Dulbecco's modied Eagle's medium (DMEM) with 10% fetal bovine serum (FBS) at 37 °C, 5% CO2. Then HeLa cells were grown into a 96-well cell-culture plate. The cells were added with several concentrations (5, 10, 15, 20, 25 μM) of RhoSe and then incubated at 37 °C, 5% CO2 for 24 h. Subsequently, each well was added with MTT (10 μL, 5 mg mL−1) and then incubated at 37 °C, 5% CO2 for 4 h. Yellow precipitates (formazan) formed in plates then were collected and dissolved in DMSO (200 μL) and Sorenson's glycine buffer (25 μL, 0.1 M glycine and 0.1 M NaCl). The absorbance at 570 nm of each well was recorded by Multiskan GO microplate reader. Cell viability was calculated by the following equation:| Cell viability (%) = (average absorbance of treatment group)/(average absorbance of control group). |
Fluorescence imaging of RhoSe
HeLa cells were treated with Hg(ClO4)2 (30 μM, dissolved in PBS) and incubated for 30 min at 37 °C. Excess metal ions were washed away by PBS (3 × 2 mL). The cells were added with culture media (2 mL) and then incubated with RhoSe (10 μM, dissolved in DMSO). After 30 min incubation at 37 °C, the culture media was removed and cells were washed with PBS (3 × 2 mL). Cell imaging was obtained by a Leica TCS SP5 X AOBS Confocal Fluorescence Microscope (Germany) with the excited wavelength, 510 nm and the collected emission at 580–590 nm.Hg2+ imaging in zebrafish
Animals were maintained in accordance with the guidelines of the National Institute of Health, Taiwan, and approved by the Institutional Animal Care and Use Committee (IACUC) of National Chiao Tung University. Zebrafish was kept at best breeding conditions at 28 °C. For mating, male and female zebrafish were put in the same tank at 28 °C in a 12 h light/12 h dark cycle. The spawning of eggs was triggered by light stimulation in the morning. Most eggs were fertilized immediately. The zebrafish was growed in 5 mL of embryo medium supplemented with 1-phenyl-2-thiourea (PTU) in 6-well plates for 24 h at 28 °C. Furthermore, 3 day-old zebrafish embryos were anaesthetized with 50 mg L−1 tricaine and incubated with mercury(II) perchlorate hydrate (60 μM) in E3 media for 30 min at 28 °C. PBS buffer was used to remove the remaining mercury ions. The zebrafish was further incubated with RhoSe (20 μM) for 30 min at 28 °C. After washing with PBS to remove the remaining probe, the image of zebrafish was observed by a Leica TCS SP5 X AOBS Confocal Fluorescence Microscope.Computational methods
Quantum chemical calculations based on density functional theory (DFT) were carried out using a Gaussian 09 program. The optimal structures of RhoSe and RhoSe–Hg2+ were obtained using the density functional theory (DFT) method with the hybrid-generalized gradient approximation (HGGA) functional B3LYP. For RhoSe–Hg2+, the LANL2DZ basis set was used for Hg2+, whereas the 6-31G basis set was used for RhoSe.Conclusions
In conclusion, a rhodamine-based probe RhoSe with diphenylselenium has been designed for selective and sensitive Hg2+ detection. RhoSe showed a rapid response to Hg2+ alone among other metal ions, with colorimetric and fluorescent turn-on responses. RhoSe can be used for Hg2+ detection over a pH range of 4.0–10.0. In addition, the stoichiometry of the RhoSe–Hg2+ complex was calculated as a 1![[thin space (1/6-em)]](https://www.rsc.org/images/entities/char_2009.gif) :
:![[thin space (1/6-em)]](https://www.rsc.org/images/entities/char_2009.gif) 1 binding ratio using a Job plot, and was further confirmed by ESI-MS. RhoSe shows high sensitivity towards Hg2+ with a detection limit of 12 nM. Importantly, the practical application of RhoSe for Hg2+ detection was successfully demonstrated through test strips, live cell images, and live zebrafish images. RhoSe has been developed as a useful tool for monitoring Hg2+ distribution in biological samples.
1 binding ratio using a Job plot, and was further confirmed by ESI-MS. RhoSe shows high sensitivity towards Hg2+ with a detection limit of 12 nM. Importantly, the practical application of RhoSe for Hg2+ detection was successfully demonstrated through test strips, live cell images, and live zebrafish images. RhoSe has been developed as a useful tool for monitoring Hg2+ distribution in biological samples.
Acknowledgements
We gratefully acknowledge the financial support of Ministry of Science and Technology (Taiwan) for supporting this research under the grant (MOST 105-2119-M-009-013) and National Chiao Tung University.Notes and references
- G. Chen, Z. Guo, G. Zeng and L. Tang, Analyst, 2015, 140, 5400–5443 RSC.
- X. Li, X. Gao, W. Shi and H. Ma, Chem. Rev., 2014, 114, 590–659 CrossRef CAS PubMed.
- J. Wu, B. Kwon, W. Liu, E. V. Anslyn, P. Wang and J. S. Kim, Chem. Rev., 2015, 115, 7893–7943 CrossRef CAS PubMed.
- X. Chen, T. Pradhan, F. Wang, J. S. Kim and J. Yoon, Chem. Rev., 2012, 112, 1910–1956 CrossRef CAS PubMed.
- W. F. Fitzgerald, C. H. Lamborg and C. R. Hammerschmidt, Chem. Rev., 2007, 107, 641–662 CrossRef CAS PubMed.
- Z. Zhang, D. Wu, X. Guo, X. Qian, Z. Lu, Q. Xu, Y. Yang, L. Duan, Y. He and Z. Feng, Chem. Res. Toxicol., 2005, 18, 1814–1820 CrossRef CAS PubMed.
- M. Harada, Crit. Rev. Toxicol., 1995, 25, 1–24 CrossRef CAS PubMed.
- Mercury update: impact on fish advisories, EPA fact sheet (EPA-823-S2-01-011), EPA, Office of Water, Washington, DC 2001, pp. 1–10.
- X. Chai, X. Chang, Z. Hu, Q. He, Z. Tu and Z. Li, Talanta, 2010, 82, 1791–1796 CrossRef CAS PubMed.
- Y. Gao, S. De Galan, A. De Brauwere, W. Baeyens and M. Leermakers, Talanta, 2010, 82, 1919–1923 CrossRef CAS PubMed.
- J. Wang, J. Lu, S. B. Hocevar, P. A. Farias and B. Ogorevc, Anal. Chem., 2000, 72, 3218–3222 CrossRef CAS PubMed.
- F. Moreno, T. Garcia-Barrera and J. L. Gomez-Ariza, Analyst, 2010, 135, 2700–2705 RSC.
- S. Atilgan, T. Ozdemir and E. U. Akkaya, Org. Lett., 2010, 12, 4792–4795 CrossRef CAS PubMed.
- J. Du, J. Fan, X. Peng, P. Sun, J. Wang, H. Li and S. Sun, Org. Lett., 2010, 12, 476–479 CrossRef CAS PubMed.
- Z. Guo, W. Zhu, M. Zhu, X. Wu and H. Tian, Chem.–Eur. J., 2010, 16, 14424–14432 CrossRef CAS PubMed.
- H. Yu, Y. Xiao, H. Guo and X. Qian, Chem.–Eur. J., 2011, 17, 3179–3191 CrossRef CAS PubMed.
- B. N. Ahamed and P. Ghosh, Dalton Trans., 2011, 40, 12540–12547 RSC.
- C.-Y. Li, F. Xu, Y.-F. Li, K. Zhou and Y. Zhou, Anal. Chim. Acta, 2012, 717, 122–126 CrossRef CAS PubMed.
- X. Ma, J. Wang, Q. Shan, Z. Tan, G. Wei, D. Wei and Y. Du, Org. Lett., 2012, 14, 820–823 CrossRef CAS PubMed.
- M. Vedamalai and S.-P. Wu, Org. Biomol. Chem., 2012, 10, 5410–5416 CAS.
- J. Hu, Z. Hu, S. Liu, Q. Zhang, H. Gao and K. Uvdal, Sens. Actuators, B, 2016, 230, 639–644 CrossRef CAS.
- Z. Yu, Z. Tian, Z. Li, Z. Luo, Y. Li, Y. Li and J. Ren, Sens. Actuators, B, 2016, 223, 172–177 CrossRef CAS.
- M. Hong, X. Lu, Y. Chen and D. Xu, Sens. Actuators, B, 2016, 232, 28–36 CrossRef CAS.
- P. Piyanuch, S. Watpathomsub, V. S. Lee, H. A. Nienaber and N. Wanichacheva, Sens. Actuators, B, 2016, 224, 201–208 CrossRef CAS.
- B. Jurado-Sanchez, A. Escarpa and J. Wang, Chem. Commun., 2015, 51, 14088–14091 RSC.
- H. N. Kim, M. H. Lee, H. J. Kim, J. S. Kim and J. Yoon, Chem. Soc. Rev., 2008, 37, 1465–1472 RSC.
- M. Li, Y. Sun, L. Dong, Q.-C. Feng, H. Xu, S.-Q. Zang and T. C. W. Mak, Sens. Actuators, B, 2016, 226, 332–341 CrossRef CAS.
- D. Zhang, M. Li, Y. Jiang, C. Wang, Z. Wang, Y. Ye and Y. Zhao, Dyes Pigm., 2013, 99, 607–612 CrossRef CAS.
- M. Wang, J. Wen, Z. Qin and H. Wang, Dyes Pigm., 2015, 120, 208–212 CrossRef CAS.
- K. C. Behera and B. Bag, Dyes Pigm., 2016, 135, 143–153 CrossRef CAS.
- S. Erdemir, M. Yuksekogul, S. Karakurt and O. Kocyigit, Sens. Actuators, B, 2017, 241, 230–238 CrossRef CAS.
- H. Ding, C. Zheng, B. Li, G. Liu, S. Pu, D. Jia and Y. Zhou, RSC Adv., 2016, 6, 80723–80728 RSC.
- C. Kumari, D. Sain, A. Kumar, S. Debnath, P. Saha and S. Dey, RSC Adv., 2016, 6, 62990–62998 RSC.
- J. Luo, S. Jiang, S. Qin, H. Wu, Y. Wang, J. Jiang and X. Liu, Sens. Actuators, B, 2011, 160, 1191–1197 CrossRef CAS.
- Y. Wang, H. Wu, J. Luo and X. Liu, React. Funct. Polym, 2012, 72, 169–175 CrossRef CAS.
- D. S. McClure, J. Chem. Phys., 1951, 20, 682–686 CrossRef.
- R. K. Zalups, Pharmacol. Rev., 2000, 52, 113–144 CAS.
- B. F. Azevedo, L. B. Furieri, F. M. Pecanha, G. A. Wiggers, P. F. Vassallo, M. R. Simoes, J. Fiorim, P. R. de Batista, M. Fioresi, L. Rossoni, I. Stefanon, M. J. Alonso, M. Salaices and D. V. Vassallo, J. Biomed. Biotechnol., 2012, 1–11 CrossRef PubMed.
- V. Dujols, F. Ford and A. W. Czarnik, J. Am. Chem. Soc., 1997, 119, 7386–7387 CrossRef CAS.
- S.-R. Liu and S.-P. Wu, Org. Lett., 2013, 15, 878–881 CrossRef CAS PubMed.
- H. A. Benesi and J. H. Hildebrand, J. Am. Chem. Soc., 1949, 71, 2703–2707 CrossRef CAS.
Footnote |
| † Electronic supplementary information (ESI) available: 1H NMR, 13C NMR, mass spectra of RhoSe. See DOI: 10.1039/c7ra02459b |
| This journal is © The Royal Society of Chemistry 2017 |

