 Open Access Article
Creative Commons Attribution 3.0 Unported Licence
Generation of a co-culture cell micropattern model to simulate lung cancer bone metastasis for anti-cancer drug evaluation†
Huixiang Zhong ab,
Liuyang Xuanab,
Dandan Wangab,
Jianhua Zhouab,
Yan Li
 *ab and
Qing Jiangab
aGuangdong Provincial Key Laboratory of Sensor Technology and Biomedical Instrument, Department of Biomedical Engineering, School of Engineering, Sun Yat-sen University, Guangzhou, Guangdong, P. R. China. E-mail: liyan99@mail.sysu.edu.cn; Fax: +86-20-39387890; Tel: +86-20-39387890
bGuangdong Provincial Engineering and Technology Center of Advanced and Portable Medical Devices, Sun Yat-sen University, Guangzhou, Guangdong, P. R. China
First published on 19th April 2017
Abstract
Lung cancer bone metastases usually involve multiple interactions between cancer cells and host organs. To mimic such a structure, a cell co-culture micropattern of A549 lung cancer cells and osteoblast cells (A549/OB) was developed using a μ-eraser strategy for anti-cancer drug evaluation and also understanding cell–cell communication. When applying the μ-eraser strategy, a PDMS stamp was pressed to induce cell lysis. Hence, the minimum pressure required to induce cell lysis was first quantified. Then the pressure and pressing time for the micropatterning process were optimized to obtain cell micropatterns of high fidelity and repeatability. For different types of cells (A549 and human mesenchymal stem cells) and different substrates (TCP and PLGA nanofiber sheets), the optimized pressure was also different (i.e., for A549 on TCP, a pressure of 24.5 kPa was pressed for 10 s). According to a live/dead assay and Alamar Blue assay, cell viability and proliferation potential were not affected by the micropatterning process. There were several advantages for the μ-eraser strategy: substrates were not pre-treated; cell micropatterns mainly relied on the pattern of the PDMS stamp along with the micropatterning process; cells in the micropattern were not restricted in specified regions. Thus the A549/OB co-culture micropattern on TCP was used to evaluate the efficacy of a therapeutic agent (doxorubicin). In the co-culture micropattern, the efficacy of doxorubicin decreased when the expression of ALP in OB was elevated. The co-culture micropattern model showed the potential to be used for new anti-cancer drug development.
1. Introduction
Lung cancer is one of the major causes of death worldwide. Approximately 30–40% of patients with advanced lung cancer have bone metastases and suffer from skeletal related events (SREs),1–3 resulting in decreased survival rate and quality of life. Bone metastases can clinically cause persistent pain, spinal cord compression, pathological fractures and hypercalcemia.1For patients with advanced lung cancer, the formation of bone metastasis is the result of the synergistic interactions of multiple cells and molecules. The migration of cancer cells to bone can cause extensive osteolysis of mineralized collagenous matrix or bone surface through the production of factors or direct cell–cell contact.4–6 Furthermore, the osteoblast-derived growth factors may stimuli the growth of established cancer cell lines.4 Bone metastases involve multiple interactions between cancer cells and host organs. Cell functions and fates are not only influenced by cell-autonomous programs, but also by the microenvironment stimuli, including soluble factors and direct cell contact with neighbor cells.7 All these complicated factors lead to a fact that it was very difficult to cure lung cancer.
Chemotherapy is one of the typical therapies for cancer patients with bone metastases. Although anti-cancer drugs prolonged patients' life, they only increased a few months marginally. The limited therapeutic effect is partially due to the low permeability in the skeleton tumor sites and poor selectivity to the multiple bone metastatic nodules. Meanwhile, the side effects induced by non-targeted chemotherapeutic drugs also increase patients' sufferings.1,8 Hence, plenty of endeavors have been put on the development of anti-cancer drugs9 and drug carriers.10,11
For evaluation of anti-cancer drugs and drug carriers, besides 2D cell culture models,10,11 animal models play a significant role. Nevertheless, the animal tests are expensive, slow, ethnically challenged and more importantly, questionable to reflect the responses in humans.12 Hence, it is highly desirable to develop an in vitro model to mimic in vivo tissue, to fill up the gap between 2D cell model and animal models, and provide reliable results for drug evaluation. The in vitro model will fasten the process of drug and drug carrier development, also be beneficial for human disease diagnosis and treatment.
To reconstruct an in vitro model consisting of precisely organized multiple types of cells for better evaluating drug effect and also understanding cell–cell communication, methods for generating patterned co-culture systems have been demonstrated, mainly using photolithography and soft lithography techniques, or materials that have switchable surface properties.13 The substrates are usually modified by chemical or external stimuli to define certain area for the first type of cells to adhere on, followed by seeding the second type of cells.14,15 However, the aforementioned strategies are inapplicable to three or more types of cells, having the potential to compromise cell viability or form uneven surface microenvironment due to modification process.16 Recently a contact-erasing strategy (named μ-eraser strategy) has been developed to fabricate co-culture micropattern systems by erasing partial cells after pressing a PDMS stamp to induce cell lysis and seeding another type of cells on the empty regions, which is easy, inexpensive and applicable to any anchorage-dependent cells.17 Hence, to mimic bone metastasis of lung cancer cells for anti-cancer drug evaluation, a patterned co-culture model composed of human non-small cell lung cancer cell line (A549 cells) and human osteoblast cell line hFOB 1.19 (OB cells) was established on tissue culture plate (TCP) through the μ-eraser strategy. The anticancer drug doxorubicin (DOX) was selected as a model drug since DOX is a first-line anti-cancer drug for non-small-cell lung cancer even after bone metastasis.18
In this paper, to precisely control the process for the μ-eraser strategy, the minimum pressure required to induce cell lysis was first measured and then the pressing pressure, pressing time were optimized for different substrates and different types of cells. TCP and poly(lactide-co-glycolide) (PLGA) electrospun nanofibers sheets were selected as the representatives of substrates; A549 cells and human mesenchymal stem cells (hMSCs) were seeded. The influence of micropatterning process on cell viability and proliferation potential were further investigated using live/dead assay and Alamar Blue assay. Besides the efficacy of DOX, A549/OB co-culture micropattern was also used to study the influence of A549 on OB cells by monitoring the expression of alkaline phosphatase (ALP). The optimized results for micropatterning process not only facilitated the fabrication of micropatterns of high fidelity, but may also be beneficial for the scale up of the μ-eraser strategy. The fabricated co-culture micropattern model may shorten the evaluation process for anti-cancer drugs and drug carriers, thus fasten the corresponding development process.
2. Materials and methods
2.1 Materials
Poly(dimethylsiloxane) (PDMS) was purchased from Dow corning Co. (USA). Fetal bovine serum (FBS), 0.2% trypsin–EDTA and Dulbecco's Modified Eagle Media: Nutrient Mixture F-12 (DMEM/F12) were supplied by Gibco (USA) and penicillin–streptomycin was from Hyclone (USA). PLGA (lactide/glycolide molar ratio 75/25, Mw ∼ 80![[thin space (1/6-em)]](https://www.rsc.org/images/entities/char_2009.gif) 000) was bought from Jinan Daigang Biomaterials Co., Ltd (China). Calcein-AM was obtained from Sigma-Aldrich (USA). Propidium Iodide (PI) and resazurin were from Aladdin Industrial Corporation (China). Doxorubicin hydrochloride (DOX) was bought from Melone Pharmaceutical Co., Ltd (China). MTT was purchased from Amresco (USA) and ALP Kit was from Beyotime (China).
000) was bought from Jinan Daigang Biomaterials Co., Ltd (China). Calcein-AM was obtained from Sigma-Aldrich (USA). Propidium Iodide (PI) and resazurin were from Aladdin Industrial Corporation (China). Doxorubicin hydrochloride (DOX) was bought from Melone Pharmaceutical Co., Ltd (China). MTT was purchased from Amresco (USA) and ALP Kit was from Beyotime (China).
2.2 μ-Eraser strategy for cell patterning
Cell micropatterns were generated using the μ-eraser strategy recently developed.17 A PDMS stamp was connected to a mechanical device for stable and repeated moving. After the culture medium was removed, the PDMS stamp was pressed onto a confluent cell layer to induce cells lysis, followed by washing with PBS immediately. Cell micropatterns of one type of cells (i.e., A549 cells) were produced. The pressure applied on the cells through PDMS stamp was precisely controlled by putting a weight on the device. Second type of cells (i.e., OB cells) were then seeded to obtain co-culture micropatterns of two types of cells (Fig. 1). Here the co-culture micropattern was developed for anti-cancer drug evaluation. Hence, to minimize the influence on cells, cells were not stained with any fluorescence probe. Since the transparent TCP was mainly the substrate used and both types of cells had different morphology, it was easy to tell whether cell micropatterns were formed.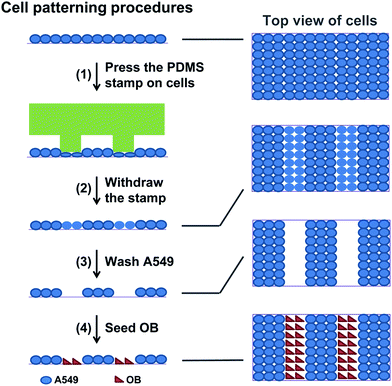 | ||
| Fig. 1 Schematics of generating cell micropatterns of one type of cells and di-cell co-culture micropatterns using μ-eraser strategy. | ||
After A549 cell micropattern was generated, OB cells (from ATCC) were seeded onto the substrate at a density of 8 × 10⁴ cells per ml to form a di-cell co-culture model, as shown in Fig. 1. The di-cell system was cultured in DMEM/F12 containing 10% FBS and antibiotics. All cells were cultured in a humidified incubator at 37 °C in 5% CO2 atmosphere.
2.3 Analysis of micropatterning process
To optimize the micropatterning process, different forces (imposed by placing a weight of 200 g, 100 g, or 50 g on PDMS stamp) along with different pressing time were applied. Cells at the same location before and after micropatterning were observed under a light microscope. Furthermore, live/dead assay was conducted. Viable and dead cells were stained with Calcein-AM and PI, respectively. The staining process was conducted according to the product manual and fluorescent images were captured using a fluorescence microscope (Olympus, Japan).
The nanofiber sheets were soaked in 10% penicillin/streptomycin solution for 12 h for sterilization and rinsed thoroughly with PBS. Cells were stained with Calcein-AM just before micropatterning for easier observation. After cell micropatterns were formed, fluorescence microscope images were taken.
2.4 Application of di-cell micropattern model
The A549, OB and A549/OB co-culture micropattern models in 24-well plates were prepared as mentioned above. Cells without patterning process were cultured as control groups. After A549/OB micropatterns cultured for 24 h, cells were exposed to anticancer drug DOX at a concentration of 10 and 100 μg ml−1 for 48 h, respectively. The culture medium was replaced with fresh medium containing DOX every day. Since DOX was fluorescent, the cellular uptake was assessed through a fluorescence microscope in red channel. After cells were incubated in medium containing DOX for 48 h, MTT assay was performed to quantify cell viability. Cells were subjected to MTT (0.5 mg ml−1) solution for 2 h at 37 °C. The formed formazan crystals were dissolved in 350 μl DMSO and the optical densities were read at 570 nm using a microplate reader.2.5 Evaluation of ALP expression in di-cell micropattern model
To evaluate the influence of co-culture on cell behavior, ALP expression was selected as a representative because A549 expressed ALP19 and OB cells also produced ALP after osteogenic induction.20 Thus, after A549/OB micropattern was co-cultured for 4 days, cells were first fixed with 4% paraformaldehyde for 30 min and incubated with BCIP/NBT kit reagents for another 30 min according to the manufacturer's instructions. After staining, cells were observed under an optical microscope.3. Results
3.1 μ-Eraser strategy for cell patterning
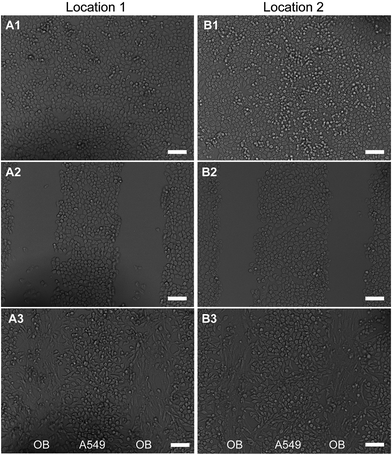
Cell micropatterns of A549 and A549/OB on TCP were fabricated as illustrated in Fig. 1 using the μ-eraser strategy. A PDMS stamp with microstripes was first prepared. After A549 cells proliferated to form a confluent layer, the PDMS stamp was pressed onto cells for several seconds and withdrew. The cells under ridges of stamp were induced to lyse and washed away, leaving an empty surface (cells were partially erased by the PDMS stamp). The cells under grooves of the stamp were not affected and cell micropattern which was complementary to the pattern on PDMS stamp was formed, as shown in Fig. 2. The second type of cells, OB cells were then seeded and di-cell micropatterns were obtained. To demonstrate the feasibility and repeatability, cells at two random locations were selected as the representatives.3.2 Optimization of micropatterning process
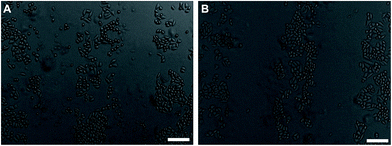
Cells were lysised under mechanical pressure, which was key to fabricate cell micropatterns using μ-eraser strategy with a PDMS stamp. Hence, the minimum mechanical pressure that was required to induce cell lysis was quantified so as to optimize the micropatterning process.The mechanical transducer setup (Fig. S1†) was used to measure the minimum pressure required for cell lysis. The PDMS stamp used here had a featured surface with 300 μm-wide ridges and 200 μm-wide grooves. When a small force of 0.59 N (calculated to be a pressure of 9.9 kPa on cells) was applied for a short time, no cell micropattern was formed. As shown in Fig. 3, when the force was increased to 1.18 N, which was equal to a pressure of 19.7 kPa on cells, the lysised cells were no longer present in the pressed area and cell micropatterns were generated; furthermore, when the force was increased to 9.6 N (163.6 kPa), cell micropatterns were easily obtained. Based on the comparison, it was found that the pressure larger than 19.7 kPa was required to form cell micropattern using the μ-eraser strategy.
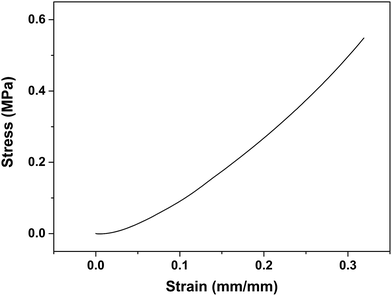
PDMS is rubber-like and its viscoelasticity might influence the resolution of micropatterns. Hence, we investigated the compressive properties of PDMS stamps. As displayed in Fig. 4, the stress strain curve showed a typical linear elastic region, up to a strain value of ∼55% before failure. The average compressive module was determined to be 1.81 ± 0.13 MPa, which was similar to that reported in literature.21 When a pressure of 19.7 kPa was applied on the stamp, the strain was 1.1%; while when the pressure was increased to 163.6 kPa, the strain was also increased to 9.0%. Thus in order to obtain micropatterns with a high fidelity, a small pressure (i.e., 19.7 kPa) which induced cell lysis was recommended.
To precisely control the micropatterning process of μ-eraser strategy, instead of manual pressing the PDMS stamp, weights of 50 g (0.49 N) or 100 g (0.98 N) were used to exert force and the pressing time was also controlled. As shown in Fig. 5, when a pressure of 12.3 kPa (from a weight of 50 g, 0.49 N) was applied for 10 s, no cell micropattern was formed. However, when the pressure of 12.3 kPa was applied for a longer time (i.e., 20 s), cell lysis was induced and cell micropatterns were successfully fabricated. When a weight of 100 g (0.98 N, the pressure on cells was 24.5 kPa) was placed on the PDMS stamp for 10 s, distinct micropatterns were easily obtained. Under such pressure (24.5 kPa), the strain of PDMS stamp was 1.4%. Under a low pressure such as 12.3 kPa, cells might withstand such pressure for a short time (i.e., 10 s) since cells can sense the mechanical stimuli from environment and make corresponding reactions;22 while at higher pressure, A549 cells were caused to lysis by the mechanical stimuli. Although the outcome of lower pressure can be compensated with longer pressing time for μ-eraser strategy, a short pressing time was preferred so as to fasten the process and also minimize the risk of cell death resulted from contamination or drying. Thus a weight of 100 g along with 10 s was applied to fabricate A549 cell micropatterns on TCP.
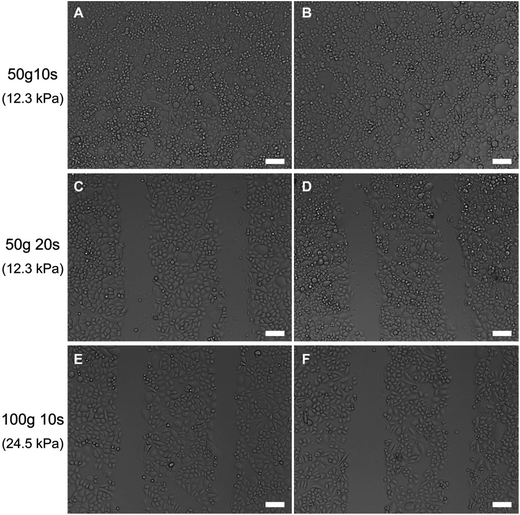 | ||
| Fig. 5 Representative light microscope images of A549 cells on TCP after pressed under different conditions. Cells at two random locations were selected. The scale bars are 100 μm. | ||
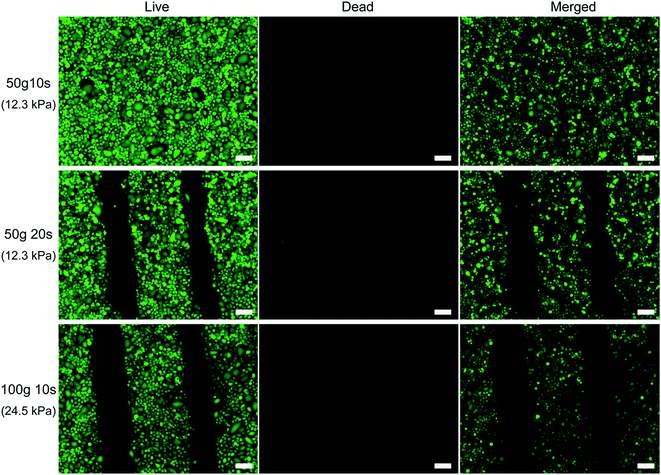
Cell viability was evaluated after the micropatterning process using live/dead assay. As shown in Fig. 6, when a low pressure along with a short pressing time (50 g 10 s group) was applied, all cells displayed green fluorescence, showing that this condition could not cause cell death and consequently no pattern was fabricated (Fig. 5). When such a low pressure was applied for longer time (i.e., 20 s), nearly all cells in the micropatterns were stained as green and only several cells located at the edges of cell stripes were stained as red. For 100 g 10 s group, similar observations as that for 50 g 20 s group were found, where dead cells were mainly washed away and only a few were at the edges of microstripes. Thus it can be concluded that cell micropatterning process did not compromise the viability of remaining cells. The rest cells were nearly all alive and could be used for further research, for example, producing a multi-cell co-culture model for drug evaluation.
To further explore the applicability of the μ-eraser strategy for cell micropatterning, we also employed different substrates and different types of cells. When A549 cells were cultured on PLGA nanofiber sheets and formed a confluent layer, a weight of 100 g was first placed on the PDMS stamp (the pressure on cells was 24.5 kPa) for 10 s. Unlike A549 on TCP, the formed A549 micropatterns on PLGA nanofiber sheets were not complementary to the pattern on PDMS stamp. Hence, a weight of 200 g was applied on the stamp (pressure was 49.0 kPa, twice as that on TCP) for 10 s, micropatterns were successfully formed, which was complementary to the pattern on the stamp (Fig. 7). In addition, cells in micropattern were all viable (stained as green), and lysised cells were washed away. Based on the observation, it can be concluded that on PLGA electrospun nanofibers sheets, cell micropatterns of A549 can be easily obtained using the μ-eraser strategy when appropriate conditions were applied.
The μ-eraser strategy was also applied to fabricate micropatterns of stem cells. HMSCs were selected as a representative, which is a type of multipotent adult stem cells of mesodermal origin and showed migratory ability, exerted inhibitory effects on tumor cells or resulted in functional recovery after implantation.23–25 After pressed at 24.5 kPa (weight of 100 g) for 10 s, hMSCs remained to be a confluent layer on TCP and no cell micropattern was formed, which was very different from A549 cells. When the pressure was increased to 49.0 kPa (weight of 200 g), the cell patterns were generated (Fig. S2†). Some hMSCs on the edges of stripes remained adhering on the substrate, leaving incontinuity of the stripe lines. HMSC micropatterns were different from A549 cell micropatterns for which edges of A549 microstripes were straight and sharp. After live/dead assay, the remaining hMSCs in micropattern were all alive and only a few dead cells were present on the edges of cell stripes (Fig. S3†). In addition, hMSC micropatterns were also fabricated using the μ-eraser strategy on casein/chitosan multilayer films which were prepared using layer by layer self-assembly method.26 Before pressed, green hMSCs were as a confluent layer; after pressed using a PDMS stamp with broader ridges at width of 300 μm, clear cell patterns in thinner lines were generated (Fig. S4†).
Hence, the μ-eraser strategy can be applied to different types of cells on different substrates by mainly adjusting the pressure.
3.3 Proliferation investigation of cell micropatterns
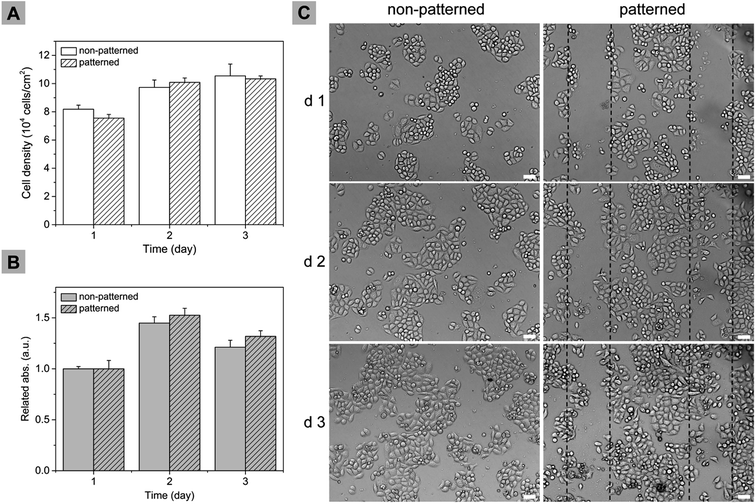
Live/dead assay was performed immediately after the micropatterning process and it was found that the process did not affect cellular viability of remained cells. In order to investigate the effect of μ-eraser strategy on longer-term cell culture, the comparison of cell proliferation between patterned cells and non-patterned cells were made. For the sake of proliferation, A549 cells were seeded at a lower density (i.e., 5 × 10⁴ cell per ml).Local cell density of patterned area was monitored. As shown in Fig. 8A, cell density of both groups increased with culture time. For cells located in the patterned area, even though the initial cell density was a little smaller which was due to the micropatterning process, on the 2nd and 3rd day of culture, the cell density was comparable with that of non-patterned group. In the local view, μ-eraser strategy did not compromise cell proliferation potential. Alamar Blue assay was used to investigate the proliferation profile of overall cells since it allowed daily monitoring without affecting cell viability and permitted subsequent analysis.27 For better comparison, the data was normalized against the absorbance values on the 1st day (Fig. 8B). During the culture time, relative absorbance values of both groups increased, demonstrating that cells in both groups proliferated; the patterned group appeared to have relative higher absorbance value, indicating cells in patterned group grew faster. Cell distribution on TCP was also observed. As shown in Fig. 8C, in non-patterned group, cells were randomly located and during proliferation, the divided cell gradually occupied the empty space. For patterned group, cells were mainly located in the microstripes on the first day. On the next two days, cells proliferated rapidly, gradually occupied the patterned empty space and cell micropatterns became undistinguishable on the third day. It appeared that in cell micropattern the empty spacer facilitated cell migration and proliferation. Based on the comparison, it can be concluded that μ-eraser strategy did not compromise cell proliferation potential either.
3.4 A549/OB co-culture micropattern for drug evaluation
A549/OB co-culture micropattern was developed to mimic bone metastasis of lung cancer cells in order to investigate DOX efficacy. The relative cell viability of A549 and OB cells seeded at the same density as that for co-culture was first quantified using MTT assay after cultured in medium with various concentrations of DOX for 24 h. As shown in Fig. S5,† the relative viability of A549 decreased with the increase of DOX concentration while for OB the value nearly stabilized at ∼10%. Hence for co-culture comparison, a low concentration at 10 μg ml−1 and a high concentration at 100 μg ml−1 were selected as representatives.DOX itself displays strong red fluorescence.28 As shown in Fig. S6,† both A549 and OB cells showed red fluorescence due to cellular uptake of DOX (100 μg ml−1). Time prolonged, more drug was taken by cells and the fluorescence intensity was stronger. At 6 h of exposure, the fluorescence intensity of OB cells in A549/OB co-culture micropattern was obviously stronger than that of A549 cells, indicating probably more DOX was taken by OB cells.
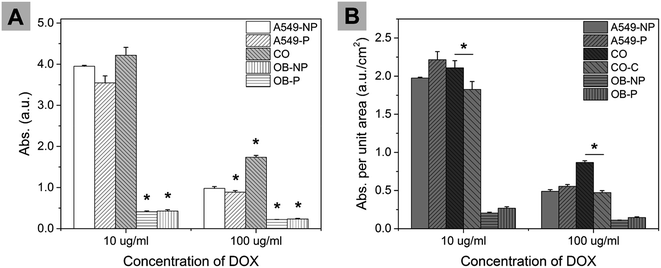
MTT assay was conducted to assess cell viability after incubated in medium with DOX for 48 h. As show in Fig. 9A, when DOX concentration was the same, the absorbance value of A549/OB co-culture group was always the highest and the values for A549 being solo-cultured were also much higher than that for OB cells. At DOX concentration of 100 μg ml−1, the absorbance value of A549/OB co-culture micropattern group was 95.7% higher than that of A549 micropattern (A549-P) group.
The initial cell number of micropatterned groups (A549-P, OB-P) was smaller than that of non-patterned groups (A549-NP, OB-NP) since partial cells were erased during micropatterning process, which might contribute to the smaller absorbance values of patterned groups (A549-P, OB-P). Hence cell amount difference which was represented by area difference was taken into account. For A549-P and OB-P groups, the area with cells which were first erased by PDMS stamp was 0.4 cm2 (the PDMS stamp was in 10 × 10 mm with 200 μm-wide ridges and 300 μm-wide grooves); the area with remaining cells was 1.6 cm2 (the models were cultured in a 24-well plate of which each well has a basal area of 2.0 cm2). As shown in Fig. 9B, at each concentration, A549-P and OB-P had slightly higher absorbance values per unit area than that for A549-NP and OB-NP groups, respectively. As for A549/OB co-culture group, the absorbance value per unit area was first calculated by neglecting that there were two types of cells present (the result was CO group in Fig. 9B); then assuming the same cell viability in co-culture micropattern as that in solo-culture system and taking into account that the area occupied with A549 was 1.6 cm2 and the area for OB was 0.4 cm2, the absorbance value per unit area for A549/OB co-culture group was re-calculated and plotted as CO–C group. For CO–C group, the absorbance value per unit area for A549 was from A549-P group and the absorbance value per unit area for OB was from OB-P group. At each concentration, the measured absorbance values per unit area were significantly higher than the calculated values. Based on these comparisons, it can be concluded that the co-culture of A549 with OB cells may decrease the efficacy of DOX.
A549/OB co-culture micropattern demonstrated significantly different response regarding the treatment of DOX when compared with A549 being solo-cultured. Therefore the ALP expression was evaluated to further investigate cell response during co-culture. A549, A549/OB and OB cell micropatterns were cultured in normal medium for 4 days without osteogenic induction and then staining with NCIP/NBT solution was conducted to evaluate the expression of ALP (Fig. S7†). The deeper the violet color, the higher is the ALP level. A549 always displayed pronounced ALP-positive staining; in non-patterned group, the ALP-positive staining distributed homogeneously while in the patterned group, different shades of violet color varied by the stripes and spacers in micropatterns were observed. The strong positive staining of spacers also demonstrated that A549 cells had proliferated and migrated. In the A549/OB co-culture micropattern, besides the positive staining for A549, even darker cell microstripes were observed which were OB cells. The width of OB cell microstripes on day 4 was narrower than 200 μm (the width of ridges of PDMS stamp), indicating that A549 cells demonstrated more invasive ability than OB cells. However, for OB cells being solo-cultured, the ALP level was very low and no violet color can be identified. Hence, it was highly speculated that during co-culture, A549 affected OB cells and elevated the ALP expression of OB cells.
4. Discussion
Cell co-culture micropattern of A549/OB was successfully fabricated using the μ-eraser strategy with a PDMS microstamp for anti-cancer drug evaluation. PDMS was an elastic material with the Poisson's ration of approximately 0.5.29 When an axial compression stress was applied, PDMS expanded laterally. Therefore when the pressure was not precisely controlled, cell micropattern may be deformed and when an excessive high pressure was applied, cells located under and near the stripes of PDMS stamp were both exposed to the mechanical stimuli and induced to lysis, leading to the failure of micropatterning process. Hence the minimum pressure required to induce cell lysis was first measured and the micropatterning process was then optimized.The minimum pressure required to induce lysis of A549 on TCP for μ-eraser strategy was measured to be 19.7 kPa. When the pressure was reduced to 12.3 kPa (by placing a weight of 50 g) and applied for a short time (i.e., 10 s), A549 cells on TCP were still alive and no pattern was formed. However, time prolonged to 20 s, cell lysis was induced and patterns were obtained. Cells respond to external mechanical stimuli by remolding the cytoskeleton, which was correlated with the Young's modules of a cell. The Young's modulus of a cell has been investigated based on AFM by Lekka et al.30 and studies showed that the obtained modulus decreased with the time of poking a single cell increased. When the PDMS stamp was pressed on cells for a short time, cells were able to withstand the pressure by reorganizing the cytoskeleton; while for a long time, cells were not able to restore the large deformity and lysis. In order to obtain cell micropatterns using μ-eraser strategy, longer pressing time was able to make up for the insufficient pressure. However, the risk of contamination and compromising cell viability was increased. Herein, a pressing time of 10 s was adopted for the following tests.
When the pressing time was not changed, the minimum pressure required to induce cell lysis was found to be related with substrates. To precisely control the micropatterning process, the pressure was applied by placing a weight. For A549 on TCP, the minimum pressure applied was 24.5 kPa (weight of 100 g). At this pressure, the compressive strain of PDMS stamp was 1.4%; thus the height of ridges decreased 2.7 μm (the height of ridges was 200 μm). The grooves of the stamp were not able to touch the cells, and cell micropatterns of high fidelity were successfully fabricated. After A549 were seeded on PLGA electrospun nanofiber sheets, a pressure of 49.0 kPa (weight of 200 g), twice as that on TCP was needed to achieve the cell micropatterns. Nanofiber sheets are flexible that are easy to adapt to external changes and thus to some extent shield cells from compression.31 Thus, on PLGA electrospun sheets, a higher pressure was needed to form patterns, which was similar to the micropatterning process on PCL nanofiber sheets.17
Furthermore, the minimum pressure required to induce cell lysis for cell micropatterning was also related with cell types. Compared to A549 cells, a higher pressure was required to fabricate hMSC micropatterns on TCP using the μ-eraser strategy. This difference can be addressed to the different cytoskeleton structure, which determines the shape and mechanical rigidity of cells.30,32 A549, a tumor cell line, is disorganized in actin cytoskeleton with fewer stress fibers for better metastases;33 while hMSCs have bundles of actin filaments and stress fibers.34 The polymerization of cortical filaments and stress fibers, especially the stress fibers, greatly contributes to the stiffness of cells.35 Hence, hMSCs withstood a higher force and a higher pressure (i.e., 49.0 kPa) was needed to induce lysis for cell micropatterning. The variables adopted to fabricate cell micropatterns were summarized in Table 1.
| No. | Cell type | Substrate | Weight (g) | Pressure (kPa) | Time (s) | Patterning |
|---|---|---|---|---|---|---|
| 1 | A549 | TCP | 50 | 12.3 | 10 | No |
| 2 | A549 | TCP | 50 | 12.3 | 20 | Yes |
| 3 | A549 | TCP | 100 | 24.5 | 10 | Yes |
| 4 | A549 | PLGA nanofiber sheet | 100 | 24.5 | 10 | Incomplete |
| 5 | A549 | PLGA nanofiber sheet | 200 | 49.0 | 10 | Yes |
| 6 | hMSC | TCP | 100 | 24.5 | 10 | No |
| 7 | hMSC | TCP | 200 | 49.0 | 10 | Yes |
The cell micropattern of A549 was slightly different from that of hMSC even on the same substrates. The spreading area of a single A549 cell was smaller than that of a hMSC. After pressed, the whole A549 cell even on the edge of ridges was under pressure and induced to lysis. However, for hMSCs, those located on the stripe edges, only had small part of the cell were pressed. Although these cells were not able to be washed away, they were stained red by PI and some were even survived. This may be due to the cytoskeleton remodeling inside the cell when part of it was under mechanical force and consequently avoided lysis.30 Hence, the formed hMSC microstripes were slightly different from A549 microstripes.
The cell micropatterning process did not compromise cell viability and also the proliferation potential. When mechanical stress was applied to induce cell lysis, cell debris was easy to be washed away, where on TCP the newly created space was very clean (Fig. 5). Even on PLGA nanofiber sheets, the red staining was mainly on the edges of microstripes (Fig. 7), indicating cell debris was nearly not present on the newly created space. Hence, the effects of cell debris on the remaining cells were minimal. For A549 on TCP, cells in patterned area proliferated faster than that in the non-patterned area possibly due to the lower density and more space for cell spreading and migration. For the overall result, the proliferation was investigated based on Alamar Blue assay, where the relative absorbance values of both groups on the third day was smaller than that on the second day. The reason might be due to the formation of colorless non-fluorescent compound hydroresorufiin caused by over-reduction of resazurin.36
Based on these investigations, it was found that there were several advantages for the μ-eraser strategy. When appropriate conditions were applied, micropatterns of different types of cells on various substrates can be easily achieved. Cell micropatterns were mainly depended on the pattern of PDMS stamp, where besides microstripes, cell micropatterns in helixes and triangles have been created;16 furthermore, cell micropatterns were also relied on the patterning process, where a co-culture micropattern of three types of cells was fabricated.17 The substrates were in no need to be pretreated. Thus cells were not restricted in the defined regions; cell proliferation, migration and interaction with neighbor cells were observed. However, there were also limitations for the μ-eraser strategy. By only applying the technique, it was difficult to control the spreading shape of a single cell or fabricate thin cell micropatterns. These can be easily obtained on patterned substrates which were fabricated using microcontact printing with a PDMS stamp.37,38 When the μ-eraser strategy was applied with well-designed cell types and micropattern dimension, cellular alignment was also controlled.17 This alignment was different from cells on substrates with 3D microchannels fabricated using laser ablation.39 The μ-eraser strategy nearly did not modify the morphology of substrates.
Since the viability and proliferation potential of cells in micropatterns was not affected by the patterning process, the A549/OB co-culture micropattern was created on TCP to explore the anti-cancer drug efficacy. DOX can easily enter into cell nucleus to inhibit DNA synthesis and gene transcription and thus lead to cell death.40 When incubated in medium containing DOX, the OB cells seemed to take more DOX than A549 cells, displaying stronger fluorescence. A549 cells seemed to be less sensitive to drug in the co-culture system than in the solo-culture system. After exposed to DOX for 48 h, the cell viability of co-culture system was significantly higher than the solo-culture system. In conclusion, our A549/OB co-culture micropattern system appeared to decrease the efficacy of DOX. Similar but different observation was reported that the growth factors secreted by OB cells might stimulate the proliferation of cancer cells.4 Here, the effect of OB cells on the proliferation of A549/OB micropattern was not investigated since the empty space on substrates for proliferation was different between A549/OB co-culture and A549 solo-culture micropattern. Hence, DOX at cytotoxic levels was introduced to evaluate the effect of OB cells on the efficacy of DOX in the A549/OB co-culture micropattern. The finding that OB reduced the efficacy of DOX should be taken into careful consideration when DOX was used for chemotherapy for lung cancer treatment when bone metastasis occurs.
Besides the effect of OB cells on DOX efficacy, the effect of A549 on OB based on ALP staining was also investigated, and the results showed that OB cells expressed much higher level of ALP in the co-culture micropattern than in the solo-culture. The ALP level was un-detectable in OB cells without osteogenic induction and yet high in A549 cancer cells. When two types of cells were co-cultured to mimic bone metastasis of lung cancer, the OB microstripes displayed more pronounced ALP-positive staining, possibly due to the interaction with A549 cells. A549 cell was also reported to have the ability to differentiate into osteogenic cells.19 Hence, in the A549/OB co-culture micropattern model, A549 may “educate” OB cells so as to elevate its ALP expression. However, our results were different from the report that the exosomes secreted by A549 cells could inhibit osteogenic differentiation of mesenchymal stem cells and lead to low level of ALP.41 The difference was probably originated from that the co-culture models and cell types were both different.
5. Conclusions
Cell micropatterns of one type or multi-types of cells were successfully developed on homogeneous substrates through the μ-eraser strategy. The first seeded cells were partially erased by pressing a PDMS stamp and then cell micropattern was obtained. Followed by seeding the second type of cells, co-culture cell micropatterns were achieved. The erasing/seeding process can be repeated and the micropatterning process can also be applied on different substrates. To precisely control the process, the pressing pressure and time were optimized, which depended on substrates and cell types. For A549 on TCP, a pressure of 24.5 kPa was applied for 10 s; when A549 was seeded on PLGA nanofibers sheets, the pressure was increased to 49.0 kPa and pressed for 10 s; as for hMSC on TCP, the minimum pressure required was also 49.0 kPa and applied for 10 s. The micropatterning process did not compromise the cell viability and the co-culture micropattern system composed of A549 and OB cells was created on TCP. In the A549/OB co-culture micropattern, the interactions between A549 and OB cells were mutual as both A549 and OB cells grew on the same surface and either A549 or OB cells were not restricted in any specified regions. Thus the developed micropattern was used for anti-cancer drug evaluation, especially for the drug that was designed for cancer at later stage (i.e., bone metastasis happened). In the co-culture model, the efficacy of DOX was decreased while the expression of ALP in OB cells was elevated. The micropatterning process was simple, inexpensive and applicable to any anchorage-dependent cells. To better mimic the in vivo microenvironment in future, some physiological stimuli, such as shearing force will be introduced into the co-culture system to explore cell response. Additionally, co-culture micropattern system in three-dimensional system will be developed since tissues are composed of multiple complex levels of cells and extra cellular matrix in three-dimensions.Acknowledgements
This work was supported in part by National Natural Science Foundation of China (51303216), Fundamental Research Funds for the Central Universities (14lgpy12 and 16lgjc62), Guangdong Provincial Education Department (2013KJCX005), and the Australia-China Joint Institute for Health Technology and Innovation.References
- N. LeVasseur, M. Clemons, B. Hutton, R. Shorr and C. Jacobs, Cancer Treat. Rev., 2016, 50, 183–193 CrossRef CAS PubMed.
- H. Fujita, A. Gomori, Y. Fujioka, Y. Kataoka, K. Tanaka, A. Hashimoto, T. Suzuki, K. Ito, T. Haruma, H. Yamamoto-Yokoi, N. Harada, M. Sakuragi, N. Oda, K. Matsuo, M. Inada and K. Yonekura, PLoS One, 2016, 11, e0164830 Search PubMed.
- K. A. Zukotynski and V. H. Gerbaudo, PET Clin., 2017, 12, 53–62 CrossRef PubMed.
- F. W. L. Orr, D. Joanne and C. M. Wilhelmina, Cancer, 2000, 88, 2912–2918 CrossRef CAS PubMed.
- T. N. Trotter and Y. Yang, Matrix Biol., 2016, 52–54, 301–314 CrossRef CAS PubMed.
- H. H. Popper, Cancer Metastasis Rev., 2016, 35, 75–91 CrossRef CAS PubMed.
- H. Yamazoe, T. Ichikawa, Y. Hagihara and Y. Iwasaki, Acta Biomater., 2016, 31, 231–240 CrossRef CAS PubMed.
- R. Pu, Q. Zhao, Z. Li, L. Zhang, X. Luo, Y. Zeren, C. Yu and X. Li, Oncol. Lett., 2016, 12, 2023–2027 Search PubMed.
- K. Hochdörffer, K. Abu Ajaj, C. Schäfer-Obodozie and F. Kratz, J. Med. Chem., 2012, 55, 7502–7515 CrossRef PubMed.
- W. Ye, Y. Zhao, H. Li, R. Na, F. Li, Q. Mei, M. Zhao and S. Zhou, Sci. Rep., 2015, 5, 14614 CrossRef CAS PubMed.
- A. Srivastava, N. Amreddy, A. Babu, J. Panneerselvam, M. Mehta, R. Muralidharan, A. Chen, Y. D. Zhao, M. Razaq, N. Riedinger, H. Kim, S. Liu, S. Wu, A. B. Abdel-Mageed, A. Munshi and R. Ramesh, Sci. Rep., 2016, 6, 38541 CrossRef CAS PubMed.
- H. Dongeun, V. S. Torisawa, G. A. Hamilton, K. Hyun Jung and D. E. Ingber, Lab Chip, 2012, 12, 2156–2164 RSC.
- H. Kaji, G. Camci-Unal, R. Langer and A. Khademhosseini, Biochim. Biophys. Acta, Gen. Subj., 2011, 1810, 239–250 CrossRef CAS PubMed.
- O. Batnyam, H. Shimizu, K. Saito, T. Ishida, S.-i. Suye and S. Fujita, RSC Adv., 2015, 5, 80357–80364 RSC.
- A. Navaei, N. Moore, R. T. Sullivan, D. Truong, R. Q. Migrino and M. Nikkhah, RSC Adv., 2017, 7, 3302–3312 RSC.
- W. Dai, W. Li, K. Ren and H. Wu, ChemNanoMat, 2016, 2, 447–453 CrossRef CAS.
- Y. Li, X. Jiang, H. Zhong, W. Dai, J. Zhou and H. Wu, Small, 2016, 12, 1230–1239 CrossRef CAS PubMed.
- G. K. In and J. Nieva, Transl. Cancer Res., 2015, 4, 340–355 CAS.
- N. Zakaria, N. M. Yusoff, Z. Zakaria, M. N. Lim, P. J. N. Baharuddin, K. S. Fakiruddin and B. Yahaya, BMC Cancer, 2015, 15, 84 CrossRef PubMed.
- Y.-T. Jian, Y. Yang, T. Tian, C. Stanford, X.-P. Zhang and K. Zhao, PLoS One, 2016, 11, e0149051 CrossRef PubMed.
- W. S. Lee, K. S. Yeo, A. Andriyana, Y. G. Shee and F. R. M. Adikan, Mater. Des., 2016, 96, 470–475 CrossRef CAS.
- H. Miyoshi and T. Adachi, J. Tissue Eng., 2014, 20, 609–627 CrossRef CAS PubMed.
- C.-H. Song, O. Honmou, N. Ohsawa, K. Nakamura, H. Hamada, H. Furuoka, R. Hasebe and M. Horiuchi, J. Virol., 2009, 83, 5918–5927 CrossRef CAS PubMed.
- K. Nakamura, Y. Ito, Y. Kawano, K. Kurozumi, M. Kobune, H. Tsuda, A. Bizen, O. Honmou, Y. Niitsu and H. Hamada, Gene Ther., 2004, 11, 1155–1164 CrossRef CAS PubMed.
- Y. Wang, Y. Deng and G. Zhou, Brain Res., 2008, 1195, 104–112 CrossRef CAS PubMed.
- Y. Li, Z. Zheng, Z. Cao, L. Zhuang, Y. Xu, X. Liu, Y. Xu and Y. Gong, Colloids Surf., B, 2016, 141, 397–407 CrossRef CAS PubMed.
- S. Ansar Ahmed, R. M. Gogal and J. E. Walsh, J. Immunol. Methods, 1994, 170, 211–224 CrossRef CAS.
- L. Zhang, P. Zhang, Q. Zhao, Y. Zhang, L. Cao and Y. Luan, J. Colloid Interface Sci., 2016, 464, 126–136 CrossRef CAS PubMed.
- D. A. Dragatogiannis, V. P. Tsikourkitoudi and C. A. Charitidis, Plast., Rubber Compos., 2012, 41, 358–363 CrossRef CAS.
- M. Lekka, K. Pogoda, J. Gostek, O. Klymenko, S. Prauzner-Bechcicki, J. Wiltowska-Zuber, J. Jaczewska, J. Lekki and Z. Stachura, Micron, 2012, 43, 1259–1266 CrossRef PubMed.
- T. Garg, G. Rath and A. K. Goyal, J. Drug Targeting, 2015, 23, 202–221 CrossRef CAS PubMed.
- S. Suresh, Acta Mater., 2007, 55, 3989–4014 CrossRef CAS.
- M. Prabhune, G. Belge, A. Dotzauer, J. Bullerdiek and M. Radmacher, Micron, 2012, 43, 1267–1272 CrossRef PubMed.
- Z. Jing, M. Xiaoyu, L. Dan, S. Hengsong, Y. Yuan, T. Wei, Z. Huanjun, G. Han, Q. Jiangchao and L. Changsheng, Biomaterials, 2015, 53, 251–264 CrossRef PubMed.
- Q. Luo, D. Kuang, B. Zhang and G. Song, BBA, Biochim. Biophys. Acta, Gen. Subj., 2016, 1860, 1953–1960 CrossRef CAS PubMed.
- S. Munshi, R. C. Twining and R. Dahl, J. Pharmacol. Toxicol. Methods, 2014, 70, 195–198 CrossRef CAS PubMed.
- C. Y. Tay, M. Pal, H. Yu, W. S. Leong, N. S. Tan, K. W. Ng, S. Venkatraman, F. Boey, D. T. Leong and L. P. Tan, Small, 2011, 7, 1416–1421 CrossRef CAS PubMed.
- T. Yu, C. K. Chua, C. Y. Tay, F. Wen, H. Yu, J. K. Chan, M. S. Chong, D. T. Leong and L. P. Tan, Macromol. Biosci., 2013, 13, 799–807 CrossRef CAS PubMed.
- H. Li, F. Wen, Y. S. Wong, F. Y. Boey, V. S. Subbu, D. T. Leong, K. W. Ng, G. K. Ng and L. P. Tan, Acta Biomater., 2012, 8, 531–539 CrossRef CAS PubMed.
- Y.-L. Chen, T.-Y. Yang, C.-L. Wu, K.-C. Chen, S.-L. Hsu and C.-M. Hsueh, Chin. J. Physiol., 2016, 59, 331–347 CrossRef PubMed.
- S. Wang, X. Li, R. Zhu, Q. Han and R. C. Zhao, Int. J. Oncol., 2016, 48, 681–689 CAS.
Footnote |
| † Electronic supplementary information (ESI) available: Mechanical transducer setup for measuring minimum pressure applied to induce cell lysis; representative light microscope images of hMSCs on TCP after pressed for 10 s at the pressure of 49.0 kPa; live/dead assay to evaluate cell viability of hMSC on TCP after cell micropatterning process (hMSCs were pressed for 10 s under the pressure of 49.0 kPa); representative fluorescent microscope images of hMSCs on casein/chitosan multilayer films before micropatterning process and after micropatterning process; relative cell viability of A549 and OB after cultured in medium with various concentrations of DOX for 24 h; representative light and fluorescent microscope images of A549, A549/OB and OB cell micropatterns after incubated with DOX at a concentration of 100 μg ml−1 for 0, 6 and 24 h; representative light microscope images of A549 cells, A549 cell micropattern, A549/OB co-culture micropattern and OB cells after ALP staining. See DOI: 10.1039/c7ra01868a |
| This journal is © The Royal Society of Chemistry 2017 |

