 Open Access Article
Creative Commons Attribution 3.0 Unported Licence
Simultaneous HDS of DBT and 4,6-DMDBT over single-pot Ti-SBA-15-NiMo catalysts: influence of Si/Ti ratio on the structural properties, dispersion and catalytic activity
Saheed A. Ganiyu ab,
Syed Ahmed Alic and
Khalid Alhooshani
 *a
*a
aDepartment of Chemistry, King Fahd University of Petroleum & Minerals, Dhahran 31261, Saudi Arabia. E-mail: hooshani@kfupm.edu.sa; Fax: +966 13 860 7224; Tel: +966 13 860 3065
bCenter of Research Excellence in Nanotechnology, King Fahd University of Petroleum & Minerals, Dhahran 31261, Saudi Arabia
cCenter of Research Excellence in Petroleum Refining & Petrochemicals, King Fahd University of Petroleum & Minerals, Dhahran 31261, Saudi Arabia
First published on 19th April 2017
Abstract
A series of Ti-SBA-15-NiMo catalysts with Si/Ti ratios of 1, 2.5, 5, and 10 were prepared by a single-pot method. The dispersion and performance of the catalysts were characterized by N2 adsorption, temperature programmed techniques (NH3-TPD and H2-TPR), X-ray diffraction (XRD), and X-ray fluorescence (XRF) as well as by Raman and Fourier transform infrared (FTIR) spectroscopy. The catalytic activity was determined by simultaneous hydrodesulfurization (HDS) of dibenzothiophene (DBT) and 4,6-dimethyldibenzothiophene (4,6-DMDBT) in a batch autoclave reactor. Variations in the Si/Ti ratio resulted in noticeable differences in the characteristics of the catalysts. XRD diffractograms show that Ti is well incorporated into the SBA-15 support at Si/Ti ratios of 10 and 5. However, at Si/Ti ratios below 5, the Ti phases predominate and peaks corresponding to MoO3 phases were not observed. As the Ti incorporation is increased, the moderate surface acidity decreases while the contribution from strong acidity becomes evident. TPR results indicate that a higher amount of Ti increases the metal-support interaction. The HDS rates for DBT and 4,6-DMDBT over a catalyst with an Si/Ti ratio of 10 increased by 33% and 49%, respectively. The enhancement in HDS can be attributed to a lower metal-support interaction. However, a further increase in the Si/Ti ratio removed the enhancement in the HDS rates. A regenerated catalyst with an Si/Ti ratio of 10 exhibited 91% and 86% HDS compared to the fresh catalyst for DBT and DMDBT, respectively. Direct desulfurization was the preferred route for both DBT and 4,6-DMDBT. The HDS rate for DDS is enhanced by the addition of Ti while the HDS rate for the hydrogenation route remains almost constant. The divergent effects on the DDS and HYD pathways indicate that the active sites for hydrogenolysis and hydrogenation are different and are influenced differently by titania addition.
1 Introduction
Deep desulfurization of transportation fuels requires highly active and well-dispersed catalysts to comply with stringent environment-driven regulations as well as to process feedstock obtained from a deteriorating quality of crude oil.1,2 Achieving a highly dispersed active phase depends on the physicochemical properties of the support upon which the active phase is deposited, the nature of interactions between the support and active metals, the method of deposition, the composition of active species, the pH of the solution, the stirring rate and temperature, the aging temperature, the drying process, and the calcination temperature.3–5 The dispersion, reducibility, sulfidation, and morphology of the Ni(Co)Mo(W) supported hydrodesulfurization (HDS) catalysts are strongly influenced by the support.6 Therefore, a series of supports, such as Al2O3,7 SiO2,8 carbon,9 TiO2,10 ZrO2,11 ZrO2–TiO2,12 ZrO2–SiO2,13 TiO2–Al2O3,14 ZrO2–Al2O3,15 and mesoporous molecular sieves16,17 (MCM-41 and SBA-15) have been reported.Currently, the most common industrially used support for HDS catalysts is γ-alumina owing to its good mechanical and textural properties as well as abundance and low cost. However, the surface OH groups of γ-alumina result in strong interactions with Ni(Co)Mo(W)-oxide (referred to as a strong metal support interaction, SMSI) to form a type I active phase of low catalytic activity during sulfidation.18 In addition, coke formation on alumina supported HDS catalysts is considerable.19 Other types of supports such as ZrO2 and TiO2 have been explored. Their major drawback is low surface area and porosity, even though their intrinsic activity is high, but the specific activity is lower than that reported for alumina.20,21
The synthesis of various mesoporous molecular sieves has attracted great attention owing to their large surface area, good mechanical properties, hexagonal array, uniform pore channels, and hydrothermal stability.22,23 These materials have found different applications in catalysis (heterogeneous and photocatalysis),24,25 adsorption of environmental pollutants and large organic molecules,26,27 chromatographic separation,28 and advance-templated materials for metal-oxides29,30 and porous carbon.31,32
SBA-15, being an ordered 2D-p6mm hexagonal structure with high textural properties, thicker walls, and higher hydrothermal stability is more widely studied among mesoporous molecular sieves. It has the potential to become a viable support for hydroprocessing operations, especially for catalytic reactions involving bulky molecules present in heavy petroleum fractions.33,34 However, dispersion of the active phase remains an area of research focus. Different scientific approaches, such as the use of additives, the use of complexing agents, and modification with heteroatoms, have been reported to achieve dispersion of active species on SBA-15.35,36 The latter approach is receiving significant attention due to ease of incorporation either by direct or post-synthesis methods and the ability to improve the dispersion greatly via an increase from weak to moderate surface acidity.37
Kumaran et al.,38 reported the variation of the Si/Al ratio (10–40) in the Mo content in NiMo and CoMo supported SBA-15 as catalysts for thiophene HDS and cyclohexene hydrogenation. Their studies showed that the Mo dispersion and catalytic activities are greatly influenced by the ratio of Al present in the support, and the catalysts supported on Al-SBA-15 showed better performances than SBA-15 supported catalysts. Gutiérrez et al.21 synthesized NiMo supported on a series of Ti and Zr modified SBA-15 for the HDS of DMDBT. These catalysts showed better dispersion of active species in both oxidic and sulfided forms at 19 wt% Ti and 22 wt% Zr, as confirmed by XRD, TPR, and HRTEM, and they showed higher catalytic activity than SBA-15/NiMo catalysts. Klimova T. et al. prepared a series of Al-containing SBA-15 catalysts with different Si/Al ratios (10–50) by chemical grafting and tested these for the HDS of 4,6-DMDBT, and the catalytic activity increased with the Si/Al ratio (optimum at 20) due to strong interaction of active metals (NiMo) with Al serving as anchoring sites on the support.39 More recently, the effect of direct synthesis on Al-SBA-15 supports with different Si/Al ratios (40–2.5) for the HDS of DBT over NiMoS was reported.40 This study showed that enhanced catalytic activity and selectivity is related to the surface density and roughness of the support, and that the total acidity density of the support increases with the Al loading; the optimum Brønsted acid sites were found for Al-SBA-15(10).
Despite different reported studies on the effect of Si/X ratios (X = Al, Ti, or Zr) of heteroatoms on the dispersion and activity of supported Ni(Co)Mo(W)-S HDS catalysts, which are usually followed by the impregnation of active species, there are no reports on the one-pot synthesis of Ti-SBA-15-NiMo with varying Si/Ti ratios and, more importantly, the structural changes observed at higher Ti-loadings. In this study, we studied the effects of the Si/Ti ratio on the chemical and structural properties as well as the catalytic activities of Ti-SBA-15-NiMo catalysts with respect to simultaneous HDS of dibenzothiophene (DBT) and 4,6-dimethyldibenzo-thiophene (4,6-DMDBT).
2 Experimental
2.1 Materials and methods
The reagents required for catalyst preparation, such as tetraethylorthosilicate (TEOS) (C2H5O)4Si, pluronic P123 PEO20-PPO70-PEO20 triblock copolymer, nickel nitrate hexahydrate (Sigma-Aldrich, 99%), and titanium isopropoxide (97%) were purchased from Sigma-Aldrich, while ammonium molybdate(VI) tetrahydrate (99%) was purchased from ACROS organics. DBT (Sigma-Aldrich, 98%) and 4,6-DMDBT (Sigma-Aldrich, 97%) were used as model sulfur compounds present in gas oils. Dodecane (Merck Chemicals, >99%) was used as a solvent in catalyst evaluation tests without further purification. High-purity deionized water (DI-H2O) (18 μS cm−1) was produced in-house using Thermo Scientific Barnstead NANOPURE after distillation with a Labstrong FiSTREEM™ II 2S Glass Still distiller.2.2 Synthesis of titanium modified SBA-15-NiMo with different Si/Ti ratios
NiMo supported on a Ti-SBA-15 catalyst by a single-pot approach is prepared as described in our recent work.41 The typical synthesis procedure involves dissolution of 4 g of (P123) triblock copolymer in 120 g of 2 M HCl and 30 g DI-H2O and vigorous stirring for 1 h before addition of TEOS (8.32 g) and the required amount of titanium isopropoxide. The amount of Ti precursor was varied in order to prepare a series of catalysts with Si/Ti ratios of 1, 2.5, 5, and 10. The mixture was stirred for 18 h before addition of molybdenum and nickel that had been previously mixed with their respective precursors in DI-H2O to adjust the pH, and the whole mixture was stirred for an additional 6 h at room temperature (RT) before hydrothermal synthesis. The light-yellow mixture obtained after several hours of stirring was transferred into a Teflon holder in a stainless steel autoclave and subjected to hydrothermal (HT) synthesis at 80 °C for 20–24 h. The light-yellow solid was centrifuged once without further washing, to avoid leaching of active phase(s) into the solvent, and dried in an oven at 80 °C overnight before final calcination at 300 °C.The Ti containing catalysts are denoted as C(x), where x represents the Si/Ti ratio, and the catalyst without Ti is labeled as C. The Mo and Ni loadings in as-synthesized catalysts were kept constant at 8 and 3 wt%, respectively.
2.3 Catalyst characterization
The textural characteristics of Ti-SBA-15-NiMo catalysts were determined using a Micromeritics unit (ASAP 2020). Prior to analysis of adsorption and desorption isotherms, the calcined sample was degassed at 250 °C for 1.5 h under vacuum to remove physisorbed moisture and impurities.The crystallinity of the active species (Ni, Mo) and the heteroatom (Ti) was examined with a Rigaku X-ray diffraction system (XRD Miniflex using CuKα radiation (λ = 1.5406 Å) at a scan rate of 3 °C min−1 and a width of 0.03°). A Raman spectrometer (HORIBA, iHR320 with CCD detector) with a laser wavelength of 532 nm (300 mW, green laser) was used to characterize the MoO3 and TiO2 phases. FTIR spectroscopy was used to identify the functional groups present in the supports and catalysts. The absorption spectra of the Ti-SBA-15-NiMo catalysts were recorded on a Thermo Scientific Nicolet 6700 FTIR spectrometer with a scanning range of 400–4000 cm−1. The samples for FTIR analysis were prepared using KBr powder mixed with the catalyst at a ratio of 100![[thin space (1/6-em)]](https://www.rsc.org/images/entities/char_2009.gif) :
:![[thin space (1/6-em)]](https://www.rsc.org/images/entities/char_2009.gif) 2 to form pellet-like translucent discs.
2 to form pellet-like translucent discs.
Temperature programmed desorption (TPD) using 10 wt% NH3 as a probe to measure surface acidity and the number of active sites was performed on a Micromeritics Chemisorb 2750 (pulse chemisorption system). About 100 mg of oxidic NiMo supported on Ti-SBA-15 was loaded in a quartz tube and pretreated in a flow of helium at 600 °C for 30 min. The sample was cooled to 100 °C before passing 10% NH3 in helium at 25 mL min−1 for about 30 min, which was then followed by purging of helium at the same flow rate for 1 h to remove physically adsorbed NH3. Desorption of NH3 was achieved by heating the sample to 800 °C at 10°C min−1, and the data were recorded with a thermal conductivity detector (TCD) using TPx software for data analysis. The reducibility and dispersion of the catalysts were determined by temperature-programmed reduction (TPR) using hydrogen as the adsorbate with a Micromeritics (Autochem II-2920) chemisorption analyzer. About 30–40 mg of the catalyst, which was previously calcined at 300 °C, was pretreated for 1 h in high-purity helium at 400 °C and then cooled to ambient temperature before a temperature programmed reduction experiment with hydrogen. The reduction temperature characteristics of hydrogen consumption were measured by linearly increasing the furnace temperature at 10 °C min−1 to 1000 °C under a steady flow (50 mL min−1) of 10% hydrogen in helium. The consumption of hydrogen at the reduction temperature(s) was recorded with a thermal conductivity detector (TCD). The elemental compositions of bulk catalysts were determined and calculated with a SPECTRO XEPOS energy dispersive X-ray fluorescence (ED-XRF) spectrometer (AMETEK, Materials analysis division) equipped with AMECARE M2M.
The morphological structural variation of Ti-SBA-15-NiMo catalysts as a function of the Si/Ti ratio was examined with a scanning electron microscope (SEM), TESCAN LYRA 3, using secondary electron (SE) and backscattered electron (BSE) modes at an accelerating voltage of 30 kV. The unit was equipped with an energy-dispersive X-ray spectrometer (EDS, Oxford, Inc.) detector for elemental analysis.
2.4 Catalytic performance evaluation
Prior to catalytic evaluation, the pelletized catalyst samples (300–500 μm) were reduced for 150 min at 400 °C to form metallic active species and then sulfided with 2 wt% CS2 dissolved in cyclohexane at 350 °C (10 °C min−1) for 6 h. Binary solutes of DBT and 4,6-DMDBT (1000 ppm-S each) dissolved in hexadecane, which is employed as a model diesel fuel, were tested and evaluated for the HDS reaction in a high-pressure batch reactor (Parr 4576B). The temperature, initial pressure of H2, weight of sulfided catalyst, stirring speed of reactor, and feedstock volume were maintained constant at 350 °C, 5 MPa, 250 mg, 300 rpm, and 100 mL, respectively.Catalyst evaluation was conducted for 2 h after processing conditions were achieved and stabilized. The sulfur and hydrocarbon contents in the product were determined with a gas chromatography sulfur chemiluminescence detector (GC-SCD) and a mass spectrometer (GC-MS), respectively.
3 Results and discussion
3.1 Adsorption–desorption isotherm
Textural properties analysis of Ti-SBA-15-NiMo HDS catalysts at different Si/Ti ratios was conducted by calculating the BET surface areas and BJH adsorption pore volumes and pore sizes. The catalyst without added Ti exhibited a higher surface area and pore volume than the others. However, the pore size of catalyst C is similar to that of other catalysts prepared with added titanium (6–6.9 nm) (Table 1). An increase in the Ti content in the catalyst matrix resulted in a decrease in the BET surface area and micropore surface area up to C(5), and the surface area again increased between C(2.5) and C(1) due to formation of new catalytic material or phases attributed to TiO2 as discussed in the next section. It should be mentioned that the BET and the micropore surface areas of catalyst C(1) with the highest loading of titanium resemble those of C even without with the formation of new phases other than the active species of the catalyst. All catalysts exhibit the type-IV isotherms of mesoporous material with the characteristics of plugged nanoparticles as observed from two desorption steps on the isotherm loop, as shown in Fig. 1A; the pore-size distribution is presented in Fig. 1B.| Catalyst | BET surface area (m2 g−1) | Micropore area (m2 g−1) | External surface area (m2 g−1) | Total pore volume (cm3 g−1) | Average diameter (nm) |
|---|---|---|---|---|---|
| C | 570 | 68 | 502 | 0.89 | 6.1 |
| C(10) | 473 | 43 | 430 | 0.76 | 6.0 |
| C(5) | 423 | 37 | 386 | 0.79 | 6.6 |
| C(2.5) | 464 | 47 | 417 | 0.82 | 6.9 |
| C(1) | 562 | 67 | 495 | 0.85 | 6.4 |
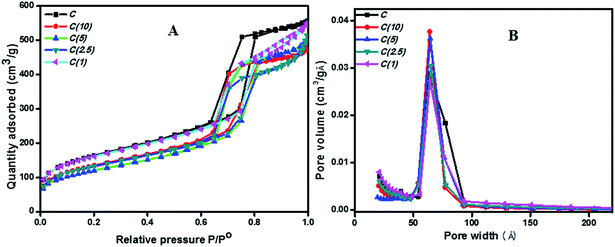 | ||
| Fig. 1 N2 adsorption–desorption isotherms by BET (A) and PSD by BJH-adsorption (B) for Ti-modified SBA-15 NiMo catalysts. | ||
3.2 XRD analysis of catalysts
Diffractograms of the oxide catalysts with different Si/Ti ratios are presented in Fig. 2. The incorporation of Ti into the siliceous matrix is described as being perfect due to the tetravalent nature of the latter atoms and the flexibility of Ti to anchor into the silicon framework without affecting its hexagonal structure.42 However, beyond a certain compositional ratio, titania phases dominate and the X-ray diffraction peaks of the HDS Ti-SBA-15-NiMo catalyst resemble those of silica-templated TiO2 pure anatase phases.43 As observed in Fig. 2, the titanium is well incorporated into the SBA-15 supports at Si/Ti ratios of 10 and 5, and the diffraction peaks can be indexed to (JCPSD 05-0508) of orthorhombic MoO3. At Si/Ti ratios below 5, the Ti phases predominate on the XRD diffractograms, and peaks corresponding to MoO3 phases were not observed. This indicates structural and physicochemical changes to the HDS catalyst, which might induce differences in catalytic behavior.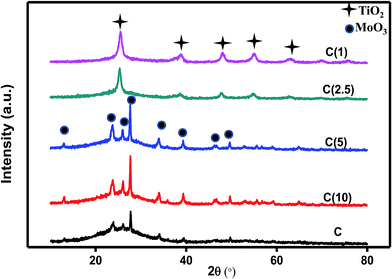 | ||
| Fig. 2 X-ray diffraction (XRD) analysis of Ti-modified SBA-15 NiMo catalysts at different Si/Ti ratios. | ||
3.3 Temperature programmed desorption
The number of active sites with respect to structural changes in Ti-modified-SBA-15-NiMo HDS catalysts were examined with a quantitative amount of ammonia desorbed by temperature programmed analysis. The nature of the surface acidity of as-synthesized catalysts, as determined by the amount of NH3 desorbed, is a combination of moderate and strong acidity, and the former dominates as shown in Fig. 3. An interesting result, which can be correlated to the catalyst activity, is obtained. Catalyst C prepared with no incorporation of titanium shows the highest amount of desorbed NH3 at moderate acidity, which may be interpreted as better dispersion. However, catalyst C also exhibits strong surface acidity at a relatively higher temperature (712 °C) compared to catalyst C(10). As the amount of titanium increases in the silica–titania composite catalysts, the characteristic strong surface acidity increases as reflected by the increase in the amount of NH3 desorbed. Furthermore, as the titanium incorporation is increased, the amount of ammonia desorbed at moderate surface acidity decreases while the contribution from the strong acidity becomes evident. This observation can be attributed to the decrease in the dispersion of active metals on the support with the increase in the Si/Ti ratio. However, catalyst C(1) is unique as it exhibits the lowest amount of moderate surface acidity but extremely high strong acidity (Table 2).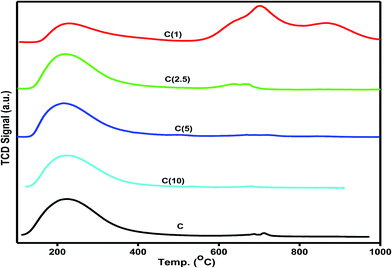 | ||
| Fig. 3 Ammonia temperature programmed desorption analysis of Ti-modified SBA-15 NiMo catalysts at different Si/Ti ratios. | ||
| Catalyst | TPD: NH3 desorbed | ||||
|---|---|---|---|---|---|
| Peak temperature (200–350 °C) | Amount (μmol g−1) | Peak temperature (>350 °C) | Amount (μmol g−1) | Total (μmol g−1) | |
| C | 223 | 489 | 712 | 9 | 498 |
| C(10) | 223 | 400 | 682 | 4 | 404 |
| C(5) | 216 | 366 | 669 | 9 | 375 |
| C(2.5) | 218 | 375 | 671 | 26 | 401 |
| C(1) | 229 | 200 | 703, 875 | 134 | 334 |
3.4 Temperature programmed reduction
The reducibility and degree of sulfidation can be measured by temperature programmed reduction analysis using H2 as a probe molecule. The degree of reducibility of active species in as-developed HDS catalysts has been altered by varying the Si/Ti ratio; therefore, the degree of sulfidation and dispersion of active species can be correlated. As shown in Fig. 4, the first reduction peak is associated with reduction of Mo6+ to Mo4+, while the second reduction peak over an extended temperature range is for reduction of Mo4+ to Mo0.44 The first reduction peaks of hydrogen consumption for catalysts C, C(10), C(5), and C(2.5) were between 502 and 506 °C, while catalyst C(1) exhibits a lower reduction peak at 471 °C due to an increase in the amount of Ti in the catalyst matrix. The second H2 reduction temperatures for catalysts C(2.5) and C(1) were significantly higher than those for catalysts with higher Si/Ti ratios (C(10) and C(5)). These results indicate that the higher amount of titanium in catalysts C(2.5) and C(1) increases the metal-support interaction, resulting in a shift of the reduction temperature to a higher value (Table 3). These results are in good agreement with the NH3-TPD results. The strong interaction of the active phase for the supported catalyst has been reported to cause a decrease in the catalyst activity and selectivity.45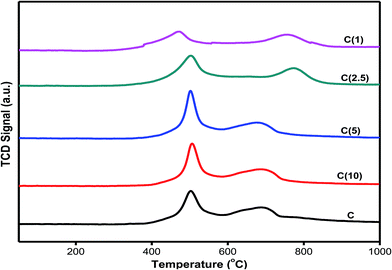 | ||
| Fig. 4 Hydrogen temperature programmed reduction analysis of Ti-modified SBA-15 NiMo HDS catalysts at different Si/Ti ratios. | ||
| Catalyst | TPR: H2-consumption | |||
|---|---|---|---|---|
| Peak temperature (°C) | Amount (mmol g−1) | Peak temperature (°C) | Amount (mmol g−1) | |
| C | 502 | 453 | 688 | 485 |
| C(10) | 502 | 546 | 685 | 512 |
| C(5) | 502 | 520 | 682 | 436 |
| C(2.5) | 503 | 459 | 777 | 372 |
| C(1) | 471 | 425 | 759 | 402 |
In addition, the degree of interaction of the active phase with the support as a function of the dispersion can be correlated to the amount of hydrogen consumed by each catalyst at different reduction temperatures. The results presented in Table 3 indicate that the amount of hydrogen consumed at the first peak (about 500 °C) increased with the addition of titanium for catalysts C(10), C(5), and C(2.5). However, further addition of titanium for C(1) resulted in a decrease in the amount of hydrogen consumed. This shows that molybdenum particles are possibly confined within the support structure, as the amount of H2 needed is higher. The typical H2-TPR behavior of C(2.5) and C(1) at the second reduction peak seems to be in line with the NH3-TPD results, which indicate very strong acidity. Therefore, an optimum loading of titanium for improved dispersion of active metals is established for catalysts C(10) and C(5).
3.5 XRF spectroscopy
X-ray fluorescence spectroscopy of bulk samples was used to determine the elemental composition of the catalysts in oxide form. Table 4 shows the actual composition of each element compared to the calculated amount. The Mo loading amount in catalyst C shows the lowest value and C(1) shows the highest, in comparison to catalysts in the series; however, all the catalysts possess good quantitative and statistical amounts. In addition, the order of Si/Ti ratios observed correlates well with the calculated amounts, and the actual amount of nickel is less than the calculated amount owing to the reason reported in our previous work.41| Catalyst | Elements | ||
|---|---|---|---|
| Mo (%) | Ni (%) | Si/Ti | |
| a Note: The values in parentheses are the calculated amounts. | |||
| C | 7.65 (8) | 1.40 (3) | — |
| C(10) | 7.86 (8) | 1.62 (3) | 10.1 (10) |
| C(5) | 7.86 (8) | 1.34 (3) | 5.23 (5) |
| C(2.5) | 7.90 (8) | 1.23 (3) | 2.9 (2.5) |
| C(1) | 7.95 (8) | 1.20 (3) | 1.3 (1) |
3.6 Raman spectroscopy
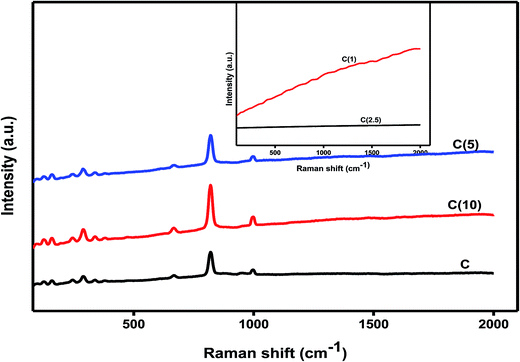
Raman spectroscopy is an excellent technique to study, not only the mode of vibrations, but also the dispersion and oxidation states of active metals for catalytic applications. It is a complimentary technique to XRD and is used to study the crystallinity and dispersion of most of the active metals in different catalysis fields.46 The oxide phases of molybdenum and titanium at different Si/Ti ratios in as-developed HDS catalysts were investigated by Raman spectrometry using 532 nm green lasers. The characteristic MoO3 Raman bands at 994 cm−1, assigned to a symmetric stretching mode of M![[double bond, length as m-dash]](https://www.rsc.org/images/entities/char_e001.gif) O groups, and Mo–O–Mo vibrations (due to stretching mode) at 819 and 665 cm−1 are usually observed for crystalline MoO3 particles. Furthermore, the wagging mode of vibrations corresponding to terminal Mo
O groups, and Mo–O–Mo vibrations (due to stretching mode) at 819 and 665 cm−1 are usually observed for crystalline MoO3 particles. Furthermore, the wagging mode of vibrations corresponding to terminal Mo![[double bond, length as m-dash]](https://www.rsc.org/images/entities/char_e001.gif) O is at 290–280 cm−1, and the bands at 336 and 375 cm−1 could be assigned to the bending and deformation modes of vibrations of O
O is at 290–280 cm−1, and the bands at 336 and 375 cm−1 could be assigned to the bending and deformation modes of vibrations of O![[double bond, length as m-dash]](https://www.rsc.org/images/entities/char_e001.gif) Mo
Mo![[double bond, length as m-dash]](https://www.rsc.org/images/entities/char_e001.gif) O and O–Mo–O, respectively.47,48 As shown in Fig. 5, the effect of the Si/Ti ratios was noticeable and correlated with structural changes observed in the XRD characterization results. We observed no structural changes to the modes of vibrations of molybdenum species at low Si/Ti ratios (5–10), and all assigned Raman peaks were visible as described above. In contrast, a different trend was observed when the ratio of Si/Ti was between 1 and 2.5; the Raman mode of vibrations for MoO3 was no longer visible, and a high fluorescence background was observed without reference peaks to titania as observed in XRD analysis.
O and O–Mo–O, respectively.47,48 As shown in Fig. 5, the effect of the Si/Ti ratios was noticeable and correlated with structural changes observed in the XRD characterization results. We observed no structural changes to the modes of vibrations of molybdenum species at low Si/Ti ratios (5–10), and all assigned Raman peaks were visible as described above. In contrast, a different trend was observed when the ratio of Si/Ti was between 1 and 2.5; the Raman mode of vibrations for MoO3 was no longer visible, and a high fluorescence background was observed without reference peaks to titania as observed in XRD analysis.
3.7 FTIR analysis
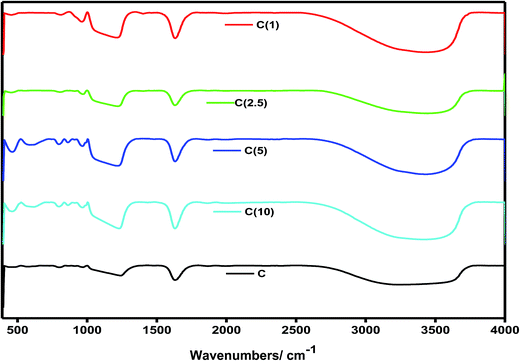
An insight into the incorporation of Ti and NiMo into the mesoporous silica SBA-15 framework was obtained by means of FTIR. The identification and assignment of peaks for catalysts with different Si/Ti ratios were conducted with reference to their characteristic features, as shown in Fig. 6. The observed broad band at 1100 cm−1 is assigned to the Si–O–Si asymmetric mode of vibrations, while the symmetric stretching and bending associated with Si–O–Si appeared at 805 cm−1 and 466 cm−1, respectively. The characteristic stretching band due to incorporation of Ti and active metal oxide species into the SBA-15 matrix (Si–O–X, X = Ti, Ni, Mo) is observed at 960 cm−1. The surface hydroxyl of the silanol end group of (Si–OH) and metal hydroxides (M–OH) is observed over a broad region from 3100–3700 cm−1. This characteristic peak is used as an indication of structural change or the effect of an increase in the Ti content of the HDS catalysts. This band shrinks as the ratio or amount of Ti increases in the catalyst, which is due to increased substitution of hydroxyl groups by Ti-atoms.49 In addition, the intensity of the band at 960 cm−1 due to Si–O–X interactions is more pronounced when Si/Ti is low, and this indicates an increase in the Ti content in the structure of the catalyst. The bands due to molybdenum species appear at 800–1200 cm−1 and, more specifically, the tetrahedral mode appeared at 830–930 cm−1, while the octahedral mode of vibrations was found at 800–860 and 930–990 cm−1.503.8 Scanning electron microscopy
Morphological examination and variation due to varying Si/Ti ratios in the prepared catalysts are presented in Fig. 7. The morphology of catalysts C and C(1) closely resembles that of pure and unmodified SBA-15, with its characteristic long-channel hexagonal structure. With an increase in the Ti content, there is morphological variation, which might be due to intra-growth of TiO2 and the main SBA-15 phases, as the long-channel hexagonal morphology of SBA-15 is distorted or disturbed. This observation is in perfect agreement with XRD analysis (Section 3.2), where titanium phases corresponding to anatase dominate at higher Ti contents, especially for C(2.5) and C(1). In addition, catalyst C(1) shows the presence of extra particles wound around the support and appears more encapsulated than other materials with lower Ti contents.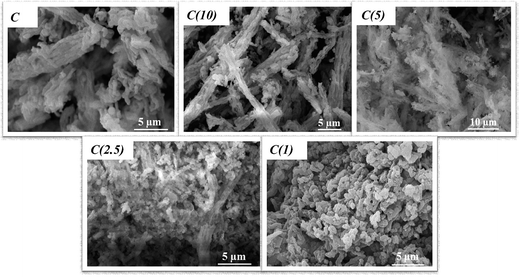 | ||
| Fig. 7 SEM analysis of Ti-modified SBA-15 NiMo HDS catalysts at different Si/Ti ratios (showing morphology variation as Ti-content increases). | ||
3.9 Simultaneous HDS of DBT and 4,6-DMDBT
The activities of the Ti-SBA-NiMo catalysts as a function of their Si/Ti ratios were evaluated in a batch autoclave reactor according to the procedure described in Section 2.4. The HDS of DBT (xDBT) over different catalysts is presented in Table 5. The HDS of DBT increases from 82% to about 90% (as a result of the addition of small quantities of titanium) over catalysts C(10) and C(5) compared to catalyst C. However, a further increase in the quantity of titanium was not beneficial for the HDS of DBT. The improvement in activity was more pronounced for the HDS of 4,6-DMDBT (Table 6). The HDS of 4,6-DMDBT increases from 62% to about 75% over catalysts C(10) and C(5). A further increase in the quantities of titanium resulted in almost the same 4,6-DMDBT conversion as with the catalyst without titania. These trends are in line with the characterization data, which showed better dispersion in catalysts C(10) and C(5) compared to catalysts C(2.5) and C(1).| Catalyst | xDBT | yBP | yCHB | kDBT × 103 (min−1) | kDDS × 103 (min−1) | kHYD × 103 (min−1) | kDDS/kHYD |
|---|---|---|---|---|---|---|---|
| a xDBT: fraction of DBT converted from the initial concentration of 1000 ppmw-S. yBP: BP fraction in the HDS product. yCHB: CHB fraction in the HDS product. kDBT: rate constant for overall HDS of DBT. kDDS: rate constant for HDS of DBT by direct desulfurization route. kHYD: rate constant for HDS of DBT by hydrogenation route. | |||||||
| C | 0.82 | 0.66 | 0.16 | 14.2 | 8.9 | 1.5 | 6.0 |
| C(10) | 0.90 | 0.73 | 0.17 | 18.9 | 10.9 | 1.5 | 7.0 |
| C(5) | 0.88 | 0.71 | 0.17 | 17.9 | 10.5 | 1.5 | 7.0 |
| C(2.5) | 0.82 | 0.69 | 0.13 | 14.2 | 9.7 | 1.2 | 8.1 |
| C(1) | 0.81 | 0.69 | 0.12 | 14.1 | 9.8 | 1.1 | 8.9 |
| C(10) (regenerated) | 0.82 | 0.71 | 0.11 | 14.3 | 10.3 | 1.0 | 10.3 |
| Catalyst | xDMDBT | yDMBP | yDMCHB | kDMDBT × 103 (min−1) | kDDS × 103 (min−1) | kHYD × 103 (min−1) | kDDS/kHYD |
|---|---|---|---|---|---|---|---|
| a xDMDBT: fraction of 4,6-DMBT converted from the initial concentration of 1000 ppmw-S. yDMBP: DMBP fraction in the HDS product. yDMCHB: DMCHB fraction in the HDS product. kDMDBT: rate constant for overall HDS of 4,6-DMDBT. kDDS: rate constant for HDS of 4,6-DMDBT by direct desulfurization route. kHYD: rate constant for HDS of 4,6-DMDBT by hydrogenation route. | |||||||
| C | 0.62 | 0.51 | 0.11 | 8.0 | 6.0 | 1.0 | 6.0 |
| C(10) | 0.76 | 0.63 | 0.13 | 11.9 | 8.3 | 1.1 | 7.5 |
| C(5) | 0.73 | 0.61 | 0.12 | 10.9 | 7.9 | 1.1 | 7.2 |
| C(2.5) | 0.63 | 0.56 | 0.07 | 8.2 | 6.7 | 0.7 | 9.6 |
| C(1) | 0.62 | 0.58 | 0.04 | 8.1 | 7.3 | 0.3 | 24.3 |
| C(10) (regenerated) | 0.65 | 0.55 | 0.10 | 8.8 | 6.7 | 0.9 | 7.4 |
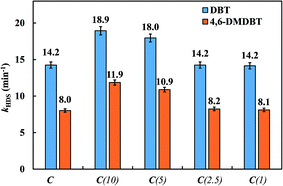
The HDS rates were calculated assuming pseudo-first-order kinetics, and the values of the reaction constant, k (min−1), are presented in Tables 5 and 6. The values for the HDS rate for DBT, kDBT, are in the range 14–19 × 10−3 min−1, whereas the values for the HDS rate for 4,6-DMDBT, kDMDBT, are in the range 8–12 × 10−3 min−1. The lower rate of HDS of 4,6-DMDBT compared to that of DBT is in accordance with the trends reported for simultaneous HDS of DBT and 4,6-DMDBT over CoMoP/Al2O3 catalysts.51
Compared to catalyst C, the HDS rate for DBT, kDBT, increased by 33% for catalyst C(10) and by 26% for catalyst C(5). The enhancement in the HDS rate was more prominent in the case of 4,6-DMDBT. Compared to catalyst C, the HDS rate for 4,6-DMDBT, kDBT, increased by 49% for catalyst C(10) and by 36% for catalyst C(5). However, a further increase in the Si/Ti ratio in the catalysts removed the enhancement in the HDS rates due to Ti addition. Hence, the HDS rates for catalysts C(2.5) and C(1) were almost the same as that of catalyst C for DBT as well as for 4,6-DMDBT (Fig. 8). These results can be attributed to increased metal-support interaction in catalysts C(2.5) and C(1) as observed in NH3-TPD and H2-TPR data.
The HDS of DBT occurs via two parallel pathways as reported previously:41 (i) direct desulfurization (DDS) or hydrogenolysis by C–S bond cleavage in a single step or (ii) hydrogenation (HYD) in 2–3 steps through the hydrogenation of one of the phenyl rings followed by C–S bond cleavage. The HDS of DBT via the DDS pathway yields biphenyl (BP) and H2S as the final products. However, the HYD pathway results in the formation of intermediates, such as tetrahydrodibenzothiophene (THDBT) and hexahydrodibenzothiophene (HHDBT), followed by fast desulfurization to form cyclohexylbenzene (CHB). Similarly, the HDS of 4,6-DMDBT forms dimethylbiphenyl (DMBP) and dimethylcyclohexylbenzene (DMCHB) by the DDS and HYD routes of HDS, respectively. Because the DDS pathway consumes substantially less hydrogen, it is the preferred route.
The analysis of products obtained from the HDS of DBT over different synthesized catalysts is presented in Table 5. BP is the predominant compound in all products, indicating that DDS is the generally preferred route. The values obtained for the rate of HDS of DBT by the direct desulfurization route, kDDS, indicate that HDS by DDS is enhanced by the addition of Ti. The highest improvement is observed for catalyst C(10). However, a further increase in titania content resulted in a lower kDDS. On the other hand, the values obtained for the rate of HDS of DBT by the hydrogenation route, kHYD, remain almost constant with a slight decrease for catalysts C(2.5) and C(1). The divergent effects on the DDS and HYD pathways indicate that the active sites for hydrogenolysis and hydrogenation are different and are influenced differently by titania addition. However, the kDDS/kHYD ratio continues to increase with the addition of Ti, which is desirable due to lower hydrogen consumption.
The analysis of products obtained from the HDS of 4,6-DMDBT over different synthesized catalysts is presented in Table 6. Hydrogenation of DBT and DMDBT mainly occurs through π-bonding with the catalyst, while the hydrogenolysis occurs through σ-adsorption via the sulfur atom of the molecule. The difficulty in converting the alkyl-substituted DBT compounds is known to be related to the steric hindrance of the alkyl groups positioned close to the sulfur atom, which prevents the interaction of these molecules with the active sites of the catalyst through σ-adsorption. The partial saturation of one of the rings through π-bonding, which is not sterically hindered in these compounds, changes their spatial configuration, which reduces the hindrance effect and makes them more flexible and accessible to the reaction sites of the catalyst.52,53 Hence, HYD is the preferential route for the HDS of 4,6-DMDBT over CoMo/Al2O3 or NiMo/Al2O3 catalysts.51,53 However, DMBP is the predominant compound in all products, indicating that DDS is the generally preferred route over Ti-SBA-NiMo catalysts. The hydrogenolysis sites that are responsible for C–S bond cleavage appear to be more active in Ti-SBA-NiMo catalysts than in Al2O3-supported catalysts due to relatively weaker metal-support interactions. Thus, the values obtained for the rate of HDS of 4,6-DMDBT by the direct desulfurization route, kDDS, indicate that HDS by DDS is enhanced by the addition of Ti. As in the case of DBT, the highest improvement is observed for catalyst C(10). On the other hand, the values obtained for the rate of HDS of DBT by the hydrogenation route, kHYD, remain almost constant with a decrease for catalyst C(2.5) and a drastic decrease for catalyst C(1).
The exceptional case of very low hydrogenation activity for catalyst C(1) can be attributed to its unique characteristics, which are very high strong acidity (Table 2) and very high hydrogen consumption at lower peak temperatures (Table 3). While the rate of the overall HDS of 4,6-DMDBT (k4,6-DMDBT) over catalyst C(1) is comparable to that over catalyst C, it should be noted that the kDDS/kHYD ratio of 24.3 is unusually high. This result, especially for the HDS of 4,6-DMDBT (which is considered as the most refractory sulfur compound) demonstrates the significant benefit of the composite silica–titania support.
3.10 Regeneration of HDS catalyst
In order to test the robustness of the prepared catalysts, regeneration of the catalyst (C-10) that exhibited the highest HDS activity was conducted by washing with acetone (5 mL per gram of catalyst) and calcination (3 h). The calcination temperature was 300 °C, which was the same temperature as that used while preparing the fresh catalyst, to prevent significant loss of textural properties by excess heat treatment. The regenerated catalyst was resulfided by the procedure described in Section 2.4.The textural properties of the regenerated catalyst were comparable with those of the fresh catalyst based on an insignificant loss of the BET surface area (from 473 m2 g−1 to 421 m2 g−1) and a slight increase in the total pore volume (from 0.76 cm3 g−1 to 0.84 cm3 g−1). The Si/Ti ratio in the regenerated sample was 9.9 compared to 10.1 for the fresh catalyst. These results show that regeneration restored the main characteristics of the catalyst.
The activity of the regenerated catalyst was compared with that of the fresh catalyst, as shown in Tables 5 and 6 for DBT and DMDBT, respectively. The desulfurization with the regenerated catalyst was 90% and 86% for DBT and DMDBT, respectively, as compared to that with the fresh catalyst.
4 Conclusions
A series of Ti-SBA-15-NiMo catalysts with Si/Ti ratios of 1, 2.5, 5, and 10 were prepared by a single-pot method. The catalysts were characterized by N2 adsorption, temperature programmed techniques (NH3-TPD and H2-TPR), X-ray diffraction (XRD), and Raman and Fourier transform infrared (FTIR) spectroscopy. The catalytic activity was determined by simultaneous hydrodesulfurization (HDS) of dibenzothiophene (DBT) and 4,6-dimethyldibenzothiophene (4,6-DMDBT) in a batch autoclave reactor. Variation in the Si/Ti ratio resulted in noticeable differences in the characteristics of the catalysts. XRD diffractograms show that titanium is well incorporated into the SBA-15 support at Si/Ti ratios of 10 and 5. However, at Si/Ti ratios below 5, the Ti phases predominate and peaks corresponding to MoO3 phases were not observed. As the Ti incorporation is increased, the moderate surface acidity decreases while the contribution from strong acidity becomes evident. TPR results indicate that a higher amount of Ti increases the metal-support interaction.The HDS rates for DBT and 4,6-DMDBT over a catalyst with an Si/Ti ratio of 10 increased by 33% and 49%, respectively. The enhancement in HDS can be attributed to a lower metal-support interaction. However, a further increase in the Si/Ti ratio removed the enhancement in the HDS rates. Direct desulfurization was the preferred route for both DBT and 4,6-DMDBT. The HDS rate for DDS was enhanced by the addition of Ti while the HDS rate for the hydrogenation route remained almost constant. The divergent effects on the DDS and HYD pathways indicate that the active sites for hydrogenolysis and hydrogenation are different and are influenced differently by titania addition. The characterization and activity tests on the regenerated catalyst showed that the Ti-SBA-15-NiMo catalysts are reasonably robust.
The exceptional case of very low hydrogenation activity for catalyst C(1) can be attributed to its unique characteristics, which are very high strong acidity (Table 2) and very high hydrogen consumption at lower peak temperatures (Table 3). While the rate of the overall HDS of 4,6-DMDBT (k4,6-DMDBT) over catalyst C(1) is comparable to that over catalyst C, it should be noted that the kDDS/kHYD ratio of 24.3 is unusually high. This result, especially for the HDS of 4,6-DMDBT (which is considered as the most refractory sulfur compound) demonstrates the significant benefit of the composite silica–titania support.
Acknowledgements
The authors acknowledge the support provided by King Fahd University of Petroleum & Minerals (KFUPM) for funding this work through project No. DSR NUS15105.References
- C. S. Hsu and P. Robinson, Practical advances in petroleum processing, Springer Science & Business Media, 2007 Search PubMed.
- O. Y. Gutiérrez and T. Klimova, J. Catal., 2011, 281, 50–62 CrossRef.
- R. Y. Parapat, O. H. Saputra, A. P. Ang, M. Schwarze and R. Schomäcker, RSC Adv., 2014, 4, 50955–50963 RSC.
- S. L. Suib, New and Future Developments in Catalysis: Catalysis by Nanoparticles, Newnes, 2013 Search PubMed.
- C.-J. Jia and F. Schüth, Phys. Chem. Chem. Phys., 2011, 13, 2457–2487 RSC.
- Y. Okamoto, M. Breysse, G. M. Dhar and C. Song, Catal. Today, 2003, 86, 1–3 CrossRef CAS.
- F. Dumeignil, K. Sato, M. Imamura, N. Matsubayashi, E. Payen and H. Shimada, Appl. Catal., A, 2003, 241, 319–329 CrossRef CAS.
- F. Sun, W. Wu, Z. Wu, J. Guo, Z. Wei, Y. Yang, Z. Jiang, F. Tian and C. Li, J. Catal., 2004, 228, 298–310 CrossRef CAS.
- J. J. Lee, S. Han, H. Kim, J. H. Koh, T. Hyeon and S. H. Moon, Catal. Today, 2003, 86, 141–149 CrossRef CAS.
- Y. Okamoto, A. Maezawa and T. Imanaka, J. Catal., 1989, 120, 29–45 CrossRef CAS.
- K. S. Rao, H. Ramakrishna and G. M. Dhar, J. Catal., 1992, 133, 146–152 CrossRef CAS.
- G. M. Dhar, B. Srinivas, M. Rana, M. Kumar and S. Maity, Catal. Today, 2003, 86, 45–60 CrossRef CAS.
- M. S. Rana, B. N. Srinivas, S. K. Maity, G. Murali Dhar and T. S. R. Prasada Rao, J. Catal., 2000, 195, 31–37 CrossRef CAS.
- W. Zhaobin, X. Qin, G. Xiexian, E. Sham, P. Grange and B. Delmon, Appl. Catal., 1990, 63, 305–317 CrossRef.
- M. A. Al-Daous and S. A. Ali, Fuel, 2012, 97, 662–669 CrossRef CAS.
- A. Wang, L. Ruan, Y. Teng, X. Li, M. Lu, J. Ren, Y. Wang and Y. Hu, J. Catal., 2005, 229, 314–321 CrossRef CAS.
- L. Lizama and T. Klimova, Appl. Catal., B, 2008, 82, 139–150 CrossRef CAS.
- H. Topsøe, Appl. Catal., A, 2007, 322, 3–8 CrossRef.
- F. Cui, G. Li, X. Li, M. Lu and M. Li, Catal. Sci. Technol., 2015, 5, 549–555 CAS.
- M. Jia, P. Afanasiev and M. Vrinat, Appl. Catal., A, 2005, 278, 213–221 CrossRef CAS.
- O. Y. Gutiérrez, G. A. Fuentes, C. Salcedo and T. Klimova, Catal. Today, 2006, 116, 485–497 CrossRef.
- C. Kresge, M. Leonowicz, W. Roth, J. Vartuli and J. Beck, nature, 1992, 359, 710–712 CrossRef CAS.
- J. Beck, J. Vartuli, W. J. Roth, M. Leonowicz, C. Kresge, K. Schmitt, C. Chu, D. H. Olson, E. Sheppard and S. McCullen, J. Am. Chem. Soc., 1992, 114, 10834–10843 CrossRef CAS.
- W.-H. Zhang, J. Lu, B. Han, M. Li, J. Xiu, P. Ying and C. Li, Chem. Mater., 2002, 14, 3413–3421 CrossRef CAS.
- M.-J. López-Muñoz, R. van Grieken, J. Aguado and J. Marugán, Catal. Today, 2005, 101, 307–314 CrossRef.
- A. Liu, K. Hidajat, S. Kawi and D. Zhao, Chem. Commun., 2000, 1145–1146 RSC.
- Y.-J. Han, G. D. Stucky and A. Butler, J. Am. Chem. Soc., 1999, 121, 9897–9898 CrossRef CAS.
- S. J. Bae, S.-W. Kim, T. Hyeon and B. M. Kim, Chem. Commun., 2000, 31–32 CAS.
- Y. M. Wang, Z. Y. Wu, L. Y. Shi and J. H. Zhu, Adv. Mater., 2005, 17, 323–327 CrossRef CAS.
- B. Tian, X. Liu, H. Yang, S. Xie, C. Yu, B. Tu and D. Zhao, Adv. Mater., 2003, 15, 1370–1374 CrossRef CAS.
- S. Jun, S. H. Joo, R. Ryoo, M. Kruk, M. Jaroniec, Z. Liu, T. Ohsuna and O. Terasaki, J. Am. Chem. Soc., 2000, 122, 10712–10713 CrossRef CAS.
- R. Ryoo, S. H. Joo, M. Kruk and M. Jaroniec, Adv. Mater., 2001, 13, 677–681 CrossRef CAS.
- D. Zhao, Q. Huo, J. Feng, B. F. Chmelka and G. D. Stucky, J. Am. Chem. Soc., 1998, 120, 6024–6036 CrossRef CAS.
- L. Vradman, M. V. Landau, M. Herskowitz, V. Ezersky, M. Talianker, S. Nikitenko, Y. Koltypin and A. Gedanken, J. Catal., 2003, 213, 163–175 CrossRef CAS.
- M. Sun, D. Nicosia and R. Prins, Catal. Today, 2003, 86, 173–189 CrossRef CAS.
- S. Badoga, A. K. Dalai, J. Adjaye and Y. Hu, Ind. Eng. Chem. Res., 2014, 53, 2137–2156 CrossRef CAS.
- P. Rayo, J. Ramírez, M. S. Rana, J. Ancheyta and A. Aguilar-Elguézabal, Ind. Eng. Chem. Res., 2009, 48, 1242–1248 CrossRef CAS.
- G. Muthu Kumaran, S. Garg, K. Soni, M. Kumar, L. D. Sharma, G. Murali Dhar and K. S. Rama Rao, Appl. Catal., A, 2006, 305, 123–129 CrossRef.
- T. Klimova, J. Reyes, O. Gutiérrez and L. Lizama, Appl. Catal., A, 2008, 335, 159–171 CrossRef CAS.
- S. Jiang, Y. Zhou, S. Ding, Q. Wei, W. Zhou and Y. Shan, RSC Adv., 2016, 6, 106680–106689 RSC.
- S. A. Ganiyu, K. Alhooshani and S. A. Ali, Appl. Catal., B, 2016, 203, 428–441 CrossRef.
- A. Tuel, Microporous Mesoporous Mater., 1999, 27, 151–169 CrossRef CAS.
- D.-W. Lee, S.-J. Park, S.-K. Ihm and K.-H. Lee, Chem. Mater., 2007, 19, 937–941 CrossRef CAS.
- M. Á. Calderón-Magdaleno, J. A. Mendoza-Nieto and T. E. Klimova, Catal. Today, 2014, 220, 78–88 CrossRef.
- K. C. Mouli, K. Soni, A. Dalai and J. Adjaye, Appl. Catal., A, 2011, 404, 21–29 CrossRef.
- W. Li, G. D. Meitzner, R. W. Borry and E. Iglesia, J. Catal., 2000, 191, 373–383 CrossRef CAS.
- G. Mestl, P. Ruiz, B. Delmon and H. Knozinger, J. Phys. Chem., 1994, 98, 11269–11275 CrossRef CAS.
- M. Dieterle, G. Weinberg and G. Mestl, Phys. Chem. Chem. Phys., 2002, 4, 812–821 RSC.
- K. K. Soni, K. C. Mouli, A. Dalai and J. Adjaye, Microporous Mesoporous Mater., 2012, 152, 224–234 CrossRef CAS.
- S. Maity, M. Rana, S. Bej, J. Ancheyta-Juarez, G. M. Dhar and T. P. Rao, Appl. Catal., A, 2001, 205, 215–225 CrossRef CAS.
- S. A. Ali, S. Ahmed, K. Ahmed and M. Al-Saleh, Fuel Process. Technol., 2012, 98, 39–44 CrossRef CAS.
- T. Kabe, A. Ishihara and Q. Zhang, Appl. Catal., A, 1993, 97, L1–L9 CrossRef CAS.
- M. Egorova and R. Prins, J. Catal., 2004, 225, 417–427 CrossRef CAS.
| This journal is © The Royal Society of Chemistry 2017 |

