 Open Access Article
Creative Commons Attribution 3.0 Unported Licence
Synthesis, characterization and investigation of methyl orange dye removal from aqueous solutions using waterborne poly vinyl pyrrolidone (PVP) stabilized poly aniline (PANI) core–shell nanoparticles
Anupama R. Prasad and
Abraham Joseph *
*
Department of Chemistry, University of Calicut, Calicut University P O, Kerala, India. E-mail: drabrahamj@gmail.com
First published on 12th April 2017
Abstract
Waterborne polyaniline (PANI) core–shell nanoparticles were synthesized via chemical oxidation of aniline in aqueous acidic medium using polyvinyl pyrrolidone (PVP) as stabilizer. The polymerization events, structure, texture, morphology and thermal degradation of the nanoparticles were investigated using UV-Visible spectroscopy, FTIR, XRD, FESEM, HRTEM and TGA techniques. Cyclic voltammetric studies were conducted to investigate the redox properties and electrochemical stability of the nanoparticles. Removal of methyl orange from aqueous solutions was investigated using the nanoparticles under different operational constraints like adsorbent dosage, pH, temperature, contact time, selectivity and ionic interference. Adsorption followed the Langmuir isotherm model. The adsorbent surface was recovered through ultra-sonication in a water–ethanol mixture.
1. Introduction
In recent years, conducting polymers have received great attention in a wide range of areas due to their ease of generation, modification, environmental stability, excellent electrochemical, optical and magnetic properties, and remarkable mechanical and thermo chemical characteristics. They are being widely used in wastewater treatment, electrochromic devices, catalysis, solar cells, nanoelectronics, metallic wires and biomedical devices.1–6 Among the conducting polymers, polyaniline (PANI) is the most investigated due to its good processability, desirable electrochemistry, attractive redox properties, ease of doping and tunable conductivity, which are beneficial for plastic batteries, optical lithography, harmonic generators, display devices, magnetic recording, solid state sensors and corrosion inhibitors.7–14 Most recently it has been successfully appropriated for the development of advanced materials including supercapacitors, lithium ion batteries, photovoltaics and thermoelectric devices.14–19 PANI has the conducting forms emeraldine and non-conducting pernigraniline. Chemical oxidation of aniline in aqueous acidic medium is the simplest, facile and inexpensive root for obtaining most conducting green emeraldine salt.7,20 Along with these attractive characteristics, PANI possesses amorphous nature, porosity, large surface area and polar polymer backbone which can accommodate or trap reactive segments.21Organic dyes are common colouring agents in textile, leather, cosmetics, paper, printing, plastic, rubber and pharmaceutical industries and their direct discharge to water sources or ecosystems create adverse effects. Major classes of industrial dyes are highly reactive and they are non-biodegradable, recalcitrant, stable oxidizing agents, thermo stable, toxic and mutagenic in nature.22–26 Persistence of dyes even in small concentrations will inhibit the solar light penetration in to water which retards the photosynthetic action, stunt the biota growth thereby impart toxicity in aquatic life and makes the water source undesirable for usage.27–32 Thus serious attention and severe struggle should be paid to remove the dye pollutants from the contaminated media before its release in to natural streams. There are some common physicochemical methods employed for dye/impurity removal from aquatic systems including photodegradation, membrane separation, irradiation, ozonisation, chemical coagulation, electrochemical coagulation and biosorption.33,34 Accounting the simplicity, cost effectiveness, selectivity and flexible operation modes adsorption is the most promising method to remove dyes, pigments or colorants from aqueous media ensuring the sustainability of biological oxygen demand.35–38 The adsorbent material has to meet some requirements such that it should be able to remove large amount of impurities in a short period with their minimum quantity.39 Nano adsorbents offers non-toxicity, large surface area, fast reactivity, ease of surface modification, simple methods of preparation and ease of modification33 such that they can perform selective removal of hazardous impurities from contaminated aquatic streams.
Adsorption of reactive dye molecules on suitable adsorbents or solid catalysts depends on the adsorbent characteristics such as specific surface structure, porosity, surface area, surface charge and intraparticle diffusion.40–45 PANI emeraldine salt exhibit selective interaction towards anionic dyes making strong chemical interactions between the positively charged polymer backbone and the anionic segment of dye molecule.11,46 Herein wefocus on synthesis of polyaniline nanoparticles through dispersion polymerization of aniline doped with phosphoric acid and polyvinylpyrrolidone (PVP) as stabilizer and its characterization and applications. The polymerization process was monitored using UV-Vis spectral characteristics, a detailed investigation on voltammetric characteristics, morphology and texture were conducted. The nanoparticles exhibited core–shell structure. Removal of methyl orange (MO) from aqueous solutions performed on the developed nanoparticles and the performance under different operational conditions including adsorbent dosage, pH, temperature, contact time, selectivity and ionic interference were studied.
2. Experimental
2.1 Materials
Aniline was obtained from Merk Pvt. ltd. India and purified before use. Polyvinylpyrrrolidone (Spectrochem Pvt. Ltd, India), ammonium persulphate (Merck Pvt. Ltd, India), phosphoric acid (Merck Pvt. Ltd, India) were used as received. The dyes methyl orange and methylene blue were obtained from Qualigens Pvt. Ltd, India and used as such.2.2 Synthesis of PVP stabilized PANI nanoparticles
4.06 g of polyvinylpyrrolidone dissolved in 60 ml of distilled water and 2 ml of aniline was added and mixed thoroughly at room temperature. The polymerizing agent ammonium per sulfate (2.04 g) mixed with 50 ml, 1 M dopant phosphoric acid introduced drop wise in to the reaction media with vigorous stirring at −5 °C in ice-salt bath in 1 hour. The reaction was further continued for 4 hours and finally green PANI emeraldine salt was obtained. The slurry was centrifuged for 20 minutes at 2000 rpm and obtained nanoparticles were continuously washed with distilled water for 8–10 times.2.3 Material characterization
The polymerization events were monitored on each 30 minutes during the course of reaction using Jasco-v-550 UV/Vis spectrophotometer. Further structural information on chemical interaction was obtained from FTIR spectra recorded on Jasco-FT/IR-4100 Spectrophotometer. The surface morphology of the material was analyzed from the micrographs obtained with a Zeiss Field Emission Scanning Electron Microscope (FESEM) and JEOL/JEM 2100 High Resolution Transmission Electron Microscope (HRTEM). Thermogravimetric analysis was conducted with Perkin Elmer STA 6000 instrument. Voltammetric characterization of PVP stabilized PANI nanoparticles immobilized on GC electrode was conducted using a Bio-Logic SP150 voltammetric work station between −0.5 to +0.5 V with an applied potential of −1 to +1 V (scan rate 50 mV s−1) and cycled 100 times in acetate buffer (pH = 4.5).2.4 Dye removal
An adsorption study of methyl orange from aqueous solutions was conducted in 50 ml glass bottles with 20 ml dye solution (32.73 mg l−1) and 2 mg of PVP stabilized PANI nanoparticles accompanied by magnetic stirring. The effect of adsorbent dosage, pH, contact time, temperature, selectivity and ionic interference were studied. A constant amount of dye solution was collected in regular time intervals and the reduction in dye concentration was recorded by using Jasco-v-550 UV/Vis spectrophotometer at λmax 460 for MO. Adsorption isotherms analyzed for Langmuir and Freundlich models. For structural and morphological alternations occurred after the adsorption process, dye loaded adsorbent samples were subjected for FTIR, XRD, FESEM and HRTEM analysis. The nanoparticles were separated from the medium after the removal process by centrifuging for 10 minutes (it also settles down if we keep the solution around 30 minutes intact). To investigate the adsorbent surface recovery desorption study was carried out. The separated adsorbent was dried and recovered through ultrasonication in 1![[thin space (1/6-em)]](https://www.rsc.org/images/entities/char_2009.gif) :
:![[thin space (1/6-em)]](https://www.rsc.org/images/entities/char_2009.gif) 1 water–ethanol mixture. The dye molecules were getting desorbed from the adsorbent surface and to monitor the recovery process and rate UV-Visible spectra was recorded after each 10 minutes.
1 water–ethanol mixture. The dye molecules were getting desorbed from the adsorbent surface and to monitor the recovery process and rate UV-Visible spectra was recorded after each 10 minutes.
3. Result and discussion
3.1 Characterization of PVP stabilized PANI nanoparticles
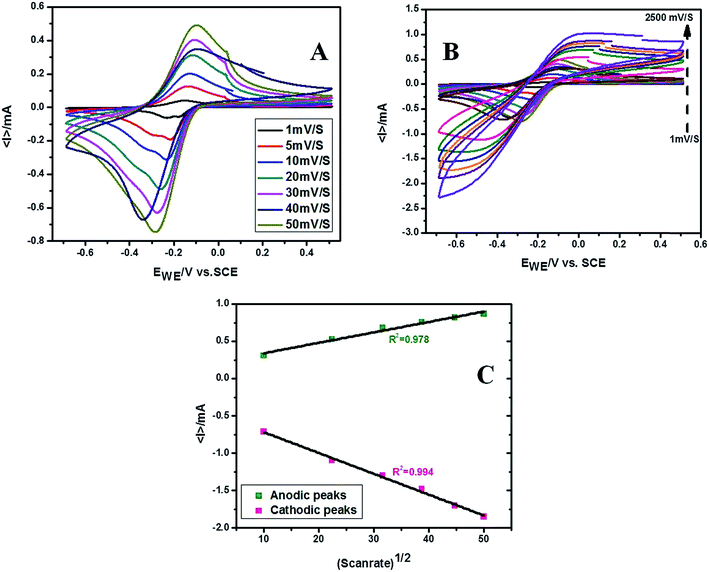
PANI has a completely reduced leucoemeraldine, partially oxidized and partially reduced emeraldine salt and completely oxidized pernigraniline as most prominent forms. We have obtained the conductive green emeraldine salt form. The cyclic voltammogram of the PVP stabilized PANI nanoparticles exhibited a pair of redox peaks in acetate buffer (pH = 4.5) attributed to the transition between emeraldine salt and pernigraniline forms due to the expulsion/insertion of protons.47–50 The voltammetric response of GC and PVP stabilized PANI modified GC has been displayed in Fig. 1 and this response was quite stable up to 100 cycles. Thus the material possesses good electrochemical stability as well as quick response on current change due to the surface redox reactions.51–53 Moreover the anodic and cathodic peak current density increases linearly with the squire root of scan rate up to 2500 mV s−1 indicating the diffusion controlled nature of electrode reaction. Fig. 2 shows the cyclic voltammograms recorded at different scan rates and variation of current density with squire root of scan rate.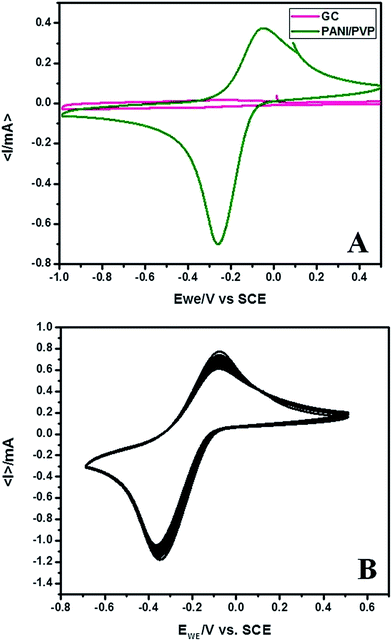 | ||
| Fig. 1 Cyclic voltammogram of (A) PVP stabilized PANI nanoparticles immobilized on GC electrode and (B) 100 cycles recorded in acetate buffer (pH = 4.5, scan rate = 50 mV s−1). | ||
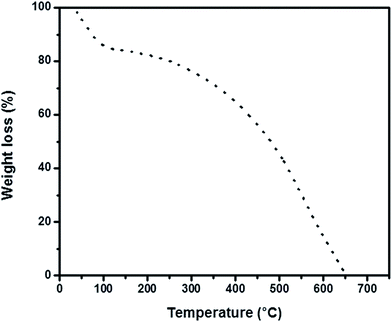
The thermogram contains three degradation steps as shown in Fig. 3. The first weight loss occurring between 40–150 °C associated with loss of water molecules. Release of inorganic dopant occurs in the next consecutive step between 150–400 °C. The degradation is complete in the third step of thermogram with the loss of PVP stabilizer and PANI backbone structure.54–56 Fig. 4 shows the UV-Vis spectrum of polymerization recorded in each 50 minutes of reaction progress. The polaron and bipolaron bands can be observed between 400–430 nm and 780–840 nm. The characteristic UV-Visible peaks associated with the π→π* transitions in benzenoid segment were less intense at the initial stages of the reaction and becomes clearly visible in the final stage of polymerization as the most intense one, consequently making a red shift in the polaron and bipolaron bands.
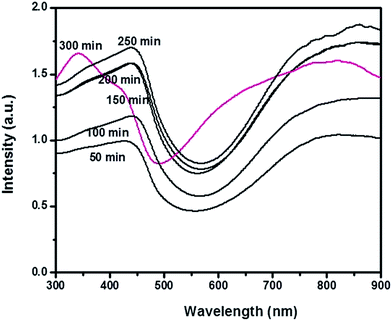 | ||
| Fig. 4 UV-Visible spectra of PANI polymerization recorded in 50 minutes interval during the progress of the reaction. | ||
3.2 Dye removal
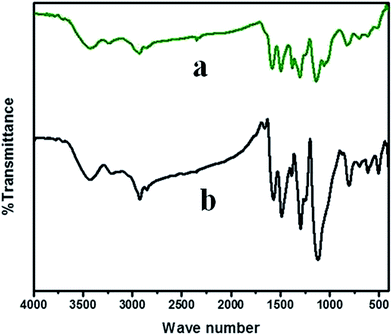
Fig. 5 represents the FTIR spectra of PVP stabilized PANI nanoparticles and MO loaded nanoparticles. The band obtained at 3430.74 cm−1, 2924.52 cm−1 corresponding to the –OH and –NH stretching vibrations respectively. The characteristic peaks observed at 1570.74 cm−1 and 1486.85 cm−1 represents the quinonoid and benzenoid ring stretching in emeraldine structure. The C![[double bond, length as m-dash]](https://www.rsc.org/images/entities/char_e001.gif) O and C–N stretching in PVP observed at 1658.48 cm−1 and 1296.89 cm−1. In addition C–N stretching vibrations were present in 1389.46 cm−1 and 1117.55 cm−1. The C–H out of plane bending vibrations has contributed the bands obtained at 803.21 cm−1 and 700.03 cm−1. MO loading has shifted the characteristic polymer back bone peaks towards higher frequencies suggesting strong chemical interaction. The bands at 1583.27 cm−1 and 1495.53 cm−1 are shifted benzenoid and quinonoid stretching vibrations. The C–N stretching frequency in MO observed at 1057.76 cm−1.
O and C–N stretching in PVP observed at 1658.48 cm−1 and 1296.89 cm−1. In addition C–N stretching vibrations were present in 1389.46 cm−1 and 1117.55 cm−1. The C–H out of plane bending vibrations has contributed the bands obtained at 803.21 cm−1 and 700.03 cm−1. MO loading has shifted the characteristic polymer back bone peaks towards higher frequencies suggesting strong chemical interaction. The bands at 1583.27 cm−1 and 1495.53 cm−1 are shifted benzenoid and quinonoid stretching vibrations. The C–N stretching frequency in MO observed at 1057.76 cm−1.
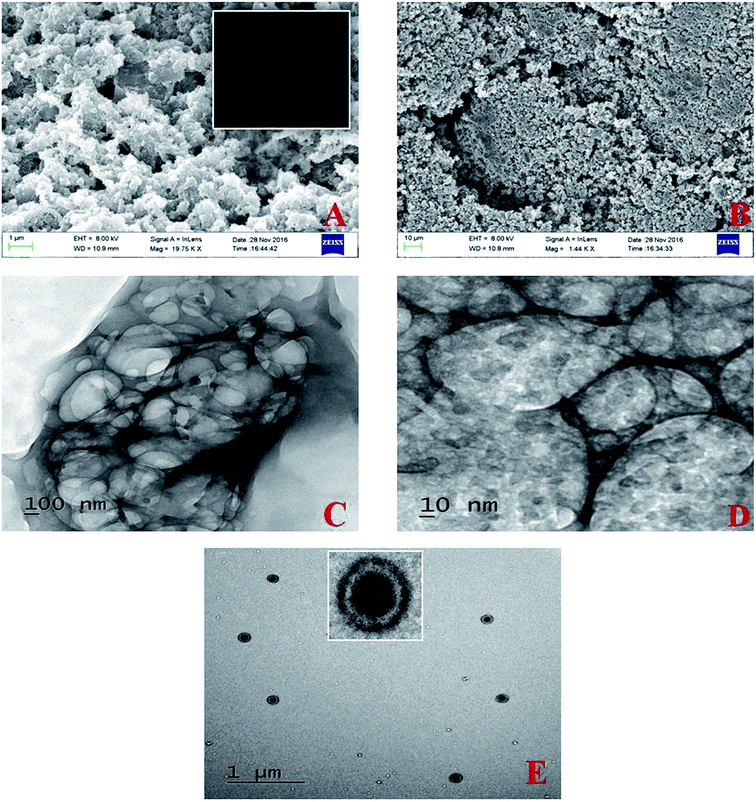
The morphology and microstructure of the bare adsorbent and dye loaded adsorbent surface was revealed from the FESEM, HRTEM micrographs shown in Fig. 6. Adsorbent surface viewed porous and becomes more populated after the dye adsorption. From the TEM micrographs in Fig. 6D the distribution of dye molecules in to the adsorbent surface can be well observed. The electronic micrograph in Fig. 6F reveals the formation of polyaniline spherical core shell nanoparticles with core dimension of ∼85–90 nm and shell thickness 20–22 nm.
3.3 Adsorption isotherm
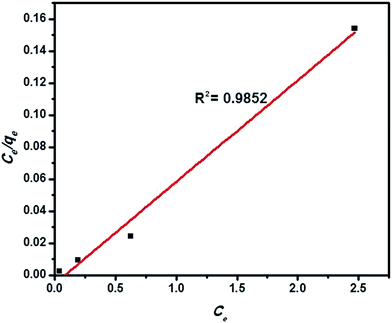
Adsorption isotherms are indeed to describe the equilibrium state of adsorption, distribution of adsorbate particles on the solid adsorbent/liquid interface and useful for designing a convenient adsorption system.40,57,58 The Langmuir model of adsorption predicts the uniform and monolayer distribution of molecules on the adsorbent surface. It also assumes the homogeneous adsorption energy distribution and absence of transmigration of adsorbate molecules along the plane of adsorbent surface. Freundlich adsorption model is an empirical equation encompassing the surface heterogeneity, exponential distribution and multilayer adsorption of adsorbate molecules. Linearized forms of Langmuir and Freundlich adsorption isotherms can be expressed as follows
 | (1) |
 | (2) |
 | (3) |
 | (4) |
3.4 Optimization of contact time and adsorbent dosage
MO dye was directly introduced in to the common tap water collected from our area to study its removal process. 20 ml of MO (32.73 mg l−1) solution taken in 50 ml glass bottles with 2–5 mg of the adsorbent dosage under initial pH 7.02 at room temperature (28 °C). At the initial dosage of 2 mg of the PANI, the dye adsorption is fast up to 25 minutes and the equilibrium contact time was fixed. The dye removal efficiency was increased to 100% up on increasing adsorbent dosage which is associated with the increase in number of available sites. The efficiency of dye removal was calculated by using the equation
 | (5) |
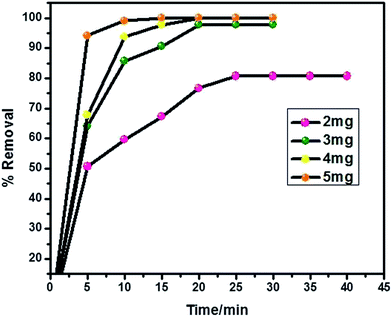 | ||
| Fig. 8 Optimization of contact time and dye removal efficiency on PVP stabilized PANI surface in different dosage amounts. | ||
3.5 Effect of temperature and pH
The study of pH effect on the dye removal process is inevitable as it can influence the structure of both adsorbent and adsorbate molecules. Also it is an important parameter influencing the solid/liquid interfacial phenomena.59 The experiment was performed by varying the solution pH between 3–9 and the results are represented in Fig. 9A. Other parameters were kept constant. It is evident that the change in pH does not influence the dye removal property between the studied ranges as the removal efficiency could meet almost 100% regardless of the pH change. This will be attributed to the existence of strong interaction of dye molecules with the adsorbent surface. Moreover the interaction is seen to be faster at lower pH because of the increased availability of protons for the emeraldine structure which will facilitate the electrostatic interaction between the anionic MO with the positively charged polymer backbone.60,61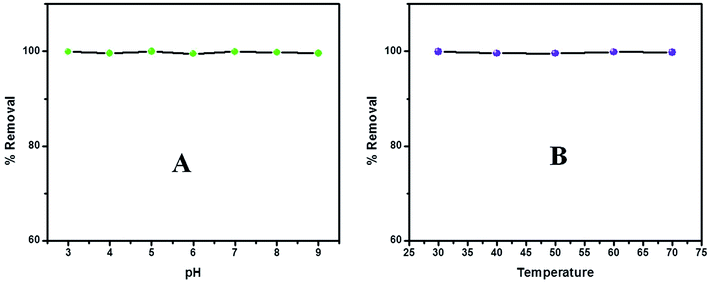 | ||
| Fig. 9 Effect of (A) pH and (B) temperature on MO adsorption on to the PVP stabilized PANI nanoparticles. | ||
Investigation on the influence of reaction temperature deserves importance and concern in scientific and practical applications. The temperature change is a reasonable constraint which can influence the adsorption process in favor or against. The experiments were conducted in 40, 50, 60 and 70 °C. The experimental data is presented in Fig. 9B and we could find that the dye removal process is complete and does not influenced by the change in temperature indicating the strong chemisorption of dye molecules on the adsorbent surface. Each set of experiments were repeated four times and the mean value for the % removal efficiency as well as the standard deviation have been listed in Table 1.
| pH | % removal efficiency | SD | Temperature (°C) | % removal efficiency | SD |
|---|---|---|---|---|---|
| 3 | 99.92 | 4.24 × 10⁻² | 30 | 99.93 | 2.91 × 10⁻² |
| 4 | 99.58 | 1.58 × 10⁻² | 40 | 99.58 | 2.54 × 10⁻² |
| 5 | 99.95 | 6.51 × 10⁻² | 50 | 99.55 | 3.08 × 10⁻² |
| 6 | 99.51 | 4.06 × 10⁻² | 60 | 99.87 | 6.55 × 10⁻² |
| 7 | 99.93 | 2.91 × 10⁻² | 70 | 99.77 | 4.52 × 10⁻² |
| 8 | 99.78 | 3.00 × 10⁻² | |||
| 9 | 99.58 | 3.31 × 10⁻² |
3.6 Selectivity and ionic interferences
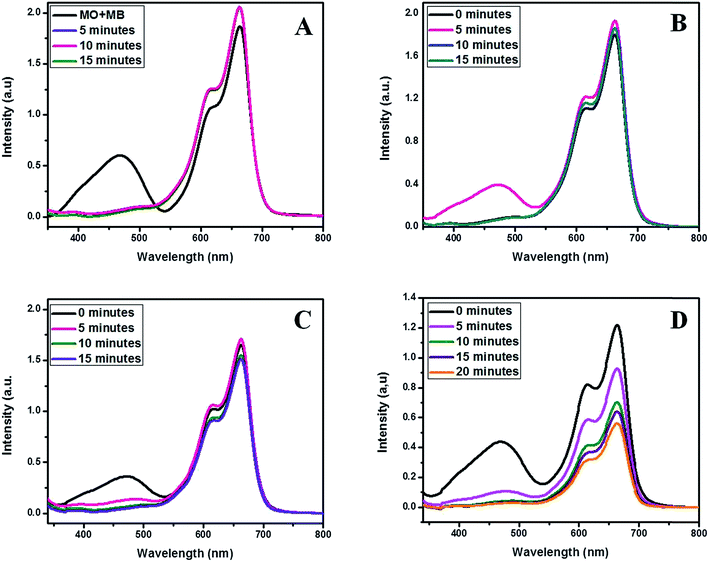
The interaction of positively charged PANI backbone and negatively charged pollutants are well established. MO is an anionic dye and its selective adsorption on to the developed PANI nanoparticles performed in an equimolar mixture of MO and Methylene Blue (MB) dyes. The adsorption of MO was found to be highly selective and unaffected by the cationic MB dye. Fig. 10A shows the UV-Vis absorption spectra displaying the selective MO adsorption.Effluents from the dye consuming industries contains various types of suspended and dissolved compounds including acids, alkalis, metal ions, anions such as carbonates, nitrates, sulphates, sulphites, halides etc. The presence of anions will create the major interference as they can interact with the positively charged polymer backbone competing with the large anionic dye molecule and retard adsorption or hinder selectivity. Thus their interference on MO adsorption was studied under optimal conditions by adding an equimolar quantity of appropriate salts in to the MO–MB mixture as prepared before. Fig. 10B displays the UV-Vis absorption spectra for the selective adsorption of MO from the MO–MB mixture in presence ofSO42− and NO3− ions. The selective adsorption was unaffected by these anions. Similar observation obtained for the halide (Cl−, Br− and I−) interference study and the UV-Vis absorption spectra is presented in Fig. 10C. The presence sulphite SO32− ions caused break up in selectivity of dye adsorption and this impact will be due to the interference interaction with the polar polymer backbone competing with the large anionic dye molecules and thereby decrease the number of available protonated sites in the backbone for adsorption. Moreover if most of the positive sites have been interacted with the interfering anion, the next possibility is to be physisorbed on the porous sites such that the selective adsorption will no more exist. This is evident from Fig. 10D describes the UV-Vis absorption spectra of equimolar MO–MB mixture in presence of SO32− ionic interference. The ionic interference data has been listed in Table 2.
| Interfering ion/ions | Amount of interfering ion/ions | % removal of MO | SD | Interference |
|---|---|---|---|---|
| SO42− | 0.14 | 99.99 | 1.22 × 10⁻² | Nil |
| NO3− | 0.10 | 99.98 | 1.58 × 10⁻² | Nil |
| SO42−, NO3− | 0.14, 0.10 | 99.99 | 7.07 × 10⁻³ | Nil |
| Cl− | 0.74 | 99.97 | 2.54 × 10⁻² | Nil |
| Br− | 1.66 | 99.99 | 1.73 × 10⁻² | Nil |
| I− | 1.19 | 99.98 | 1.00 × 10⁻² | Nil |
| Cl−, Br−, I− | 0.74, 1.66, 1.19 | 99.99 | 1.22 × 10⁻² | Nil |
| SO32− | 0.12 | 99.99 | 1.41 × 10⁻² | Loss of MO adsorption selectivity |
3.7 Desorption study
Adsorbent recovery is an important constraint in view of practical applications and it is a potential economic parameter. Industries demands economic and sustainable materials for the purpose. In order to study the possibility for adsorbent recovery desorption experiments were conducted in 1![[thin space (1/6-em)]](https://www.rsc.org/images/entities/char_2009.gif) :
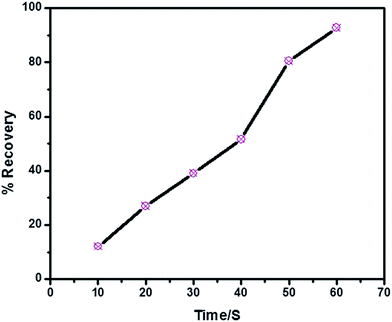
:![[thin space (1/6-em)]](https://www.rsc.org/images/entities/char_2009.gif) 1 water–ethanol mixture. Fig. 11 shows the recovery (desorption) of MO from the adsorbent surface with time when subjected to ultrasonication in water–ethanol mixture. After 60 minutes almost 92% of MO is removed from the adsorbent surface.
1 water–ethanol mixture. Fig. 11 shows the recovery (desorption) of MO from the adsorbent surface with time when subjected to ultrasonication in water–ethanol mixture. After 60 minutes almost 92% of MO is removed from the adsorbent surface.
4. Conclusions
Successfully synthesised waterborne PVP stabilized PANI nanoparticles. The nanoparticles were characterized using different techniques and investigated for their MO dye removal property in aqueous medium. The following conclusions were derived from the study:(1) The conducting emeraldine salt form of PANI was recognized, have good electrochemical stability, quick voltammetric response and undergoes a three step thermal decomposition within 150–400 °C.
(2) The developed nanoparticles could effectively remove MO dye from aqueous solution regardless of change in experimental constraints such as pH and temperature.
(3) Nanoparticles possess spherical core–shell structure with 85–90 nm core dimension and 20–22 nm shell thickness.
(4) Interaction of adsorbent with the anionic dye, MO is clearly electrostatic and thus highly selective presence of other anionic interferences such as SO42−, NO3− and halogens.
(5) SO32− could alter the selectivity of adsorption. The adsorbent surface recovered in 1![[thin space (1/6-em)]](https://www.rsc.org/images/entities/char_2009.gif) :
:![[thin space (1/6-em)]](https://www.rsc.org/images/entities/char_2009.gif) 1 water–ethanol mixture.
1 water–ethanol mixture.
References
- M. Laabd, A. El Jaouhari, M. Ait Haki, H. Eljazouli, M. Bazzaoui, H. Kabli and A. Albourine, J. Environ. Chem. Eng., 2016, 4, 1869–1879 CrossRef CAS.
- M. Ait Haki, M. Laabd, H. Chafai, H. Kabli, M. Ez-zahery, M. Bazzaoui, R. Lakhmiri and A. Albourine, J. Dispersion Sci. Technol., 2017, 38, 832–836 CrossRef.
- J. Lei, V. P. Menon and C. R. Martin, Polym. Adv. Technol., 1992, 4, 124–129 CrossRef.
- M. Lemaire, D. Delabouglise, R. Garreau, A. Gay and J. Roncal, J. Chem. Soc., Chem. Commun., 1998, 6, 695–696 Search PubMed.
- Z. Chen, Y. Takei, B. A. Deoye and T. Nagaoka, Analyst, 2000, 125, 2249–2254 RSC.
- M. Zhao, X. Wu and C. Cai, J. Phys. Chem. C, 2009, 113, 4987–4996 CAS.
- M. A. Mohamad and A. Abu El-Nasr, J. Phys. Chem. C, 2010, 114, 14377–14383 Search PubMed.
- B. Scrosati, Polym. Int., 1998, 47, 50 CrossRef CAS.
- D. Xie, Y. Jiang, W. Pan, D. Li, Z. Wu and Y. Li, Sens. Actuators, B, 2002, 81, 158 CrossRef CAS.
- R. Racicot, R. Brown and S. C. Yang, Synth. Met., 1997, 85, 1263 CrossRef CAS.
- D. Mahanta, G. Madras, S. Radhakrishnan and S. Patil, J. Phys. Chem. B, 2009, 113, 2293–2299 CrossRef CAS PubMed.
- A. G. MacDiarmid, Angew. Chem., Int. Ed., 2001, 40, 2581 CrossRef CAS PubMed.
- W. S. Huang, B. D. Humphrey and A. G. MacDiarmid, J. Chem. Soc., Faraday Trans., 1986, 82, 2385 RSC.
- A. G. MacDiarmid, Synth. Met., 1997, 84, 27 CrossRef CAS.
- K. Lee, S. Cho, S. H. Park, A. J. Heeger, C. W. Lee and S. H. Lee, Nature, 2006, 441, 65 CrossRef CAS PubMed.
- W. S. Huang and A. G. Macdiarmid, Polymer, 1993, 34, 1833 CrossRef CAS.
- Q. Yao, L. Chen, W. Zhang, S. Liufu and X. Chen, ACS Nano, 2010, 4, 2445 CrossRef CAS PubMed.
- Y. G. Wang, H. Q. Li and Y. Y. Xia, Adv. Mater., 2006, 18, 2619 CrossRef CAS.
- K. S. Ryu, K. M. Kim, S. G. Kang, G. J. Lee, J. Joo and S. H. Chang, Synth. Met., 2000, 110, 213 CrossRef CAS.
- X. Du, Y. Xu, L. Xiong, Y. Bai, J. Zhu and S. MaoJ, Appl. Polym. Sci., 2014, 131, 40827 Search PubMed.
- A. N. Chowdhury, S. R. Jesmeen and M. M. Hossain, Polym. Adv. Technol., 2004, 15, 633–638 CrossRef CAS.
- A. Maleki, A. H. Mahvi, R. Ebrahimi and Y. Zandsalimi, Korean J. Chem. Eng., 2010, 27, 1805–1810 CrossRef CAS.
- F. Gholami-Borujeni, A. H. Mahvi, S. Naseri, M. A. Faramarzi, R. Nabizadeh and M. Alimohammadi, Res. J. Chem. Environ., 2011, 15, 217–222 CAS.
- S. D. Ashrafi, S. Rezaei, H. Forootanfar, A. H. Mahvi and M. A. Faramarzi, Int. Biodeterior. Biodegrad., 2013, 85, 173–181 CrossRef CAS.
- M. Shirmardi, A. H. Mahvi, B. Hashemzadeh, A. Naeimabadi, G. Hassani and M. V. Niri, Korean J. Chem. Eng., 2013, 30, 1603–1608 CrossRef CAS.
- A. Srinivasan and T. Viraraghavan, J. Environ. Manage., 2010, 91, 1915–1929 CrossRef CAS PubMed.
- V. K. Garg, M. Amita, R. Kumar and R. Gupta, Dyes Pigm., 2004, 63, 243–250 CrossRef CAS.
- H. Sun, L. Cao and L. Lu, Nano Res., 2011, 4, 550–562 CrossRef CAS.
- K. Hunger, Industrial Dyes: Chemistry, Properties, Applications, Wiley-VCH, Weinheim, Germany, 2003 Search PubMed.
- R. M. Christie. Environmental Aspects of Textile Dyeing, Woodhead Publishing, Great Abington, Cambridge, 2007 Search PubMed.
- F. I. Hai, K. Yamamoto and K. Fukushi, Crit. Rev. Environ. Sci. Technol., 2007, 37, 315–377 CrossRef CAS.
- Q. Husain, Crit. Rev. Biotechnol., 2006, 26, 201–221 CrossRef CAS PubMed.
- A. Dalvand, R. Nabizadeh, M. RezaGanjali, M. Khoobi, S. Nazmara, A. HosseinMahvi, M. Shanehsaz, S. Seidi, Y. Ghorbani, S. Mohammad Reza Shoja and S. Rouhani, J. Magn. Magn. Mater., 2016, 404, 179–189 CrossRef CAS.
- S. Maryam, S. Shahram, G. Yousefali, M. R. S. Seyed and R. Shohre, Spectrochim. Acta, Part A, 2015, 149, 481–486 CrossRef PubMed.
- P. Cooper, Colour in Dye House Effluent, in: Society of Dyers and Colorists, Alden Press, Oxford, 1995 Search PubMed.
- Y. S. Al-Degs, M. I. El-Barghouthi, A. H. El-Sheikh and G. M. Walker, Dyes Pigm., 2008, 77, 16–23 CrossRef CAS.
- A. Srinivasan and T. Viraraghavan, J. Environ. Manage., 2010, 91, 1915–1929 CrossRef CAS PubMed.
- D. P. Z. Li, Y.-R. Zhao, X.-X. Zhao and B.-X. Zhao, Chem. Eng. J., 2013, 232, 425–433 CrossRef CAS.
- A. Asfaram, M. Ghaedi, S. Agarwal, I. TyagibVinod and K. Gupta, RSC Adv., 2015, 5, 18438 RSC.
- A.-N. M. Salem, M. A. Ahmed and M. F. El-Shahat, J. Mol. Liq., 2016, 219, 780–788 CrossRef CAS.
- K. R. Ramakrishna and T. Viraraghavan, Water Sci. Technol., 1997, 36, 189–196 CrossRef CAS.
- Y. S. Ho and G. McKay, Chem. Eng. J., 1998, 70, 115–124 CrossRef CAS.
- G. McKay, H. S. Blair and J. R. Gardner, J. Colloid Interface Sci., 1983, 95, 108–119 CrossRef CAS.
- R. S. Juang, R. L. Tseng, F. C. Wu and S. H. Lee, J. Chem. Technol. Biotechnol., 1997, 70, 391–399 CrossRef CAS.
- G. McKay, AIChE J., 1984, 30, 692–697 CrossRef CAS.
- D. Mahanta, G. Madras, S. Radhakrishnan and S. Patil, J. Phys. Chem. B, 2008, 112, 10153–10157 CrossRef CAS PubMed.
- E. Smela, W. Lu and B. R. Mattes, Synth. Met., 2005, 151, 25–42 CrossRef CAS.
- S. Quillard, G. Louarn, S. Lefrant and A. Macdiarmid, Phys. Rev. B: Condens. Matter Mater. Phys., 1994, 50, 12496–12508 CrossRef.
- W. Huang and A. Macdiarmid, Polymer, 1993, 34, 1833–1845 CrossRef CAS.
- J. E. Albuquerque, L. H. C. Mattoso, D. T. Balogh, R. M. Faria, J. G. Masters and A. G. Mac-Diarmid, Synth. Met., 2000, 113, 19–22 CrossRef CAS.
- W. Wu, D. Pan, Y. Li, G. Zhao, L. Jing and S. Chen, Electrochim. Acta, 2015, 151, 126–134 CrossRef.
- D.-W. Wang, F. Li, J. Zhao, W. Ren, Z.-G. Chen, J. Tan, Z.-S. Wu, I. Gentle, G. Q. Lu and H. M. Cheng, ACS Nano, 2009, 3, 1745 CrossRef CAS PubMed.
- Y. Li, X. Zhao, Q. Xu, Q. Zhang and D. Chen, Langmuir, 2011, 27, 6458 CrossRef CAS PubMed.
- F. X. Perrin, T. A. Phan and D. L. Nguyen, J. Polym. Sci., Part A: Polym. Chem., 2015, 53, 1606–1616 CrossRef CAS.
- S. Bhadra, N. K. Singha, S. Chattopadhyay and D. Khastgir, J. Polym. Sci., Part B: Polym. Phys., 2007, 45, 2046–2059 CrossRef CAS.
- B. Sreedhar, M. Sairam, D. K. Chattopadhyay, P. P. Mitra, D. V. M. Rao and J. Appl, Polym. Sci., 2006, 101, 499–508 CAS.
- J. R. Utrilla, I. B. Toledo, M. A. F. Garcy and C. Moreno, J. Chem. Technol. Biotechnol., 2001, 76, 1209–1215 CrossRef.
- H. Chafai, M. Laabd, S. Elbariji, M. Bazzaoui and A. Albourine, J. Dispersion Sci. Technol., 2017, 38, 598–603 CrossRef.
- L. Tian, J. Zhang, H. Shi, N. Li and Q. Ping, J. Dispersion Sci. Technol., 2016, 37, 1059–1066 CrossRef CAS.
- H. Yoshida, A. Okamoto and T. Kataoka, Chem. Eng. Sci., 1993, 48, 2267–2272 CrossRef CAS.
- M. N. V. R. Kumar, React. Funct. Polym., 2000, 46, 1–27 CrossRef CAS.
| This journal is © The Royal Society of Chemistry 2017 |

