 Open Access Article
Simultaneous bacterial inactivation and degradation of an emerging pollutant under visible light by ZnFe2O4 co-modified with Ag and rGO†
Nirina Khadgi,
Akhanda Raj Upreti and
Yi Li*
Key Laboratory of Integrated Regulation and Resource Development on ShallowLakes, Ministry of Education, College of Environment, Hohai University, Nanjing, 210098, PR China. E-mail: envly@hhu.edu.cn; nirina@hhu.edu.cn
First published on 22nd May 2017
Abstract
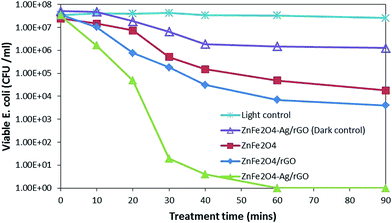
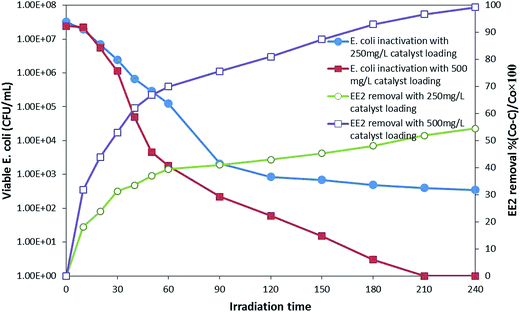
Herein, we investigated the simultaneous photoinactivation of E. coli and degradation of an endocrine disrupting compound, 17α-ethinyl estradiol (EE2), by the ZnFe2O4–Ag/rGO nanocomposite. In a pure bacterial suspension, inactivation of log![[thin space (1/6-em)]](https://www.rsc.org/images/entities/char_2009.gif) 7.2 was achieved in 60 min with 250 mg L−1 loading of ZnFe2O4–Ag/rGO; however, when EE2 was present in the suspension, complete inactivation of the bacteria was achieved only after 210 min of treatment with a 500 mg L−1 loading of ZnFe2O4–Ag/rGO. Results obtained from the bacterial membrane injury test, SEM, FTIR, and antioxidant enzyme activities indicated that resilience of E. coli decreased against the oxidative stress induced by the photocatalyst, outstripping the bacterial defense mechanism and subsequently decomposing the constituent macromolecules, ultimately causing bacterial inactivation. Scavenging experiment for different active species indicated that H2O2 played the most important role for bacterial inactivation and OH˙ played the most important role for EE2 degradation, showing that the roles of the active species were dissimilar for microbial inactivation and organic pollutant degradation. Bacterial inactivation was significantly affected by the presence of EE2. Thus, the antibacterial study of the photocatalysts in this system needs to be carried out with more specificity.
7.2 was achieved in 60 min with 250 mg L−1 loading of ZnFe2O4–Ag/rGO; however, when EE2 was present in the suspension, complete inactivation of the bacteria was achieved only after 210 min of treatment with a 500 mg L−1 loading of ZnFe2O4–Ag/rGO. Results obtained from the bacterial membrane injury test, SEM, FTIR, and antioxidant enzyme activities indicated that resilience of E. coli decreased against the oxidative stress induced by the photocatalyst, outstripping the bacterial defense mechanism and subsequently decomposing the constituent macromolecules, ultimately causing bacterial inactivation. Scavenging experiment for different active species indicated that H2O2 played the most important role for bacterial inactivation and OH˙ played the most important role for EE2 degradation, showing that the roles of the active species were dissimilar for microbial inactivation and organic pollutant degradation. Bacterial inactivation was significantly affected by the presence of EE2. Thus, the antibacterial study of the photocatalysts in this system needs to be carried out with more specificity.
Introduction
Globally, 2 billion people drink water from contaminated sources, causing half a million deaths due to water-borne diseases each year.1 Providing safe drinking water via efficient water disinfection processes is important to improve public health. Along with pathogens, different pollutants that are not degraded via conventional treatments remain undetected in water. These recalcitrant pollutants are termed emerging pollutants due to not only their increasing occurrence and awareness related to ecological consequences but also lack of guidelines for them.2,3 The occurrence of emerging pollutants is expected to increase with our changing lifestyle. Their continual administration although in low concentration can cause different adverse effects, such as endocrine disruption that causes reproductive and sexual abnormalities, to aquatic and terrestrial ecosystems including humans.4Water disinfection is mainly achieved via processes such as chlorination or ozonation in water treatment plants. The main concern regarding these processes is the formation of potentially carcinogenic disinfection by-products.5–7 In developing countries where water treatment facilities are not well developed, solar disinfection (SODIS) is also a popular method for disinfecting water in the home.8 However, long irradiation time required for the SODIS acts as a bottleneck for the process during times of increased demand.9
Photocatalysis has been found to be effective for the degradation of hazardous compounds as well as disinfection of bacteria and viruses in the presence of light.10 To date, TiO2 is the most preferred photocatalyst due to its stability and low-cost; however, the band gap of >3.2 eV limits its activity in the UV region, comprising only 4% of the solar spectrum.11 Recovery of the catalysts is another issue concerning the safety of the ecosystem and reuse of the catalysts.12,13 Therefore, development of visible light active and easily separable magnetic photocatalysts is in its full pace to prevent environmental contamination, maximize the efficiency, and ensure the sustainability of photocatalysis.14
Water treatment deals with different types of pollutants, such as organic, inorganic, and biological pollutants, and their simultaneous interactions. However, most of the studies reported for the photocatalytic treatment of water deal with the treatment of one or similar pollutants at a time.10,15 Tahir et al., 2016, investigated the photodegradation and inactivation of methylene blue and bacteria.16 Similarly, Ng et al., 2016, studied the bactericidal ability of magnetic photocatalysts for Gram-negative (E. coli) and Gram-positive (S. aureus) bacteria.17 Both these studies were carried out in a single component system. There are relatively few studies that deal with the simultaneous processing of different pollutant types and their detailed investigation. Pablos et al., 2012, investigated inactivation of E. coli and pharmaceutical oxidation with TiO2 under UV irradiation. Philippe et al., 2016, studied photocatalytic disinfection in the presence of an emerging contaminant using an innovative solar simulator with respect to osmotic and mechanical stress.18 Pablos et al., 2012, investigated the inactivation of E. coli and pharmaceutical oxidation with TiO2 under UV irradiation.19
In our previous study, we synthesized a ZnFe2O4–Ag/rGO nanocomposite (NC) using a facile template or surfactant-free method,20 and the photocatalytic activity of the NC was assessed by the degradation of 17α-ethinyl estradiol (EE2), an endocrine disrupting compound (EDC), as the model of an emerging pollutant in the presence of humic acid. Zinc ferrite (ZnFe2O4) is a visible-light active magnetic spinel ferrite semiconductor with a band gap of ∼1.9 eV. However, it suffers from the limitations of low photoelectric efficiency and rapid charge recombination.21 Addition of Ag nanoparticles (NPs) and rGO to bare ZnFe2O4 had a synergistic effect, leading to the decreased aggregation of the NPs, increased surface area, better absorption in the visible region, and effective electron–hole generation transfer, resulting in better photocatalytic activity.20
In this study, we simultaneously investigated the ZnFe2O4–Ag/rGO NC for its bactericidal effect and degradation of an emerging pollutant in a single system and attempted to differentiate the antibacterial activities exhibited by the ZnFe2O4–Ag/rGO nanocomposite in the presence of EE2. Moreover, bacterial cell injury, morphology distortion, and changes in cell substances during the treatment and enzymatic assay were carried out to gain insights into the bacterial inactivation mechanism, and different scavenging experiments were carried out to determine the roles played by the active species in both the inactivation and degradation processes.
Experimental
Synthesis of the ZnFe2O4–Ag–rGO nanocomposite
First graphite oxide (GO) suspension was prepared by mixing 20 mg GO powder previously, prepared by Hummers and Offeman method62 in 60 mL ethanol under sonication for 1 h. Then, another 20 mL of ethanol was added to achieve 1 mM concentration. Zn(NO3)2·6H2O, 2 mM Fe(NO3)3·9H2O, and 0.05 mM AgNO3 were added under magnetic stirring for 30 min. The obtained reddish brown solution was added into the GO suspension and stirred for another 2 h. Then, the mixture was poured into a Teflon-lined stainless steel autoclave and reacted at 180 °C for 12 h. After being cooled, ZnFe2O4–Ag/rGO nanocomposite was washed several times with distilled water and dried in an oven at 60 °C for 12 h.Characterization
Scanning electron microscopy (SEM, Hitachi S-4800), diffuse reflectance spectroscopy (JASCO V-670), energy-dispersion X-ray analysis (EDAX PV 9100), and X-ray photoelectron spectroscopy (XPS) were performed using ESCA PHI 5000C. X-ray diffraction analysis (Bruker AXS, Germany) and photoluminescence (PL) spectroscopy (Hitachi F-7000) were conducted to analyze the synthesized nanocomposites.Photocatalytic procedure
E. coli and EE2 were chosen as the model for a water-borne bacteria and an emerging pollutant with endocrine disrupting properties, respectively. E. coli, freshly grown in Luria Bertani (LB) broth (10 g tryptone, 5 g yeast extract, and 10 g NaCl per litre) and incubated overnight at 37 °C under aerobic conditions with constant shaking was used for the photocatalytic inactivation experiments. Before each experiment, a 10![[thin space (1/6-em)]](https://www.rsc.org/images/entities/char_2009.gif) 000-fold dilution of the bacterial stock solution was carried out using a 0.9% NaCl solution. The initial bacterial population was in the range between 107 and 108 CFU mL−1. The suspension was stirred in the dark for 1 hour to attain the equilibrium. For simultaneous photocatalytic degradation and bacterial inactivation, the bacterial suspension was added to the previously prepared EE2 solution (2 mg L−1) under continual stirring to prevent its recrystallization. The photocatalyst was dispersed in the suspension under continuous stirring. The solution was irradiated by a 300 W Xe lamp, and a cut-off filter was used to cut the radiation to <400 nm. The samples were withdrawn for enumeration of bacteria and measurement of the EE2 concentration at different time intervals. The concentration of EE2 was determined by high-performance liquid chromatography (HPLC) measurement using an Agilent 1260 series fluorescence detector at an excitation wavelength of 280 nm and an emission wavelength of 310 nm, as mentioned elsewhere.22 The minimum detection limits (MDL) were 0.01 mg L−1 as inferred by the lowest standard solution detected.
000-fold dilution of the bacterial stock solution was carried out using a 0.9% NaCl solution. The initial bacterial population was in the range between 107 and 108 CFU mL−1. The suspension was stirred in the dark for 1 hour to attain the equilibrium. For simultaneous photocatalytic degradation and bacterial inactivation, the bacterial suspension was added to the previously prepared EE2 solution (2 mg L−1) under continual stirring to prevent its recrystallization. The photocatalyst was dispersed in the suspension under continuous stirring. The solution was irradiated by a 300 W Xe lamp, and a cut-off filter was used to cut the radiation to <400 nm. The samples were withdrawn for enumeration of bacteria and measurement of the EE2 concentration at different time intervals. The concentration of EE2 was determined by high-performance liquid chromatography (HPLC) measurement using an Agilent 1260 series fluorescence detector at an excitation wavelength of 280 nm and an emission wavelength of 310 nm, as mentioned elsewhere.22 The minimum detection limits (MDL) were 0.01 mg L−1 as inferred by the lowest standard solution detected.
The bacterial viability was performed by the plate counting method. Samples were withdrawn at different times of the experiment, and after appropriate dilution, 100 μL of the sample was used to plate onto the LB agar plate and was incubated for 18 h at 37 °C. Herein, three replicate plates were used at each sampling time.
Determination of the damages to bacterial permeability
Injury caused by damage to the outer membrane was identified via comparing bacterial cultivability using a non-selective LB medium and selective LB medium supplemented by 10 g L−1 Na-cholate as reported by Dunlop et al. (2015).23 Samples were withdrawn at different treatment times, spread onto both media after appropriate dilutions, and then incubated at 37 °C for 24 h before bacterial counting. The injury was calculated as follows:| Injury (%) = ((total − non-injured)/total) × 100 |
Scanning electron microscopy (SEM) and Fourier transform infrared (FTIR) spectroscopy analyses of the bacterial sample
The bacterial samples were harvested by centrifuging at different times of the experiment. Then, the bacteria were fixed with 2.5% glutaraldehyde solution for 2 hours and washed with DI water. Samples were then dehydrated with the increasing concentrations of an ethanol solution (30, 50, 70, 80, 90, and 100%) and dried overnight at 35 °C. For FTIR, bacterial samples before and after the treatment were harvested via centrifugation and dried at 30 °C for 24 h. The FTIR analysis was performed using KBr discs and finely ground bacterial samples and KBr in the ratio of 1![[thin space (1/6-em)]](https://www.rsc.org/images/entities/char_2009.gif) :
:![[thin space (1/6-em)]](https://www.rsc.org/images/entities/char_2009.gif) 50, analyzed using a Varian 300 FTIR in the wavenumber region of 4000–400 cm−1 at 2 cm−1 spectral resolution.
50, analyzed using a Varian 300 FTIR in the wavenumber region of 4000–400 cm−1 at 2 cm−1 spectral resolution.
Intracellular enzymatic assay
The bacterial density of 109 was used for the enzyme assay. Herein, four mL of the sample was withdrawn and centrifuged at 10![[thin space (1/6-em)]](https://www.rsc.org/images/entities/char_2009.gif) 000 rpm for 5 min. The cells were re-suspended in 2 mL phosphate-buffered saline (PBS) solution and sonicated for 1 min at 40 kHz frequency at 4 °C and again centrifuged at 10
000 rpm for 5 min. The cells were re-suspended in 2 mL phosphate-buffered saline (PBS) solution and sonicated for 1 min at 40 kHz frequency at 4 °C and again centrifuged at 10![[thin space (1/6-em)]](https://www.rsc.org/images/entities/char_2009.gif) 000 rpm for 5 min. Supernatant was obtained for the measurement of protein, superoxide dismutase (SOD), and catalase (CAT). The enzyme activity was calculated as per mg of protein.
000 rpm for 5 min. Supernatant was obtained for the measurement of protein, superoxide dismutase (SOD), and catalase (CAT). The enzyme activity was calculated as per mg of protein.
Protein concentration in the cell extracts was determined using the Bradford Coomassie-binding colorimetric method.24,25 Protein concentrations were estimated by measuring the absorbance at 595 nm, obtained for a series of standard protein dilutions using bovine serum albumin (BSA). SOD activity was measured via the water soluble nitroblue tetrazolium method using an SOD WST-1 (A001-3) assay kit, and the CAT activity was determined via a visible-light method using a Catalase assay kit (A007-1) obtained from Nanjing Jiancheng Technology Co. Ltd.
Active species analysis
To elucidate the role of the active species in the photocatalytic mechanism, a series of experiments was conducted using different scavengers to remove their corresponding active species and analyze their contribution in the E. coli inactivation and EE2 degradation. Isopropanol (0.5 mmol L−1), potassium dichromate (0.05 mmol L−1), EDTA (0.1 mmol L−1), ascorbic acid (0.5 mmol L−1), and catalase (3000 U mL−1) were used for scavenging OH˙, electron (e−), hole (h+), O2˙−, and H2O2, respectively. The concentrations were based on the preliminary experimental data to maximize the scavenging effect and minimize the bactericidal effect.Terephthalic acid probe method, nitroblue tetrazolium assay, and titanium(IV) oxysulfate (modified method DIN38402H15) method were used to identify the generation of OH˙, O2˙−, and H2O2, respectively, and understand the photocatalytic mechanism.
Results and discussion
Characterizations
Scanning electron microscopy images of different nanocomposites (NC) are illustrated in Fig. 1 for comparison. ZnFe2O4 nanoparticles (NP) are highly aggregated and form clusters ranging from 50 to 100 nm, as seen in Fig. 1(a). However, aggregation was greatly reduced in the presence of graphene sheets in ZnFe2O4/rGO and ZnFe2O4–Ag/rGO NCs,26 as seen in Fig. 1(b) and (c), respectively. The EDAX measurement also confirms the presence of Zn, Fe, O, C, and Ag elements (Fig. 1(d)).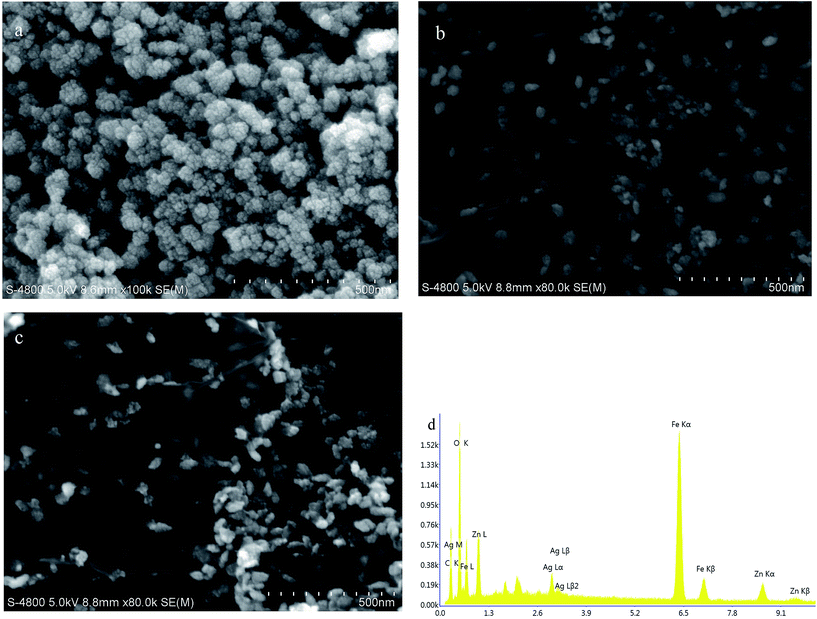 | ||
| Fig. 1 SEM images of (a) ZnFe2O4, (b) ZnFe2O4/rGO, (c) ZnFe2O4–Ag/rGO, and (d) EDAX of ZnFe2O4–Ag/rGO. | ||
X-ray diffraction spectra of GO, rGO, ZnFe2O4, ZnFe2O4/rGO, and ZnFe2O4–Ag/rGO are shown in Fig. S1.† The characteristic (001) peak at 10.5°, as shown in Fig. S1(a),† represents highly oxidized and interconnecting GO layers as the result of the oxidation process. The disappearance of the (001) peak, as shown in Fig. S1(a),† and appearance of a broad peak (002) at ∼24°, as seen in Fig. S1(b),† suggest distorted stacking of graphene sheets due to the removal of oxygen-containing functional groups during the hydrothermal reduction of GO. However, the presence of ZnFe2O4 and Ag NPs prevents the aggregation of the graphene sheets, as seen in the SEM and TEM images;27 Fig. S1(b)† suggests the exfoliation and reduction of GO during the hydrothermal reaction.28 The main peaks observed at 30°, 35.5°, 43°, 53.5°, 56.7°, and 62.4°, as shown in Fig. S1(c)–(e),† correspond to the crystal planes of the cubic spinel ZnFe2O4 (JCPDS no. 77-0011), and peaks at 38.1°, 44.2°, 64.4°, and 77.4°, as shown in Fig. S1(e),† correspond to the face-centered cubic (FCC) structure of Ag (JCPDS card no. 07-0783).29,30
To study the oxidation state of the elements of ZnFe2O4–Ag/rGO, XPS was performed. Fig. S2† shows the high resolution XPS of Zn 2p, Fe 2p, O 3d, and Ag 3d present in the ZnFe2O4–Ag/rGO nanocomposite. In Fig. S2(a),† the binding energies of Zn 2p1/2 and Zn 2p3/2 appearing at 1044.9 and 1022.2 eV can be attributed to the +2 oxidation state of Zn.29 The two distinct peaks at 725.3 and 711.5 eV correspond to Fe 2p1/2 and Fe 2p3/2, respectively, and a satellite peak at 719.4 eV in Fig. S2(b)† is characteristic of Fe with a +3 oxidation state.31 The Ag 3d5/2 and Ag 3d3/2 peaks at 368.1 and 374.1 eV binding energies indicate the presence of zero-valent Ag, as seen in Fig. S2(c).†32 The deconvoluted peaks of C 1s at the binding energies of 284.6, 285.5, 287.3, and 288.7 eV, as shown in Fig. S2(d),† are related to C![[double bond, length as m-dash]](https://www.rsc.org/images/entities/char_e001.gif) C–C, C–OH, C–O–C, and C
C–C, C–OH, C–O–C, and C![[double bond, length as m-dash]](https://www.rsc.org/images/entities/char_e001.gif) O, respectively.31 The higher intensity of the sp2 hybridized C
O, respectively.31 The higher intensity of the sp2 hybridized C![[double bond, length as m-dash]](https://www.rsc.org/images/entities/char_e001.gif) C–C atoms compared to that of the oxygenated functional groups indicates the reduction of GO during the formation of the ZnFe2O4–Ag/rGO nanocomposite,33 which is in agreement with the XRD measurement results.
C–C atoms compared to that of the oxygenated functional groups indicates the reduction of GO during the formation of the ZnFe2O4–Ag/rGO nanocomposite,33 which is in agreement with the XRD measurement results.
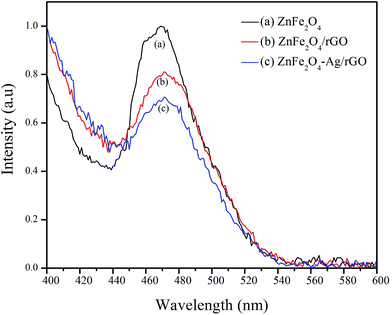
The UV-visible diffuse reflectance spectra for ZnFe2O4, ZnFe2O4/rGO, and ZnFe2O4–Ag/rGO were obtained to analyze their optical behavior (Fig. S3†). As shown in Fig. S3(a),† ZnFe2O4 shows absorption in the visible light due to its narrow band gap.34 However, with the successive addition of GO and Ag, the absorption greatly strengthens in the visible region due to the introduction of a continuous absorption band from GO35 and surface plasmon resonance (SPR) of the Ag nanoparticle,36 as shown in Fig. S3(c) and (d).† The characteristic absorption spectrum of Ag around 410 nm in the case of ZnFe2O4–Ag/rGO is not prominent due to low concentration of Ag (0.05 mM).29 The photoluminescence (PL) spectra of ZnFe2O4, ZnFe2O4/rGO, and ZnFe2O4–Ag/rGO NCs are shown in Fig. 2. The emission peak observed around 460–490 nm in the PL spectra of ZnFe2O4 is attributed to the recombination of a photogenerated electron–hole pair. The decrease in the intensity of the peak in the case of ZnFe2O4/rGO and ZnFe2O4–Ag/rGO NCs is due to the suppression of the electron–hole recombination due to the presence of rGO and Ag NPs. Graphene sheets have excellent electronic conductivity, and Ag NPs act as the electron sink, leading to an effective separation of the electron–hole pair, which helps to prolong their lifetime and increase the photocatalytic efficiency.35,37
Photocatalytic performance
![[thin space (1/6-em)]](https://www.rsc.org/images/entities/char_2009.gif) log reduction was achieved after 210 min, and EE2 was degraded below the detection limit in 240 min. While the EE2 degradation was not much affected by the presence of bacterial population, bacterial inactivation was greatly affected by the presence of EE2 in the suspension. The possible reason for this might be the competition for photons and ROS between EE2 and E. coli19 rather than that for active sites as a direct contact is not a prerequisite for bacterial inactivation.44 Moreover, E. coli is repelled by the negatively charged GO.45 Therefore, serious consideration has to be given while treating the water sample with different types of pollutants since optimal loading and treatment time may vary from one system to another, where low loading can cause insufficient generation of ROS, at the same time, more loading can shield the photons.
log reduction was achieved after 210 min, and EE2 was degraded below the detection limit in 240 min. While the EE2 degradation was not much affected by the presence of bacterial population, bacterial inactivation was greatly affected by the presence of EE2 in the suspension. The possible reason for this might be the competition for photons and ROS between EE2 and E. coli19 rather than that for active sites as a direct contact is not a prerequisite for bacterial inactivation.44 Moreover, E. coli is repelled by the negatively charged GO.45 Therefore, serious consideration has to be given while treating the water sample with different types of pollutants since optimal loading and treatment time may vary from one system to another, where low loading can cause insufficient generation of ROS, at the same time, more loading can shield the photons.
Changes in the bacterial cells after the photocatalytic treatment
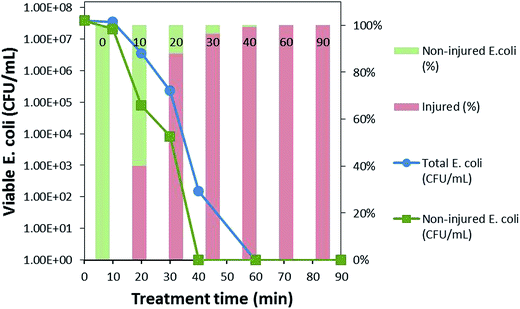
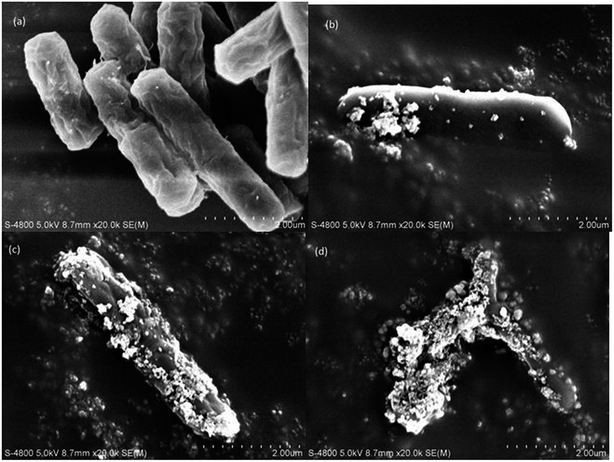
As can be seen in Fig. 5, at 0 min, the total population of bacteria was without any injury; however, after only 10 min of the photocatalytic treatment, bacterial injury increased to 40% and then to 88% and 96% after 20 and 30 min of the photocatalytic treatment, respectively, in sodium cholate-supplemented LB medium, whereas the bacteria completely lost its cultivability in 40 min, indicating that almost all bacterial permeability was compromised by this time. The slow decline in the total bacterial population compared to that of the non-injured population confirms the recovery of the fraction of the bacterial population that was unable to grow in the selective medium.23 Hence, the zone between the total bacteria and non-injured bacteria can be said to represent recoverable, sub-lethally injured bacteria at a particular treatment time. With the increasing treatment time, the recovery of bacteria was reduced, which might be due to intensification of the injuries from sub-lethal to lethal, eventually leading to bacterial inactivation in 60 min.
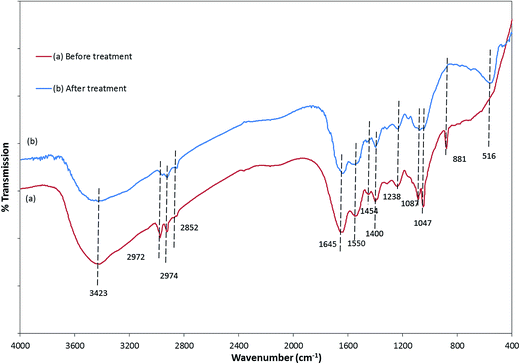
The FTIR spectra of E. coli, before and after photocatalytic treatment, were considerably different (Fig. 7). There was a decrease in the peak intensity and slight shift towards the higher wavenumber in the region between 3700 and 3500 cm−1, which could be assigned to the free –OH group.49–51 Significant disorder was observed in the 3000–2800 cm−1 region, demonstrating that fatty acids of various membrane components were reduced and transformed.50 The peaks at 1645 and 1550 cm−1 due to the presence of amide I and amide II bands of proteins and peptides shifted to the lower wavenumbers 1640 and 1548 cm−1, respectively, indicating changes in the protein structures after the treatment. A significant change observed in the 1450–1200 cm−1 region also corresponded to the change in protein and fatty acid. The decrease in the intensity of the peaks at 1238 and 1087 cm−1 after the treatment specifies the destruction of the bacterial membrane phospholipid.48 Disappearance of the 881 cm−1 peak signifies breakdown of the glycoside linkages of polysaccharide molecules of the cell membrane.49,50
The changes in the intensities and position of the peaks in the FTIR spectra clearly revealed that the photocatalytic treatment with ZnFe2O4–Ag/rGO affected the cellular substances containing different macromolecules, leading to the loss of viability and inactivation under visible light irradiation. Bacterial injury, SEM, and FTIR results correspond to each other, signifying that the bacterial inactivation that started from sub-lethal injury gradually turned into lethal, decomposing different components of E. coli, leading to its inactivation.
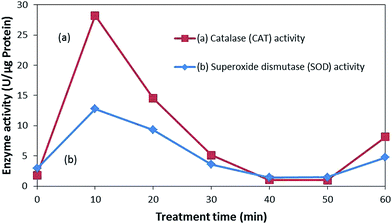
As seen in Fig. 8, the enzyme activity of both SOD and CAT abruptly increased after the treatment in response to the suppression of the oxidative stress induced via the photocatalytic treatments. Higher activities of these enzymes indicate more oxidative stress experienced by E. coli from the ROS attack. However, with the prolonged exposure to ROS attack, the defense mechanism gets exhausted and enzymatic activity declines, accelerating the accumulation of the ROSs.52 ROS attack can lead to protein fragmentation, release of ions, and generation of protein carbonyl derivatives, which leads to inactivation.47,52 Therefore, bacterial inactivation can be said to be caused by the elevated intracellular ROS levels, overwhelming the bacterial defense mechanism, disintegrating the bacterial membrane, and eventually leading to inactivation.
Role of different active species in the photocatalytic treatment
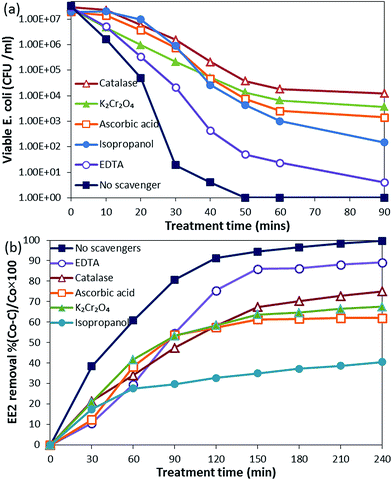
Identification of the main active species in the photocatalytic reaction is of great importance for understanding the photocatalytic mechanism of the synthesized NCs. The contribution of different active species was analyzed using their scavengers for E. coli inactivation and EE2 degradation.Active species scavenging experiments clearly show the difference in the roles played by the active species in bacterial inactivation and EE2 degradation. H2O2 had the major role in E. coli inactivation, whereas in EE2 degradation, OH˙ was important.
Photocatalytic inactivation of Staphylococcus haemolyticus
The inactivation of Staphylococcus haemolyticus, as the model of Gram-positive bacteria, was also performed to determine its efficacy on Gram-positive bacteria. The SEM image of S. haemolyticus during various treatment times and the inactivation curve are shown in Fig. S7.† The complete inactivation of S. haemolyticus was achieved within 90 minutes of visible light irradiation (Fig. S7(d)†). The presence of a cell wall with a thick peptidoglycan layer contributed to longer inactivation time compared to that in Gram-negative E. coli.55 However, the composite was able to effectively inactivate the Gram-positive and Gram-negative bacteria. Regardless of the different structure of the bacteria, the inactivation mechanism was similar.56Photocatalytic mechanism
A plausible reaction mechanism for the high photocatalytic activity of ZnFe2O4–Ag/rGO was proposed based on the generation of OH˙, O2˙−, and H2O2. The formation of O2˙−, OH˙, and H2O2 was also confirmed by terephthalic acid, NBT, and titanium oxysulphate tests, respectively [Fig. S8–S10†]. ZnFe2O4 having the band gap of 1.9 eV can be excited by visible light to produce an electron–hole pair57 (eqn (1)). The electrons in the valence band (VB) move to the conduction band (CB) after the absorption of light. Moreover, Ag NPs were also excited by visible light due to the surface plasmon resonance, generating electrons58,59 (eqn (2)). The electrons from ZnFe2O4 and Ag were transferred to rGO due to their well-matched band potential.54 The photogenerated electron (e−) in the conduction band (CB) of ZnFe2O4 (ECB = −1.54 V vs. NHE)57 was readily scavenged by the dissolved oxygen to form superoxide anion O2˙− (E0 = −0.33 V vs. NHE) (eqn (1)).60 Further disproportionation reactions of superoxide anions can lead to the formation of H2O2 and OH˙ (eqn (4)–(7)).| ZnFe2O4 + hν → ZnFe2O4 (e− + h+) | (1) |
| Ag + hν → Ag (e−) | (2) |
| ZnFe2O4 (e−) → Ag (e−) → rGO (e−) | (3) |
| O2 +e− → O2˙− | (4) |
| O2˙− + O2˙− + 2H+ → H2O2 + O2 | (5) |
| H2O2 + e− → OH˙ + OH− | (6) |
| H2O2 + O2˙− → OH˙ + OH− + O2 | (7) |
The ROS generation possibly follows the reductive mechanism involving dissolved oxygen and photogenerated electrons rather than oxidation by photogenerated holes as they do not possess suitable reduction potential to generate a OH˙ radical.61 The valence band of ZnFe2O4 (EVB = 0.38 V vs. NHE)57 is more negative than the water reduction potential to directly oxidize OH− (E = 1.99 eV) or H2O (E = 2.8 V vs. NHE) to OH˙. However, the photogenerated holes h+ can directly be involved in the oxidation of EE2 and bacterial inactivation.53 This corresponds with the active species scavenging mechanism experiments. Despite the low oxidation potential of ZnFe2O4, the efficient electron transfer from ZnFe2O4 to rGO and Ag NPs in the composite prolongs their lifetime, suppresses the unfavorable recombination, and enhances the photocatalytic activity of the ZnFe2O4–Ag/rGO nanocomposite.
Conclusions
The present study demonstrated that ZnFe2O4–Ag/rGO exhibited efficient photocatalytic performance during E. coli inactivation and EE2 degradation. A reductive mechanism initiated by the photogenerated electrons was proposed for ROS generation owing to the low oxidation potential of ZnFe2O4. The results obtained from the simultaneous photocatalytic process indicated that both the optical loading and treatment time increased for bacterial inactivation in the presence of EE2. Further, the main ROS for bacterial inactivation was H2O2, whereas OH˙ played the major role for EE2 degradation. Hence, the study highlights the necessity to re-examine the test design for the assessment of antibacterial effects under real conditions where many emerging pollutants might also be present along with microbial population since the catalyst loading, treatment time, and role of active species vary from one component to another.Acknowledgements
This study was supported by the National Natural Science Foundation of China (grant 51322901) and National Science Funds for Creative Research Groups of China (grant 51421006).References
- WHO, Drinking-water Fact sheet, http://www.who.int/mediacentre/factsheets/fs391/en/, accessed 29 January 2017.
- J. O. Tijani, O. O. Fatoba, O. O. Babajide and L. F. Petrik, Environ. Chem. Lett., 2016, 14, 27–49 CrossRef CAS.
- K. Noguera-Oviedo and D. S. Aga, J. Hazard. Mater., 2016, 316, 242–251 CrossRef CAS PubMed.
- M. Martínez-Sales, F. García-Ximénez and F. J. Espinós, Zygote, 2016, 24, 563–567 CrossRef PubMed.
- A. Zamyadi, L. Ho, H. Bustamante and M. Prévost, Water Res., 2012, 46, 1524–1535 CrossRef CAS PubMed.
- J. D. Plummer and J. K. Edzwald, Water Sci. Technol., 1998, 37, 49–55 CrossRef CAS.
- S. D. Richardson, TrAC, Trends Anal. Chem., 2003, 22, 666–684 CrossRef CAS.
- K. G. McGuigan, R. M. Conroy, H.-J. Mosler, M. du Preez, E. Ubomba-Jaswa and P. Fernandez-Ibañez, J. Hazard. Mater., 2012, 235, 29–46 CrossRef PubMed.
- E. Ubomba-Jaswa, C. Navntoft, M. I. Polo-López, P. Fernandez-Ibáñez and K. G. McGuigan, Photochem. Photobiol. Sci., 2009, 8, 587 CAS.
- M. N. Chong, B. Jin, C. W. K. Chow and C. Saint, Water Res., 2010, 44, 2997–3027 CrossRef CAS PubMed.
- A. Di, E. García-lópez, G. Marcì and L. Palmisano, J. Hazard. Mater., 2012, 211–212, 3–29 Search PubMed.
- K. Sorathiya, B. Mishra, A. Kalarikkal, K. P. Reddy, C. S. Gopinath and D. Khushalani, Sci. Rep., 2016, 6, 35075 CrossRef CAS PubMed.
- M. Bundschuh, F. Seitz, R. R. Rosenfeldt and R. Schulz, Freshwater Biol., 2016, 61, 2185–2196 CrossRef.
- D. Venieri, A. Fraggedaki, M. Kostadima, E. Chatzisymeon, V. Binas, A. Zachopoulos, G. Kiriakidis and D. Mantzavinos, Appl. Catal., B, 2014, 154, 93–101 CrossRef.
- M. Ni, M. K. H. Leung, D. Y. C. Leung and K. Sumathy, Renewable Sustainable Energy Rev., 2007, 11, 401–425 CrossRef CAS.
- K. Tahir, A. Ahmad, B. Li, S. Nazir, A. U. Khan, T. Nasir, Z. U. H. Khan, R. Naz and M. Raza, J. Photochem. Photobiol., B, 2016, 162, 189–198 CrossRef CAS PubMed.
- T. W. Ng, L. Zhang, J. Liu, G. Huang, W. Wang and P. K. Wong, Water Res., 2016, 90, 111–118 CrossRef CAS PubMed.
- K. K. Philippe, R. Timmers, R. van Grieken and J. Marugan, Ind. Eng. Chem. Res., 2016, 55, 2952–2958 CrossRef CAS.
- C. Pablos, R. van Grieken, J. Marugán and A. Muñoz, Water Sci. Technol., 2013, 68(5), 999–1003, DOI:10.2166/wst.2013.307.
- N. Khadgi, Y. Li, A. R. Upreti, C. Zhang, W. Zhang, Y. Wang and D. Wang, Photochem. Photobiol., 2016, 92, 238–246 CrossRef CAS PubMed.
- X. Xu, A. K. Azad and J. T. S. Irvine, Catal. Today, 2013, 199, 22–26 CrossRef CAS.
- Y. Yoon, P. Westerhoff, S. A. Snyder and M. Esparza, HPLC-fluorescence detection and adsorption of bisphenol A, 17β-estradiol, and 17α-ethynyl estradiol on powdered activated carbon, 2003, vol. 37 Search PubMed.
- P. S. M. Dunlop, M. Ciavola, L. Rizzo, D. A. McDowell and J. A. Byrne, Catal. Today, 2015, 240, 55–60 CrossRef CAS.
- M. M. Bradford, Anal. Biochem., 1976, 72, 248–254 CrossRef CAS PubMed.
- B. Xia, B. Chen, X. Sun, K. Qu, F. Ma and M. Du, Sci. Total Environ., 2015, 508, 525–533 CrossRef CAS PubMed.
- B. F. Machado and P. Serp, Catal. Sci. Technol., 2012, 2, 54–75 CAS.
- H. W. Tien, Y. L. Huang, S. Y. Yang, J. Y. Wang and C. C. M. Ma, Carbon, 2011, 49, 1550–1560 CrossRef CAS.
- K. Gotoh, T. Kinumoto, E. Fujii, A. Yamamoto, H. Hashimoto, T. Ohkubo, A. Itadani, Y. Kuroda and H. Ishida, Carbon, 2011, 49, 1118–1125 CrossRef CAS.
- X. Cao, L. Gu, X. Lan, C. Zhao, D. Yao and W. Sheng, Mater. Chem. Phys., 2007, 106, 175–180 CrossRef CAS.
- Q. Huang, J. Wang, W. Wei, Q. Yan, C. Wu and X. Zhu, J. Hazard. Mater., 2015, 283, 123–130 CrossRef CAS PubMed.
- H. Wang, X. Yuan, Y. Wu, H. Huang, X. Peng, G. Zeng, H. Zhong, J. Liang and M. Ren, Adv. Colloid Interface Sci., 2013, 195, 19–40 CrossRef PubMed.
- S. Liu, J. Tian, L. Wang and X. Sun, J. Nanopart. Res., 2011, 13, 4539–4548 CrossRef CAS.
- L. Sun, R. Shao, L. Tang and Z. Chen, J. Alloys Compd., 2013, 564, 55–62 CrossRef CAS.
- X. Li, Y. Hou, Q. Zhao and L. Wang, J. Colloid Interface Sci., 2011, 358, 102–108 CrossRef CAS PubMed.
- Y. Hou, X. Li, Q. Zhao and G. Chen, Appl. Catal., B, 2013, 142, 80–88 CrossRef.
- P. K. Sudeep and P. V Kamat, Chem. Mater., 2005, 17, 5404–5410 CrossRef CAS.
- Y. Liu, S. Wei and W. Gao, J. Hazard. Mater., 2015, 287, 59–68 CrossRef CAS PubMed.
- L. V. Zhukova, ACS Appl. Mater. Interfaces, 2015, 7, 27197–27205 CAS.
- C.-H. Deng, J.-L. Gong, G.-M. Zeng, Y. Jiang, C. Zhang, H.-Y. Liu and S.-Y. Huan, Chem. Eng. J., 2016, 284, 41–53 CrossRef CAS.
- S. M. Zacarías, M. L. Satuf, M. C. Vaccari and O. M. Alfano, Chem. Eng. J., 2015, 266, 133–140 CrossRef.
- J. Xie, Q. Wu and D. Zhao, Carbon, 2012, 50, 800–807 CrossRef CAS.
- World Health Organization (WHO), Guidelines for drinking-water quality, fourth edition incorporating the first addendum, World Health Organization, 2017 Search PubMed.
- L. Caballero, K. A. Whitehead, N. S. Allen and J. Verran, J. Photochem. Photobiol., A, 2009, 202, 92–98 CrossRef CAS.
- D. Wu, T. An, G. Li, W. Wang, Y. Cai, H. Y. Yip, H. Zhao and P. K. Wong, Appl. Surf. Sci., 2015, 358, 137–145 CrossRef CAS.
- S. Pigeot-Rémy, F. Simonet, D. Atlan, J. C. Lazzaroni and C. Guillard, Water Res., 2012, 46, 3208–3218 CrossRef PubMed.
- S. Pigeot-Rémy, F. Simonet, E. Errazuriz-Cerda, J. C. Lazzaroni, D. Atlan and C. Guillard, Appl. Catal., B, 2011, 104, 390–398 CrossRef.
- H. Sun, G. Li, X. Nie, H. Shi, P. Wong, H. Zhao and T. An, Environ. Sci. Technol., 2014, 48, 9412–9419 CrossRef CAS PubMed.
- J. J. Ojeda, M. E. Romero-González, R. T. Bachmann, R. G. J. Edyvean and S. A. Banwart, Langmuir, 2008, 24, 4032–4040 CrossRef CAS PubMed.
- G. Xiao, X. Zhang, W. Zhang, S. Zhang, H. Su and T. Tan, Appl. Catal., B, 2015, 170, 255–262 CrossRef.
- B. Ramalingam, T. Parandhaman and S. K. Das, ACS Appl. Mater. Interfaces, 2016, 8, 4963–4976 CAS.
- J. Romero-Mangado, D. Nordlund, F. Soberon, G. Deane, K. Maughan, S. Sainio, G. Singh, S. Daniels, I. T. Saunders, D. Loftus, M. Meyyappan, J. Koehne and R. P. Gandhiraman, Biointerphases, 2016, 11, 11009 CrossRef PubMed.
- Y. Shi, S. Jiang, K. Zhou, C. Bao, B. Yu, X. Qian, B. Wang, N. Hong, P. Wen, Z. Gui, Y. Hu and R. K. K. Yuen, Environ. Sci. Technol., 2013, 47, 8724–8732 CrossRef PubMed.
- T. W. Ng, T. An, G. Li, W. K. Ho, H. Y. Yip, H. Zhao and P. K. Wong, J. Photochem. Photobiol., B, 2015, 149, 164–171 CrossRef CAS PubMed.
- H. G. Oliveira, L. H. Ferreira, R. Bertazzoli and C. Longo, Water Res., 2015, 72, 305–314 CrossRef CAS PubMed.
- S. P. Tallósy, L. Janovák, E. Nagy, Á. Deák, Á. Juhász, E. Csapó, N. Buzás and I. Dékány, Appl. Surf. Sci., 2016, 371, 139–150 CrossRef.
- H. A. Foster, I. B. Ditta, S. Varghese and A. Steele, Appl. Microbiol. Biotechnol., 2011, 90, 1847–1868 CrossRef CAS PubMed.
- S. Boumaza, A. Boudjemaa, A. Bouguelia, R. Bouarab and M. Trari, Appl. Energy, 2010, 87, 2230–2236 CrossRef CAS.
- B. J. Wiley, S. H. Im, Z.-Y. Li, J. McLellan, A. Siekkinen and Y. Xia, J. Phys. Chem. B, 2006, 110, 15666–15675 CrossRef CAS PubMed.
- J. K. Nayak, P. Parhi and R. Jha, J. Phys. D: Appl. Phys., 2016, 49, 285101 CrossRef.
- P. M. Wood, Biochem. J., 1988, 253, 287–289 CrossRef CAS PubMed.
- M. Pelaez, N. T. Nolan, S. C. Pillai, M. K. Seery, P. Falaras, A. G. Kontos, P. S. M. Dunlop, J. W. J. Hamilton, J. A. Byrne, K. O'Shea, M. H. Entezari and D. D. Dionysiou, Appl. Catal., B, 2012, 125, 331–349 CrossRef CAS.
- W. S. Hummers and R. E. Offeman, J. Am. Chem. Soc., 1958, 80, 1339–1339 CrossRef CAS.
Footnote |
| † Electronic supplementary information (ESI) available. See DOI: 10.1039/c7ra01782k |
| This journal is © The Royal Society of Chemistry 2017 |

