DOI:
10.1039/C7RA01638G
(Paper)
RSC Adv., 2017,
7, 19448-19456
Ferroelectric, piezoelectric properties and thermal expansion of new Bi(Ni3/4W1/4)O3–PbTiO3 solid solutions
Received
9th February 2017
, Accepted 28th March 2017
First published on 3rd April 2017
Abstract
Ceramics of the Bi(Ni3/4W1/4)O3–PbTiO3 (BNW–PT) ferroelectric system were synthesized using a conventional solid-state sintering process. A morphotropic phase boundary (MPB) region separating tetragonal and rhombohedral phases has been determined based on X-ray diffraction (XRD) analysis. The composition-dependent phase transition behavior, thermal expansion, di/ferro/piezoelectric properties have been systemically investigated. The volume TECs (thermal expansion coefficients) for 0.1BNW–0.9PT and 0.2BNW–0.8PT are −1.01 × 10⁻⁵ per °C and −0.94 × 10⁻⁵ per °C, respectively, indicating the negative thermal expansion of some compositions for the binary system. The BNW–PT ceramics have Curie temperatures, TC, ranging from 460 °C to ∼152 °C with the variation of BNW constituent. The tetragonal-rich composition 0.20BNW–0.80PT is found to have the largest remnant polarization, Pr ∼ 23.4 μC cm−2. The highest piezoelectric coefficient d33 ∼ 145 pC N−1 is achieved at MPB composition 0.32BNW–0.68PT. The maximum strain value ∼0.194% is also obtained in the 0.32BNW–0.68PT ceramic.
1. Introduction
Ferro-/piezo-electric ceramics have been widely used in many fields, owing to their applications as sensors, actuators, ultrasonic transducers, and so on.1,2 In particular, Pb-based perovskite ferroelectric ceramics have been under intense investigation for many years because of their much more excellent ferroelectric and piezoelectric properties than those of most Pb-free ceramics.3–7 However, issues such as the environmental restrictions on the usage of lead, the depoling and aging of PbZrO3–PbTiO3 (PZT) piezoelectric ceramics above 200 °C have attracted a great deal of attention to search for high Curie temperature lead-reduced materials.8,9 Therefore, BiMeO3–PbTiO3 (Me represents cations of rare earth metal or transition metal, such as Sc, Fe, In, Mg1/2Ti1/2, and so on) binary system as a class of lead-reduced materials has been explored and developed, because most of BiMeO3–PbTiO3 family were found to display high Curie temperatures and fairish piezoelectric coefficients.10–15 For example, BiScO3–PbTiO3 (BS–PT) composition in the MPB region exhibits excellent piezoelectric properties d33 = 460 pC N−1 and TC = 450 °C, which is comparable with many Pb-based ceramics.16 The BiFeO3–PbTiO3 system displays high ferroelectric Curie temperature (TC ∼ 640 °C) in the MPB region and weak-ferromagnetic ordering at high temperature (TN ∼ 104 °C), becoming a multiferroic material which was investigated widely and intensively.17 (1 − x)Bi(Mg1/2Ti1/2)O3–xPbTiO3 (x = 0.37) possesses high Curie temperature TC ∼ 450 °C and piezoelectric coefficient d33 ∼ 225 pC N−1.18 The morphotropic phase boundary (MPB) composition x = 0.62 of (1 − x)Bi(Ni1/2Hf1/2)O3–xPbTiO3 (BNH–PT) shows a high piezoelectric coefficient of d33 ∼ 446 pC N−1 and Curie temperature TC ∼ 290 °C.19 Given these examples, there is no doubt that many BiMeO3–PbTiO3 systems may be useful for high temperature piezoelectric applications. In addition, many PbTiO3-based compounds were found to display negative or near-zero thermal expansion, which is of great importance for designing some precision devices.19–22 Especially, it is meaningful to get negative or near-zero thermal expansion for BiMeO3–PbTiO3, because the Bi substitution plays an important role in enhancing the tetragonality c/a (high tetragonality c/a corresponds to negative thermal expansion) and Curie temperature TC due to the strong coupling between the A-site Pb/Bi cations and the B-site ferroelectric cations.23,24 Therefore, in order to get a material which shows good ferro/piezoelectric properties, high Curie temperature and negative thermal expansive, it is worth to explore new BiMeO3–PbTiO3 system. Here, Bi(Ni3/4W1/4)O3–PbTiO3 (BNW–PT) were chosen owing to the possibility of stable solid solution formed, according to the calculated tolerance factor t ≈ 0.89 of BNW by the following formula (1):| |
 | (1) |
(RA, RB, RO are the effective ionic radius of A, B cations and O anion in ABO3 compounds). When t is located in the range from 0.78 to 1.05, the compound may be formed in a stable perovskite structure.
In this work, BNW–PT ceramics were prepared by conventional solid-state reaction. The phase structures, thermal expansion, dielectric, ferroelectric and piezoelectric properties of BNW–PT ceramics were studied and analyzed systematically.
2. Experimental procedure
The ceramic samples of xBNW–(1 − x)PT with compositions of x = 0.10, 0.20, 0.3, 0.32, 0.34, 0.36 and 0.40 were prepared by a conventional solid-state reaction process. Ceramic samples were fabricated using metal oxide powders with 99.9% purity, sample preparation details are as follows: NiO and TiO2 powders were weighed according to the stoichiometric amount, while PbO and Bi2O3 were weighed with 1–2 mol% excess to compensate for volatilization during sintering and WO3 with 3 mol% excess to compensate for sublimation. At first, these metal oxide powders were mixed homogeneously and milled using ethanol for 2 h. After milling, the powders were pressed into pellets with 25 mm diameter at 4 MPa. The pressed powders were calcined at 900 °C for 5 h in air. After calcination, the pieces were remilled using ethanol for 2 h and mixed with 5 wt% polyvinyl alcohol (PVA) as a binder. The powders were pressed into pellets with 5–6 mm thickness at 7 MPa, and then heated up to 550 °C and kept for 2 h to eliminate the binder. Finally, the discs were sintered at 930 °C to 960 °C for 3 h in a sealed Al2O3 crucible to form a series of desired ceramic samples.
The powder XRD patterns of sintered ceramics were collected by XRD equipment with Cu Kα radiation (Rigaku, MinFlex 600, Japan). The microstructure of the fracture surface of sintered ceramic pieces was observed by scanning electron microscope (SEM, SU-8010, Tokyo, Japan). Two faces of pellets with 0.5 mm in thickness were polished and painted with silver paste for electrodes. Dielectric and piezoelectric measurements were carried out after ferroelectric measurements. The piezoelectric constant d33 was measured by a piezo-d33 quasi static meter (ZJ-3AN; Institute of Acoustics, Beijing, China). The temperature dependence of dielectric properties was collected on a TH2816A LCR (Changzhou, China) analyzer with a heating rate of 3 °C min−1. The ferroelectric and strain measurements were carried out by a ferroelectric test system (TF Analyzer 2000E; axiACCT, Aachen, Germany). The high temperature XRD data was collected on a power diffractometer (Rigaku, Ultima-IV, Japan). The macroscopical thermal expansion coefficients of ceramics were determined from dilatometric measurements using a thermal expansion analyzer (DIL402PC, Germany) with clubbed samples (diameter 4–6 mm, length 11 mm) at a heating speed of 8 °C min−1.
3. Results and discussion
3.1 Structural characterizations
Fig. 1 shows the powder XRD patterns of the xBNW–(1 − x)PT ceramics with x = 0.10, 0.20, 0.3, 0.32, 0.34, 0.36 and 0.40. As shown at the bottom of the figure, 0.10BNT–0.90PT ceramics have crystallized in the tetragonal perovskite structure, resulting from more tetragonal symmetry PT content in the composition. The XRD profiles of (200) reflection splits into two peaks for the tetragonal (T) phase from x = 0.10 to x = 0.32, with an intensity ratio of the T(002) and T(200)/(020) peaks of 1![[thin space (1/6-em)]](https://www.rsc.org/images/entities/char_2009.gif) :
:![[thin space (1/6-em)]](https://www.rsc.org/images/entities/char_2009.gif) 2. However, with increasing BNW content, the XRD profile of (200) reflection shows only a single peak R(200) for the rhombohedral (R) phase due to all the planes of (200) sharing the same lattice parameters from x = 0.34 to x = 0.40, resulting from BNW having rhombohedral symmetry at room temperature. Therefore, based on the (200) reflections (marked by black box around 2θ = 45°), the MPB region from rhombohedral phase to tetragonal phase is determined at about 30–34 mol% BNW. The pseudocubic (200) reflections of xBNW–(1 − x)PT ceramics (x = 0.30–0.34) are shown in Fig. 2. The (200) reflection is composed of different numbers of peaks. The dominant peaks 1 and 2 represent the tetragonal phase, and the peak 3 corresponds to the rhombohedral phase. Thus, there is the coexistence of rhombohedral and tetragonal phases for 0.32BNW–0.68PT composition. The ratio of the rhombohedral phase and tetragonal phase for 0.32BNW–0.68PT composition in MPB region has been calculated based on the formula
2. However, with increasing BNW content, the XRD profile of (200) reflection shows only a single peak R(200) for the rhombohedral (R) phase due to all the planes of (200) sharing the same lattice parameters from x = 0.34 to x = 0.40, resulting from BNW having rhombohedral symmetry at room temperature. Therefore, based on the (200) reflections (marked by black box around 2θ = 45°), the MPB region from rhombohedral phase to tetragonal phase is determined at about 30–34 mol% BNW. The pseudocubic (200) reflections of xBNW–(1 − x)PT ceramics (x = 0.30–0.34) are shown in Fig. 2. The (200) reflection is composed of different numbers of peaks. The dominant peaks 1 and 2 represent the tetragonal phase, and the peak 3 corresponds to the rhombohedral phase. Thus, there is the coexistence of rhombohedral and tetragonal phases for 0.32BNW–0.68PT composition. The ratio of the rhombohedral phase and tetragonal phase for 0.32BNW–0.68PT composition in MPB region has been calculated based on the formula  , and the ratio value is 0.495. In addition, it can be seen that the phase is becoming impure with the increase of BNW content, the formation of impurity can be seen in position of 2θ = 27.69° for the compositions x = 0.36 and 0.40, indicating that it is difficult to form the stable perovskite structure for BNW–PT solid solution when x(BNW) > 0.36. Based on the analysis of the impure peak in 27.69°, we estimate that the impure phase should be Bi3.84W0.16O6.24, the substance is formed easily in some solid-state reaction when Bi2O3 and WO3 are used as reaction raw materials. Yao et al. also observed the formation of Bi3.84W0.16O6.24 when they synthesized Bi2WO6 by solid-state method.25 Fig. 3 presents that the compositional dependences of lattice parameter a(c) and the tetragonality c/a, it should be noted that there is an increase in a lattice parameter with BNW raising, but a decrease in c lattice parameter, which leads to a decrease of the tetragonality c/a with the increase of BNW.
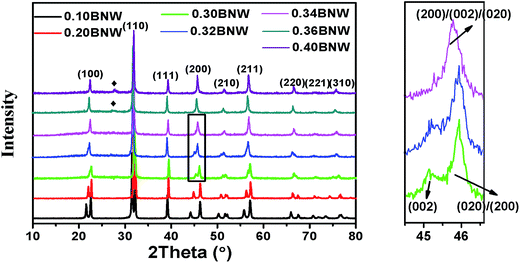 |
| | Fig. 1 Powder X-ray diffraction patterns of xBNW–(1 − x)PT ceramics with x = 0.1–0.4 (right); the enlarged XRD profiles of (200) reflections for MPB compositions (left). | |
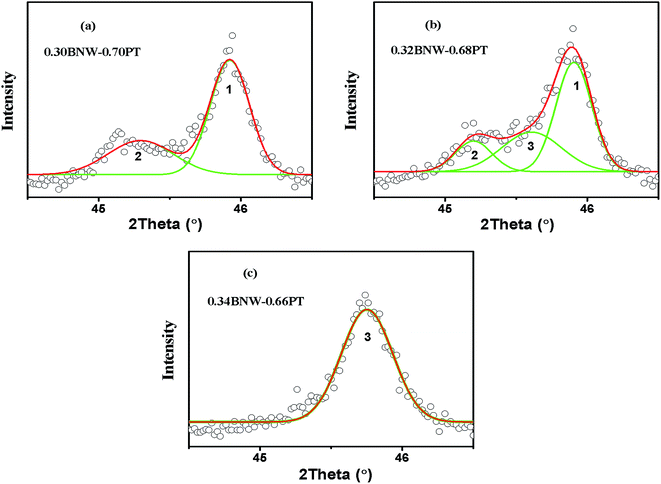 |
| | Fig. 2 Pseudocubic (200) reflections of the BNW–PT ceramics: (a) 0.30 BNW–0.70PT; (b) 0.32 BNW–0.68PT; (c) 0.34 BNW–0.66PT. | |
 |
| | Fig. 3 (a) The unit cell parameters a, c for all compositions; (b) the tetragonality c/a for all compositions. | |
The SEM micrographs of a fractured surface for selected xBNW–(1 − x)PT ceramics with x = 0.10, 0.2, 0.3 and 0.4 are presented in Fig. 4. It can be seen clearly that well sintered ceramics were obtained for all ceramics. The grain size is gradually decreasing with increasing the BNW content. The actual density was measured using Archimedes method, and the theoretical density was calculated based on XRD. The theoretical and actual density of the samples was presented in Table 1. The relative density reaches up to 94.4–98.1%, indicating high density.
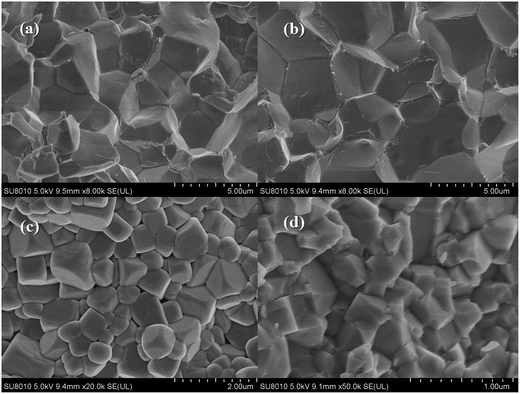 |
| | Fig. 4 SEM micrographs of fracture surfaces for xBNW–(1 − x)PT ceramics: (a) 0.10BNW–0.90PT; (b) 0.20BNW–0.80PT; (c) 0.30BNW–0.70PT; (d) 0.40BNW–0.60PT. | |
Table 1 The grain size, theoretical density, actual density and relative density of the samples xBNW–(1 − x)PT (x = 0.1–0.4)
| Composition |
Grain size (μm) |
Theoretical density (g cm−3) |
Actual density (g cm−1) |
Relative density (%) |
| 0.10BNW–0.90PT |
5 |
8.5026 |
8.0293 |
94.43 |
| 0.20BNW–0.80PT |
5 |
8.5914 |
8.2402 |
95.91 |
| 0.30BNW–0.70PT |
0.6 |
8.7083 |
8.4822 |
97.40 |
| 0.40BNW–0.60PT |
0.4 |
8.7755 |
8.6115 |
98.13 |
3.2 Thermal expansion
The high temperature X-ray powder diffraction patterns (HTXRD) and unit cell parameters a, c of the xBNW–(1 − x)PT ceramics with x = 0.1 and 0.2 are shown in Fig. 5. The Curie temperatures TC of the two compositions by HTXRD are in good agreement with those of dielectric spectra (the Section 3.3). The Curie temperatures TC are in the range of 420–460 °C for 0.1BNW–0.9PT and 320–360 °C for 0.2BNW–0.8PT, based on (100) peaks. The Fig. 6(a) presents the tetragonality c/a as a function of temperature. It is observed that the tetragonality c/a is decreasing with increasing BNW content, and there is a larger decrease of the tetragonality c/a for 0.1BNW–0.9PT ceramic, which leads to enhanced NTE.26 Therefore, as shown in Fig. 6(b), both 0.1BNW–0.9PT and 0.2BNW–0.8PT display reduced cell volumes, but 0.3BNW–0.7PT shows increased cell volume. The volume TECs for these ceramics are listed in Table 2. The measurements of dilatometric thermal expansion on clubbed BNT–PT ceramics were taken to characterize the materials' apparent thermal expansion, and the results are shown in Fig. 7. The linear TECs are also listed in Table 2. It can be seen that the TECs for 0.1BNW–0.9PT (−1.01 × 10⁻⁵ per °C) and 0.2BNW–0.8PT (−0.94 × 10⁻⁵ per °C) are very small, compared to BiFeO3–PbTiO3 (−3.92 × 10⁻⁵ per °C) and Pb1−xCdxTiO3 (−2.40 × 10⁻⁵ per °C), indicating that the variation of temperature will have less impact on the volumes of the materials.21,22 In addition, the ceramic sintering process is much affected by their discrepant NTEs, it is difficult to sinter dense ceramics for the strong NTE materials, this is why the relative density is decreasing with the content of BNW decreasing (as shown in Table 2).26
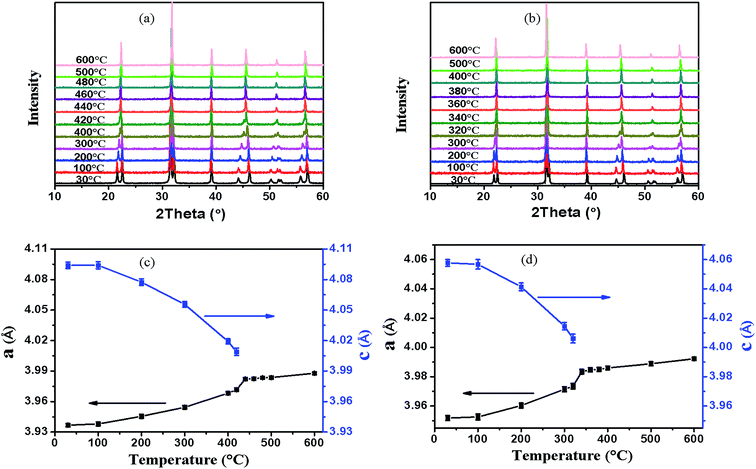 |
| | Fig. 5 High temperature X-ray diffraction patterns and the variation of the unit cell parameters a(c) with respect to the temperature for 0.10BNW–0.90PT (a and c) and 0.20BNW–0.80PT (b and d). | |
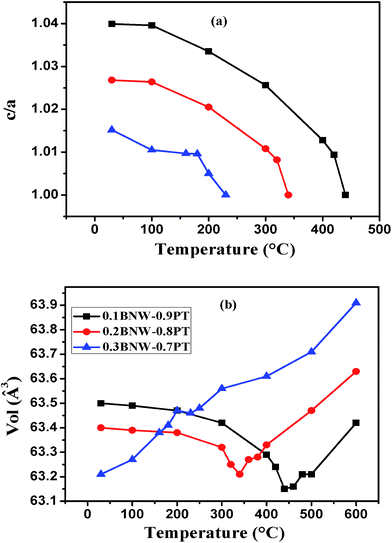 |
| | Fig. 6 (a) The tetragonality c/a as functions of temperature for xBNW–(1 − x)PT ceramics with x = 0.10–0.30; (b) the unit cell volume as functions of temperature for xBNW–(1 − x)PT ceramics with x = 0.10–0.30. | |
Table 2 Average TECs of xBNW–(1 − x)PT ceramics (x = 0.1–0.3)
| Composition |
αV |
αl |
TEC (10−5 per °C) |
| Temperature range (°C) |
| x = 0.1 |
−1.01 |
−0.16 |
30–450 |
| x = 0.2 |
−0.92 |
0.27 |
30–350 |
| x = 0.3 |
1.98 |
0.49 |
30–240 |
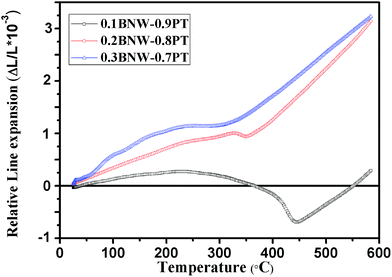 |
| | Fig. 7 Dilatometric curves of ceramic bars for xBNW–(1 − x)PT for x = 0.10–0.30. | |
3.3 Dielectric properties
The temperature dependences of the real permittivity (ε′) and dielectric loss (tan![[thin space (1/6-em)]](https://www.rsc.org/images/entities/char_2009.gif) δ) for the selected compositions xBNW–(1 − x)PT (x = 0.2, 0.3, 0.34, 0.36) measured at different frequencies are shown in Fig. 8. In general, the paraelectric–ferroelectric phase transition varies in the range from 460 to 152 °C, the Curie temperature TC in MPB region is around 220 °C. It is common sense that the Curie temperature TC of tetragonal ABO3 perovskites is generally correlated to the tetragonality c/a. High tetragonality c/a means large distorted lattice symmetry, which requires higher temperature to eliminate the crystalline distortion.19,27 This is in excellent agreement with previous reports.28–30 Fig. 9 displays the compositional dependences of the Curie temperature TC and room-temperature dielectric permittivity ε′RT, it is found that the 0.60BNW–0.40PT has the lowest Curie temperature, which is about 152 °C and increasing to the highest Curie temperature 460 °C for 0.10BNW–0.90PT. The compositional dependence of the Curie temperature is almost linear with changing BNW content in the process from tetragonal phase to the rhombohedral region. The result is analogous to some ferroelectric systems such as Pb(Yb1/2Nb1/2)O3–PbTiO3 ceramics and crystals.31 However, the room-temperature dielectric constant ε′RT increases with the increase of BNW content. This is because ignoring the influence of the ionic radius difference, raising BNW content would lead to the increase of the sum of ionic polarizability, as a result, the dielectric constant would be enhanced.32
δ) for the selected compositions xBNW–(1 − x)PT (x = 0.2, 0.3, 0.34, 0.36) measured at different frequencies are shown in Fig. 8. In general, the paraelectric–ferroelectric phase transition varies in the range from 460 to 152 °C, the Curie temperature TC in MPB region is around 220 °C. It is common sense that the Curie temperature TC of tetragonal ABO3 perovskites is generally correlated to the tetragonality c/a. High tetragonality c/a means large distorted lattice symmetry, which requires higher temperature to eliminate the crystalline distortion.19,27 This is in excellent agreement with previous reports.28–30 Fig. 9 displays the compositional dependences of the Curie temperature TC and room-temperature dielectric permittivity ε′RT, it is found that the 0.60BNW–0.40PT has the lowest Curie temperature, which is about 152 °C and increasing to the highest Curie temperature 460 °C for 0.10BNW–0.90PT. The compositional dependence of the Curie temperature is almost linear with changing BNW content in the process from tetragonal phase to the rhombohedral region. The result is analogous to some ferroelectric systems such as Pb(Yb1/2Nb1/2)O3–PbTiO3 ceramics and crystals.31 However, the room-temperature dielectric constant ε′RT increases with the increase of BNW content. This is because ignoring the influence of the ionic radius difference, raising BNW content would lead to the increase of the sum of ionic polarizability, as a result, the dielectric constant would be enhanced.32
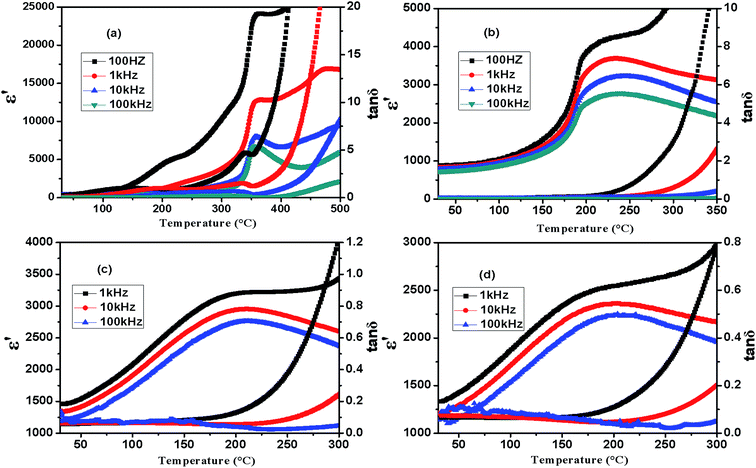 |
| | Fig. 8 Temperature dependence of dielectric permittivity ε′ and dielectric loss tan![[thin space (1/6-em)]](https://www.rsc.org/images/entities/char_2009.gif) δ for xBNW–(1 − x)PT ceramics: (a) 0.20BNW–0.80PT; (b) 0.30BNW–0.70PT; (c) 0.34BNW–0.64PT; (d) 0.36BNW–0.62PT. δ for xBNW–(1 − x)PT ceramics: (a) 0.20BNW–0.80PT; (b) 0.30BNW–0.70PT; (c) 0.34BNW–0.64PT; (d) 0.36BNW–0.62PT. | |
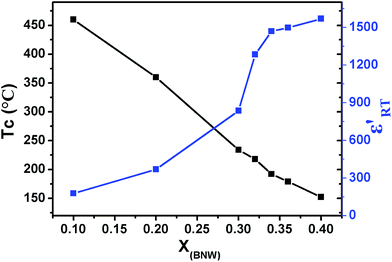 |
| | Fig. 9 Curie temperature TC and the real permittivity ε′RT as functions of BNW content for xBNW–(1 − x)PT ceramics. | |
3.4 Ferroelectric properties
Fig. 10(a) and (b) show the polarization–electrical field (P–E) hysteresis loops and switching currents of xBNW–(1 − x)PT ceramics with all compositions under bipolar electric fields of 60–90 kV cm−1 at room temperature. Good saturated loops can be obtained, and the shape of hysteresis loops is developing from rectangular to slim with raising the content of BNW, as a result of the decrease in the c/a ratio and the smaller lattice distortion. Therefore, the coercive field EC is monotonically decreasing from 57.15 to 13.63 kV cm−1 with increasing the content of BNW. However, the remnant polarization Pr firstly increases and then decreases, and reaches a maximum value of ∼23.4 μC cm−2 at 0.20BNW–0.80PT which is tetragonal phase-rich composition near MPB region. The cause is that ferroelectric domains of compositions near the MPB are switched more easily, due to the coexistence of two phases giving a total of fourteen possible polarization directions (six tetragonal 〈001〉 and eight rhombohedral 〈111〉).33 The Pr value gets largest in the composition 0.2BNW–0.8PT because the composition is close to the MPB region, and there is the coexistence of most tetragonal phase and a small amount rhombohedral phase. Therefore, the remnant polarization Pr may be optimal for 0.20BNW–0.80PT composition (Table 3).
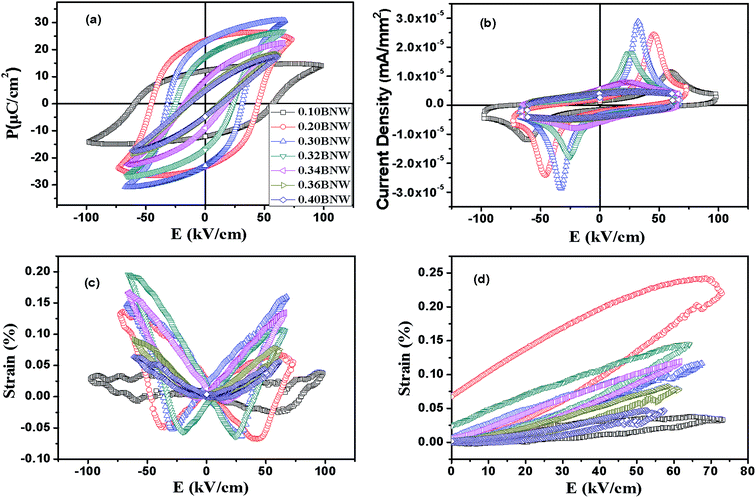 |
| | Fig. 10 (a) Polarization–electrical field (P–E) hysteresis loops for xBNW–(1 − x)PT ceramics with different x values at bipolar electric fields of about 60–100 kV cm−1 at 5 Hz; (b) switching current; (c) bipolar electric-field-induced strain curves; (d) unipolar electric-field-induced strain curves. | |
Table 3 The remanent polarization Pr, coercive field EC, Curie temperature TC, real permittivity (ε′), dielectric loss (tan![[thin space (1/6-em)]](https://www.rsc.org/images/entities/char_2009.gif) δ) and piezoelectric coefficient d33 for xBNW–(1 − x)PT ceramics
δ) and piezoelectric coefficient d33 for xBNW–(1 − x)PT ceramics
| Composition |
Pr (μC cm−2) |
EC (kV cm−1) |
S (%) |
TC (°C) |
ε′ (@RT) |
tan![[thin space (1/6-em)]](https://www.rsc.org/images/entities/char_2009.gif) δ (@RT) δ (@RT) |
d33 (pC N−1) |
| 0.10BNW–0.90PT |
12.35 |
57.15 |
0.04 |
460 |
177 |
0.095 |
51 |
| 0.20BNW–0.80PT |
23.40 |
44.65 |
0.132 |
360 |
369 |
0.096 |
89 |
| 0.30BNW–0.70PT |
22.86 |
31.25 |
0.162 |
234 |
836 |
0.040 |
105 |
| 0.32BNW–0.68PT |
17.01 |
23.91 |
0.194 |
218 |
1284 |
0.038 |
145 |
| 0.34BNW–0.66PT |
8.84 |
17.33 |
0.166 |
192 |
1469 |
0.058 |
59 |
| 0.36BNW–0.64PT |
4.97 |
13.64 |
0.093 |
179 |
1337 |
0.066 |
34 |
| 0.40BNW–0.60PT |
4.72 |
13.63 |
0.074 |
152 |
1568 |
0.068 |
20 |
Fig. 10(c) and (d) show the bipole and unipole electric-field-induced strain curves of xBNW–(1 − x)PT ceramics with different x measured at 5 Hz at room temperature. It is found that the compositions (x = 0.2–0.34) display more outstanding strain hysteresis under bipolar cycling, that is symmetric butterfly-shaped strain hysteresis with relatively large negative strain originating from domain back switching, whereas the rhombohedral compositions with x = 0.36 and 0.4 show less obvious strain hysteresis, this may be because domain switching is hindered by point defects resulted from oxygen vacancy with BNW increasing. Therefore, the strain reached the maximum value ∼0.194% at the composition of x = 0.32 which lies in MPB region, as presented in Fig. 11(b). The Fig. 12(a) presents the XPS spectrum for some compositions, the peaks of O 1s are shown in Fig. 12(b). It can be seen that the peaks of O 1s are composed of oxygen in BNW–PT lattice ((I) in 529.5 eV) and oxygen vacancies/OH− groups ((II) in 531 eV), which is in good agreement with many references.34,35 The XPS results show the existence of many oxygen vacancies for 0.36BNW–0.64PT and 0.40BNW–0.60PT ceramics. In order to make the results convincing, we further calculated the ratio of the oxygen atoms in lattice, the theory ratio for the two compositions should be 60% but the calculated ratios based on the XPS spectra are 56.60% for 0.40BNW–0.60PT ceramic and 57.13% for 0.36BNW–0.64PT ceramic, respectively.
 |
| | Fig. 11 Coercive field EC, remnant polarization Pr, strain S% and piezoelectric constant d33 as functions of BNW content for xBNW–(1 − x)PT ceramics. | |
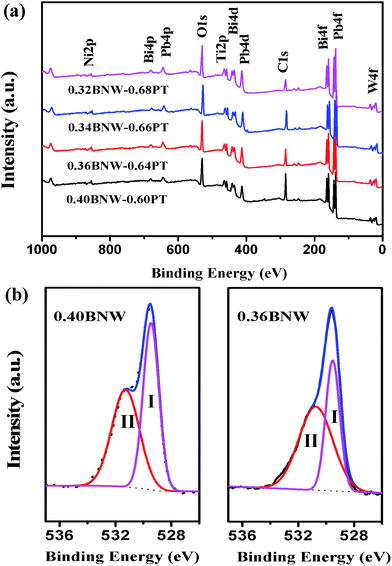 |
| | Fig. 12 (a) XPS spectra of xBNW–(1 − x)PT ceramics (x = 0.32, 0.34, 0.36 and 0.40), (b) high-resolution XPS spectra of the O 1s. | |
3.5 Piezoelectric properties
The compositional dependence of piezoelectric coefficient d33 is presented in Fig. 11. It can be seen that piezoelectric coefficient d33 varies in the range 20–145 pC N−1 with the variation of BNW content, which initially increases and reaches the maximum, and then decreases. The maximum of piezoelectric coefficient d33 ∼ 145 pC N−1 is obtained at 0.32BNW–0.68PT composition, which is located in the transition region from rhombohedral phase to tetragonal phase based on the XRD analysis. This is because fourteen polarization directions in MPB region enables optimized crystallographic orientations to be established easily in the poling process, which results in anomalously high piezoelectric properties in MPB region.33
4. Conclusions
In summary, BNW–PT ferroelectric ceramics were fabricated by a conventional solid-state sintering process. The composition and temperature-dependent phase transition, thermal expansion behavior, electric properties have been systemically investigated. The results indicate that the variation of BNW content significantly affects the structure and electric properties of the BNW–PT ceramics. Ceramics of 0.1BNW–0.9PT and 0.2BNW–0.8PT display reduced cell volumes of −1.01 × 10⁻⁵ per °C and −0.94 × 10⁻⁵ per °C, respectively, but 0.3BNW–0.7PT shows increased cell volume of 1.98 × 10⁻⁵ per °C. The dielectric measurements show that the BNW–PT ceramics have high Curie temperature TC which ranges from 460 °C to 152 °C with the variation of BNW content. The tetragonal-rich composition 0.20BNW–0.80PT possesses the largest remnant polarization Pr ∼ 23.4 μC cm−2. The highest piezoelectric coefficient d33 ∼ 145 pC N−1 is achieved at MPB composition 0.32BNW–0.68PT. The maximum strain value ∼0.194% is also obtained in the 0.32BNW–0.68PT ceramic.
Acknowledgements
This work was financially supported by the Natural Science Foundation of China (Grant No. 21373224, 21577143 and 51502289), the Natural Science Foundation of Fujian Province (Grant No. 2014H0054 and 2016J05144), the open project program of the CAS Key Laboratory of Inorganic Functional Materials and Devices (Grant No. KLIFMD-2014-03) and the One Hundred Talents Program of the Chinese Academy of Sciences.
References
- S. J. Zhang and F. Li, J. Appl. Phys., 2012, 111, 031301 CrossRef.
- S. E. Park, P. D. Lopath, K. K. Shung and T. R. Shrout, J. Acoust. Soc. Am., 1997, 3094, 140–147 Search PubMed.
- G. H. Haertling, J. Am. Ceram. Soc., 1999, 82, 797 CrossRef CAS.
- S. L. Swartz and T. R. Shrout, Mater. Res. Bull., 1982, 17, 1245 CrossRef CAS.
- S. E. Park and T. R. Shrout, J. Appl. Phys., 1997, 82, 1804 CrossRef CAS.
- H. S. Luo, G. S. Xu, P. C. Wang and Z. W. Yin, Ferroelectrics, 1999, 231, 685 CAS.
- A. A. Bokov and Z. G. Ye, Appl. Phys. Lett., 2000, 77, 1888 CrossRef CAS.
- C. J. Stringer, N. J. Donnelly, T. R. Shrout, C. A. Randall, E. F. Alberta and W. S. Hackenberger, J. Am. Ceram. Soc., 2008, 91, 1781 CrossRef CAS.
- A. H. Qureshi, G. Shabbir and D. A. Hall, Mater. Lett., 2007, 61, 4482 CrossRef CAS.
- S. J. Zhang, R. Xia, C. A. Randall and R. S. Thomas, J. Mater. Res., 2005, 20, 2067 CrossRef CAS.
- L. L. Fan, J. Chen, S. Li, H. J. Kang, L. J. Liu and L. Fang, Appl. Phys. Lett., 2013, 102, 022905 CrossRef.
- J. R. Cheng, W. Y. Zhu, N. Li and L. E. Cross, Mater. Lett., 2003, 57, 2090 CrossRef CAS.
- C. A. Randall, R. Eitel, B. Jones, T. R. Shrout, D. I. Woodward and I. M. Reaney, J. Appl. Phys., 2004, 95, 3633 CrossRef CAS.
- M. R. Suchomel and P. K. Davies, J. Appl. Phys., 2004, 96, 4405 CrossRef CAS.
- T. Sebastian, I. Sterianou, D. C. Sinclair, I. M. Reaney, A. J. Bell and D. A. Hall, J. Electroceram., 2010, 25, 130 CrossRef CAS.
- R. E. Eitel, C. A. Randall, T. R. Shrout and S. E. Park, Jpn. J. Appl. Phys., Part 1, 2002, 41, 2099 CrossRef CAS.
- T. P. Comyn, S. P. McBride and A. J. Bell, Mater. Lett., 2004, 58, 3844 CrossRef CAS.
- Z. Pan, J. Chen, L. L. Fan, L. J. Liu, L. Fang and X. R. Xing, J. Appl. Phys., 2012, 112, 114120 CrossRef.
- J. Chen, X. R. Xing, C. Sun, P. Hu, R. B. Yu, X. W. Wang and L. H. Li, J. Am. Chem. Soc., 2008, 130, 1144 CrossRef CAS PubMed.
- P. Hu, J. Chen, J. X. Deng and X. R. Xing, J. Am. Chem. Soc., 2010, 132, 1925 CrossRef CAS PubMed.
- J. Chen, X. R. Xing, G. R. Liu, J. H. Li and Y. T. Liu, Appl. Phys. Lett., 2006, 89, 101914 CrossRef.
- J. Chen, X. R. Xing, R. B. Yu and G. B. Liu, Appl. Phys. Lett., 2005, 87, 231915 CrossRef.
- I. Grinberg, M. R. Suchomel, W. Dmowski, S. E. Mason, H. Wu, P. K. Davies and A. M. Rappe, Phys. Rev. Lett., 2007, 98, 107601 CrossRef PubMed.
- I. Grinberg, M. R. Suchomel, P. K. Davies and A. M. Rappe, J. Appl. Phys., 2005, 98, 094111 CrossRef.
- S. H. Yao, J. Y. Wei, B. B. Huang, S. Y. Feng, X. Y. Zhang and X. Y. Qin, J. Solid State Chem., 2009, 182, 236 CrossRef CAS.
- J. Chen, K. Nittala, J. S. Forrester, J. L. Jones, J. X. Deng, R. Yu and X. R. Xing, J. Am. Chem. Soc., 2011, 133, 11114 CrossRef CAS PubMed.
- D. M. Stein, M. R. Suchomel and P. K. Davies, Appl. Phys. Lett., 2006, 89, 132907 CrossRef.
- R. E. Eitel, C. A. Randall, T. R. Shrout, P. W. Rehrig, W. Hackenberger and S. E. Park, Jpn. J. Appl. Phys., Part 1, 2001, 40, 5999 CrossRef CAS.
- J. Chen, X. L. Tan, W. Jo and J. Reodel, J. Appl. Phys., 2009, 106, 034109 CrossRef.
- C. J. Stringer, R. E. Eitel, T. R. Shrout, I. M. Reaney and C. A. Randall, J. Appl. Phys., 2005, 97, 024101 CrossRef.
- S. J. Zhang, S. Rhee, C. A. Randall and T. R. Shrout, Jpn. J. Appl. Phys., Part 1, 2002, 41, 722 CrossRef CAS.
- Q. Li, W. B. Ma, C. C. Tang, X. Y. Meng, J. Q. Ma and B. B. Niu, Mater. Res. Innovations, 2015, 19, S45 CrossRef CAS.
- C. A. Randall, N. Kim, J. P. Kucera, W. W. Cao and T. R. Shrout, J. Am. Ceram. Soc., 1998, 81, 677 CrossRef CAS.
- E. Ramos Moore, P. Ferrari, D. E. Diaz Droguett, D. Lederman and J. T. Evans, J. Appl. Phys., 2012, 111, 014108 CrossRef.
- Q. Zou, H. Ruda, B. G. Yacobi and M. Farrell, Thin Solid Films, 2002, 402, 65 CrossRef CAS.
|
| This journal is © The Royal Society of Chemistry 2017 |
Click here to see how this site uses Cookies. View our privacy policy here.  Open Access Article
 and
Zhiguo Yi*

![[thin space (1/6-em)]](https://www.rsc.org/images/entities/char_2009.gif) :
:![[thin space (1/6-em)]](https://www.rsc.org/images/entities/char_2009.gif) 2. However, with increasing BNW content, the XRD profile of (200) reflection shows only a single peak R(200) for the rhombohedral (R) phase due to all the planes of (200) sharing the same lattice parameters from x = 0.34 to x = 0.40, resulting from BNW having rhombohedral symmetry at room temperature. Therefore, based on the (200) reflections (marked by black box around 2θ = 45°), the MPB region from rhombohedral phase to tetragonal phase is determined at about 30–34 mol% BNW. The pseudocubic (200) reflections of xBNW–(1 − x)PT ceramics (x = 0.30–0.34) are shown in Fig. 2. The (200) reflection is composed of different numbers of peaks. The dominant peaks 1 and 2 represent the tetragonal phase, and the peak 3 corresponds to the rhombohedral phase. Thus, there is the coexistence of rhombohedral and tetragonal phases for 0.32BNW–0.68PT composition. The ratio of the rhombohedral phase and tetragonal phase for 0.32BNW–0.68PT composition in MPB region has been calculated based on the formula
2. However, with increasing BNW content, the XRD profile of (200) reflection shows only a single peak R(200) for the rhombohedral (R) phase due to all the planes of (200) sharing the same lattice parameters from x = 0.34 to x = 0.40, resulting from BNW having rhombohedral symmetry at room temperature. Therefore, based on the (200) reflections (marked by black box around 2θ = 45°), the MPB region from rhombohedral phase to tetragonal phase is determined at about 30–34 mol% BNW. The pseudocubic (200) reflections of xBNW–(1 − x)PT ceramics (x = 0.30–0.34) are shown in Fig. 2. The (200) reflection is composed of different numbers of peaks. The dominant peaks 1 and 2 represent the tetragonal phase, and the peak 3 corresponds to the rhombohedral phase. Thus, there is the coexistence of rhombohedral and tetragonal phases for 0.32BNW–0.68PT composition. The ratio of the rhombohedral phase and tetragonal phase for 0.32BNW–0.68PT composition in MPB region has been calculated based on the formula  , and the ratio value is 0.495. In addition, it can be seen that the phase is becoming impure with the increase of BNW content, the formation of impurity can be seen in position of 2θ = 27.69° for the compositions x = 0.36 and 0.40, indicating that it is difficult to form the stable perovskite structure for BNW–PT solid solution when x(BNW) > 0.36. Based on the analysis of the impure peak in 27.69°, we estimate that the impure phase should be Bi3.84W0.16O6.24, the substance is formed easily in some solid-state reaction when Bi2O3 and WO3 are used as reaction raw materials. Yao et al. also observed the formation of Bi3.84W0.16O6.24 when they synthesized Bi2WO6 by solid-state method.25 Fig. 3 presents that the compositional dependences of lattice parameter a(c) and the tetragonality c/a, it should be noted that there is an increase in a lattice parameter with BNW raising, but a decrease in c lattice parameter, which leads to a decrease of the tetragonality c/a with the increase of BNW.


![[thin space (1/6-em)]](https://www.rsc.org/images/entities/char_2009.gif) δ) for the selected compositions xBNW–(1 − x)PT (x = 0.2, 0.3, 0.34, 0.36) measured at different frequencies are shown in Fig. 8. In general, the paraelectric–ferroelectric phase transition varies in the range from 460 to 152 °C, the Curie temperature TC in MPB region is around 220 °C. It is common sense that the Curie temperature TC of tetragonal ABO3 perovskites is generally correlated to the tetragonality c/a. High tetragonality c/a means large distorted lattice symmetry, which requires higher temperature to eliminate the crystalline distortion.19,27 This is in excellent agreement with previous reports.28–30 Fig. 9 displays the compositional dependences of the Curie temperature TC and room-temperature dielectric permittivity ε′RT, it is found that the 0.60BNW–0.40PT has the lowest Curie temperature, which is about 152 °C and increasing to the highest Curie temperature 460 °C for 0.10BNW–0.90PT. The compositional dependence of the Curie temperature is almost linear with changing BNW content in the process from tetragonal phase to the rhombohedral region. The result is analogous to some ferroelectric systems such as Pb(Yb1/2Nb1/2)O3–PbTiO3 ceramics and crystals.31 However, the room-temperature dielectric constant ε′RT increases with the increase of BNW content. This is because ignoring the influence of the ionic radius difference, raising BNW content would lead to the increase of the sum of ionic polarizability, as a result, the dielectric constant would be enhanced.32
δ) for the selected compositions xBNW–(1 − x)PT (x = 0.2, 0.3, 0.34, 0.36) measured at different frequencies are shown in Fig. 8. In general, the paraelectric–ferroelectric phase transition varies in the range from 460 to 152 °C, the Curie temperature TC in MPB region is around 220 °C. It is common sense that the Curie temperature TC of tetragonal ABO3 perovskites is generally correlated to the tetragonality c/a. High tetragonality c/a means large distorted lattice symmetry, which requires higher temperature to eliminate the crystalline distortion.19,27 This is in excellent agreement with previous reports.28–30 Fig. 9 displays the compositional dependences of the Curie temperature TC and room-temperature dielectric permittivity ε′RT, it is found that the 0.60BNW–0.40PT has the lowest Curie temperature, which is about 152 °C and increasing to the highest Curie temperature 460 °C for 0.10BNW–0.90PT. The compositional dependence of the Curie temperature is almost linear with changing BNW content in the process from tetragonal phase to the rhombohedral region. The result is analogous to some ferroelectric systems such as Pb(Yb1/2Nb1/2)O3–PbTiO3 ceramics and crystals.31 However, the room-temperature dielectric constant ε′RT increases with the increase of BNW content. This is because ignoring the influence of the ionic radius difference, raising BNW content would lead to the increase of the sum of ionic polarizability, as a result, the dielectric constant would be enhanced.32

![[thin space (1/6-em)]](https://www.rsc.org/images/entities/char_2009.gif) δ for xBNW–(1 − x)PT ceramics: (a) 0.20BNW–0.80PT; (b) 0.30BNW–0.70PT; (c) 0.34BNW–0.64PT; (d) 0.36BNW–0.62PT.
δ for xBNW–(1 − x)PT ceramics: (a) 0.20BNW–0.80PT; (b) 0.30BNW–0.70PT; (c) 0.34BNW–0.64PT; (d) 0.36BNW–0.62PT.
![[thin space (1/6-em)]](https://www.rsc.org/images/entities/char_2009.gif) δ) and piezoelectric coefficient d33 for xBNW–(1 − x)PT ceramics
δ) and piezoelectric coefficient d33 for xBNW–(1 − x)PT ceramics
![[thin space (1/6-em)]](https://www.rsc.org/images/entities/char_2009.gif) δ (@RT)
δ (@RT)


