 Open Access Article
Creative Commons Attribution 3.0 Unported Licence
Mn2+ doped CdAl2O4 phosphors with new structure and special fluorescence properties: experimental and theoretical analysis†
Weiguang Rana,
Lili Wanga,
Qingzhi Liua,
Guangzeng Liubc,
Dan Qua,
Xiaohua Pana and
Jinsheng Shi *a
*a
aQingdao Agricultural University, Qingdao 266109, People's Republic of China. E-mail: jsshiqn@aliyun.com
bState Key Laboratory of Crystal Materials, Shandong University, Jinan 250100, People's Republic of China
cCollege of Chemistry and Chemical Engineering, Qilu Normal University, Jinan, 250013, PR China
First published on 21st March 2017
Abstract
Mn2+-activated CdAl2O4 phosphors with the new structure of space group R![[3 with combining macron]](https://www.rsc.org/images/entities/char_0033_0304.gif) (no. 148) have been prepared by a high-temperature solid-state reaction and their luminescence properties have been investigated in detail. The reduction of Mn4+ to Mn2+ in air atmosphere has been observed in CdAl2O4 powders for the first time. The structural properties including the phase purity and structural parameters were analyzed through Rietveld analysis. The typical transitions of Mn2+ ions in emission and excitation spectra were observed both in MnCO3 and MnO2 prepared CdAl2O4:0.01Mn2+ phosphors, which means that the luminescent centers of Mn2+ ions were from the Mn4+ ions which were reduced. Meanwhile, the energy band structures of CdAl2O4 and CdAl2O4:Mn2+ were measured with an ultraviolet-visible diffuse reflection spectroscopy (UV-vis DRS), the electronic structures were calculated using the plane-wave density functional theory (DFT). The Mn2+ activated CdAl2O4:Mn2+ phosphor prepared in air atmosphere is a potential blue-green emitting phosphor.
(no. 148) have been prepared by a high-temperature solid-state reaction and their luminescence properties have been investigated in detail. The reduction of Mn4+ to Mn2+ in air atmosphere has been observed in CdAl2O4 powders for the first time. The structural properties including the phase purity and structural parameters were analyzed through Rietveld analysis. The typical transitions of Mn2+ ions in emission and excitation spectra were observed both in MnCO3 and MnO2 prepared CdAl2O4:0.01Mn2+ phosphors, which means that the luminescent centers of Mn2+ ions were from the Mn4+ ions which were reduced. Meanwhile, the energy band structures of CdAl2O4 and CdAl2O4:Mn2+ were measured with an ultraviolet-visible diffuse reflection spectroscopy (UV-vis DRS), the electronic structures were calculated using the plane-wave density functional theory (DFT). The Mn2+ activated CdAl2O4:Mn2+ phosphor prepared in air atmosphere is a potential blue-green emitting phosphor.
1. Introduction
Phosphors prepared by the high-temperature solid-state reaction method have a high luminous intensity and good thermal stability.1 Therefore, the high-temperature solid-state reaction is the most used method for the preparation of phosphors. When the luminescence centers need to be prepared at a lower valence state, people usually add reducing atmosphere such as H2 into the reaction process. However, the introduction of reducing atmosphere not only improved the technological requirements and costs but also restricted the scope of applications. For example, when there exist some transition metal elements such as W, Mo, V, Cd, etc. which were easy to be reduced by reducing atmosphere in the host, there is no way to get low-valence luminescence centers. Therefore, reducing emitting ions to provide low-valence luminescence centers in an air atmosphere in the high-temperature solid-state reaction is still a research difficulty. At present, according to the reported literature, Eu3+ ions can be reduced to Eu2+ in an air atmosphere in some special crystal structure.2–7 Peng6 believe that it is closely related to the crystal structure and charge compensation.Mn2+ ions as a common non-rare earth luminescence centers have been widely used.8–10 The energy levels of Mn2+ ions are strongly affected by the lattice environment.9 The luminescence properties have a great difference in different host lattices which made Mn2+ be an ideal non-rare earth luminescent center. However, people usually use the high-temperature solid-state reaction method in a reducing atmosphere to obtain Mn2+ ions activated phosphors. It greatly limits the scope of application of Mn2+ ions.
In this paper, we firstly synthesized CdAl2O4:Mn2+ phosphors by standard high-temperature solid-state reaction in an air atmosphere. The phosphors were characterized by X-ray diffraction (XRD), photoluminescence (PL) studies and Fourier transform infrared spectroscopy (FTIR). And the crystallographic parameters were refined through Rietveld analysis. The reduction activity of CdAl2O4 host was carefully studied by changing the manganese source. The geometry optimization and electronic structure calculations were performed using the Cambridge Serial Total Energy Package (CASTEP) code.11 After analyzing the band structure and density of states, the emitting and energy transfer mechanism were detailly investigated. And the crystal field splitting parameter 10Dq was been calculated.
2. Synthesis and characterization
2.1 Sample synthesis
Samples of CdAl2O4 and CdAl2O4:Mn2+ were synthesized by the solid-state reaction method in an air atmosphere. The raw materials were CdO (99.99%), Al2O3 (99.99%), MnCO3 (99.99%) and MnO2 (99.99%). The starting materials were weighed according to the stoichiometric ratio and mixed with ethanol in agate container and ball milled with agate balls for 12 h. After milling, the mixed materials were dried in an oven at 60 °C for 24 h. The dried materials were put into the alumina crucible and calcined in a muffle furnace at 1200 °C for 3 h, and then the white powder phosphor was obtained. All samples were ground into a powder with an agate mortar and pestle for further analysis.2.2 Experimental methods
The powder diffraction data of CdAl2O4 and CdAl2O4:0.03Mn2+ for Rietveld analysis were collected at room temperature with a Bruker D8 ADVANCE powder diffractometer (Cu Kα1 radiation, λ = 0.15406 nm) and linear VANTEC detector. The step size of 2θ was 0.02°, and the counting time was 1 s per step. The Rietveld refinement was performed using the General Structure Analysis System (GSAS) program. Room-temperature photoluminescence emission (PL) and excitation (PLE) spectra were recorded using a Hitachi F-4600 spectrophotometer equipped with a 150 W xenon lamp as an excitation source. The luminescence decay curves were obtained from a FluoroLog-3-TCSPC. And the temperature-dependent luminescence properties were measured by a FluoroLog-3 spectrophotometer, which was combined with TAP-02 high-temperature fluorescence controller (Orient KOJI, Tianjin). With the crystal structure data, which were obtained by Rietveld refinement, DFT calculations on the trigonal CdAl2O4 host and the Mn2+ doped samples were carried out by using the CASTEP code.113. Results and discussion
3.1 Phase identification and morphology
The space group of CdAl2O4 in this paper is R![[3 with combining macron]](https://www.rsc.org/images/entities/char_0033_0304.gif) , which is different from the reported CdAl2O4 spinel structure with space group Fd
, which is different from the reported CdAl2O4 spinel structure with space group Fd![[3 with combining macron]](https://www.rsc.org/images/entities/char_0033_0304.gif) ms.12 The structure of CdAl2O4 in this paper has the same structure with Zn2SiO4, both of them have the similar crystal structure with β-Si3N4.13 Therefore, the structure model of CdAl2O4 in this paper is selected on Zn2SiO4. As shown in Fig. 1, compared with Zn2SiO4 (R
ms.12 The structure of CdAl2O4 in this paper has the same structure with Zn2SiO4, both of them have the similar crystal structure with β-Si3N4.13 Therefore, the structure model of CdAl2O4 in this paper is selected on Zn2SiO4. As shown in Fig. 1, compared with Zn2SiO4 (R![[3 with combining macron]](https://www.rsc.org/images/entities/char_0033_0304.gif) PDF# 37-1485), the prepared CdAl2O4 powder with space group R
PDF# 37-1485), the prepared CdAl2O4 powder with space group R![[3 with combining macron]](https://www.rsc.org/images/entities/char_0033_0304.gif) (PDF# 34-0071) has the similar position and intensity of diffraction peaks. The XRD pattern of the CdAl2O4 sample was defined by a Rietveld refinement implemented with the Zn2SiO4 (ICSD #67235) R
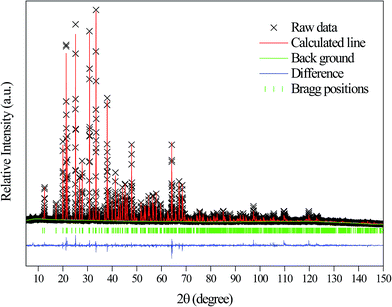
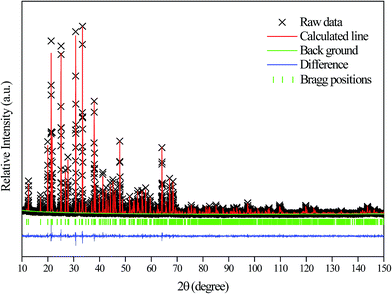
(PDF# 34-0071) has the similar position and intensity of diffraction peaks. The XRD pattern of the CdAl2O4 sample was defined by a Rietveld refinement implemented with the Zn2SiO4 (ICSD #67235) R![[3 with combining macron]](https://www.rsc.org/images/entities/char_0033_0304.gif) (148) structure model. The observed, calculated, background and the difference patterns of the XRD refinement of CdAl2O4 are shown in Fig. 2. The final refinement converged with weighted profiles of Rp = 6.03%, Rwp = 8.41% and χ2 = 2.624, which illustrates there is no detectable impurity phase observed in this obtained sample. As the crystallographic data of CdAl2O4 shown in Table 1, this compound exhibits a trigonal crystal system with the space group R
(148) structure model. The observed, calculated, background and the difference patterns of the XRD refinement of CdAl2O4 are shown in Fig. 2. The final refinement converged with weighted profiles of Rp = 6.03%, Rwp = 8.41% and χ2 = 2.624, which illustrates there is no detectable impurity phase observed in this obtained sample. As the crystallographic data of CdAl2O4 shown in Table 1, this compound exhibits a trigonal crystal system with the space group R![[3 with combining macron]](https://www.rsc.org/images/entities/char_0033_0304.gif) (no. 148), Z = 18, and the cell parameter is a = b = 14.2210 Å, c = 9.5733 Å, V = 1676.69 Å3. As shown in Fig. 2, the refinements were stable and gave low R-factors. And the refined structural parameters of CdAl2O4 are listed in Table 1. The optimized crystal structural parameters of CdAl2O4 after geometry optimization are listed in Table S1.† It can be seen that the results of Rietveld refinement are very similar to those of structure calculated after geometry optimization with CASTEP program. From the first principles calculation, to investigate the reasonableness of the CdAl2O4 structure, the phonon spectrum of CdAl2O4 was calculated after geometry optimization (see Fig. S1†). The absence of any imaginary frequency phonon modes proves the dynamical stability of the CdAl2O4 with R
(no. 148), Z = 18, and the cell parameter is a = b = 14.2210 Å, c = 9.5733 Å, V = 1676.69 Å3. As shown in Fig. 2, the refinements were stable and gave low R-factors. And the refined structural parameters of CdAl2O4 are listed in Table 1. The optimized crystal structural parameters of CdAl2O4 after geometry optimization are listed in Table S1.† It can be seen that the results of Rietveld refinement are very similar to those of structure calculated after geometry optimization with CASTEP program. From the first principles calculation, to investigate the reasonableness of the CdAl2O4 structure, the phonon spectrum of CdAl2O4 was calculated after geometry optimization (see Fig. S1†). The absence of any imaginary frequency phonon modes proves the dynamical stability of the CdAl2O4 with R![[3 with combining macron]](https://www.rsc.org/images/entities/char_0033_0304.gif) structure.
structure.
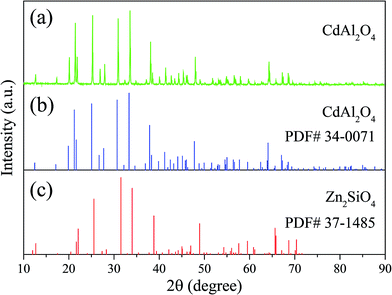 | ||
| Fig. 1 XRD patterns of (a) CdAl2O4 samples and standard card of (b) CdAl2O4 and (c) Zn2SiO4 powders. | ||
| Element symbol | Mult. Wyck. | x/a | y/b | z/c | U (Å2) |
|---|---|---|---|---|---|
a a = b = 14.2210, c = 9.5733, α = β = 90°, γ = 120°, V = 1676.69 Å3, space group R![[3 with combining macron]](https://www.rsc.org/images/entities/char_0033_0304.gif) , Rwp = 8.41%, Rexp = 6.03%, χ2 = 2.624. , Rwp = 8.41%, Rexp = 6.03%, χ2 = 2.624. |
|||||
| Cd1 | 18f | 0.2061 | 0.1835 | 0.2456 | 0.0261 |
| Al1 | 18f | 0.2072 | 0.1977 | 0.5818 | 0.0260 |
| Al2 | 18f | 0.2166 | 0.1970 | 0.9170 | 0.0229 |
| O1 | 18f | 0.3425 | 0.3469 | 0.2456 | 0.0147 |
| O2 | 18f | 0.2201 | 0.1110 | 0.0494 | 0.0221 |
| O3 | 18f | 0.2172 | 0.1210 | 0.4467 | 0.027 |
| O4 | 18f | 0.1935 | 0.1391 | 0.7514 | 0.0234 |
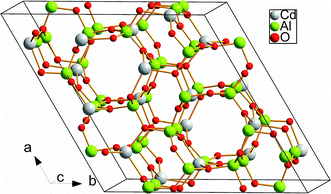
In the crystal structure of CdAl2O4 shown in Fig. 3, the Cd atoms occupy the 18f site coordinated by four O atoms to form CdO4 tetrahedron. Al atoms are occupied the 18f site in the center of AlO4 tetrahedron.
3.2 Luminescence properties and valence analysis of Mn ions
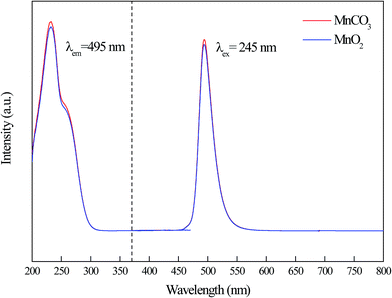
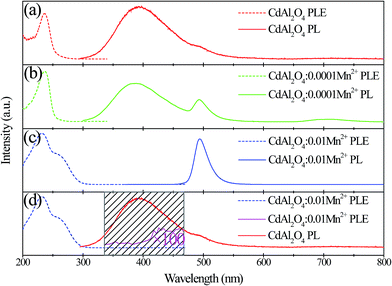
Fig. 4 shows the manganese source dependent PL and PLE spectra of Cd0.99Mn0.01Al2O4 phosphors. As seen from the PL and PLE spectra, their shape and intensity of fluorescence spectrum are very similar. The emission spectra just have one single emission peak at about 495 nm, which is consistent with the traditional Mn2+ emission.14–17 This indicates that whether using MnCO3 or MnO2, the phosphors prepared by high-temperature solid phase reaction method in air atmosphere have typical characteristic peaks of Mn2+ ions. CdAl2O4:0.01Mn2+ fluorescent material has a strong characteristic emission of Mn2+ ions when MnCO3 was added as manganese source. This indicates that Mn2+ ions were not oxidized in an air atmosphere in high-temperature solid-state reaction. In addition, we further investigated the luminescent properties of CdAl2O4:0.01Mn2+ phosphor with MnO2 as manganese source. Although the manganese source has only Mn4+ ions, the CdAl2O4:0.01Mn2+ phosphor still exhibits a strong characteristic emission of Mn2+ ions. It means that the luminescent centers of Mn2+ ions come from the Mn4+ ions which were reduced at high temperatures. Compared with the emission intensity of Cd0.99Mn0.01Al2O4 phosphor prepared by MnCO3, the emission intensity prepared by MnO2 was only reduced 2.6%. This could be a result of experimental errors. And there is a very strong reduction activity in the CdAl2O4 host. The Mn4+ ions were reduced almost entirely to Mn2+ in air atmosphere by a high-temperature solid-state reaction.The XPS test was employed to analyze the valence of Mn in CdAl2O4:Mn phosphors. The CdAl2O4:0.015Mn2+ phosphor which was prepared in air atmosphere by MnO2 was selected. Fig. S2(a)† displays the survey scan of CdAl2O4:Mn phosphors, where the principal peaks are corresponding to cadmium (Cd 3d), aluminum (Al 2s, Al 2p), carbon (C 1s) and oxygen (O 1s). The binding energy for the Mn 3s orbital of Mn2+ is not evident due to the low doping concentration. Therefore, we can't use the gap of two peaks in Mn 3s orbital to determine the valence of Mn. The XPS spectrum of the phosphor in 2p3/2 and 2p1/2 region of Mn is shown in Fig. S2(b).† The binding energy of 641 and 653 eV indicates that the Mn ion has +2 oxidation state. However, a principal peak at about 651 eV which belong to the binding energies of Cd 3p1/2 affects the judgment of the oxidation state of Mn. Therefore, the valence of the Mn is not clear from XPS, and it should be considered from the viewpoint of the fluorescence properties. As can be seen from Fig. 5, since CdAl2O4:Mn2+ fluorescent material exists only broadband emission at about 495 nm, which is consistent with Mn2+ ions fluorescence characteristics.18–20 And there is no typical linear emission peak of Mn4+ in the red-light region. Therefore, the valence of Mn element in CdAl2O4:0.015Mn2+ sample prepared by using MnO2 in air atmosphere is Mn2+.
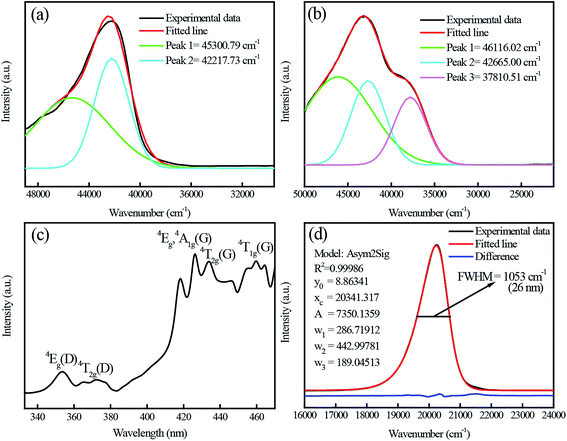
Fig. 5(a) shows the excitation spectrum of the pure CdAl2O4 sample monitored at about 395 nm. The asymmetric broadband at about 200–260 nm (40![[thin space (1/6-em)]](https://www.rsc.org/images/entities/char_2009.gif) 000–38
000–38![[thin space (1/6-em)]](https://www.rsc.org/images/entities/char_2009.gif) 460 cm−1) was decomposed into two components (220.8 nm and 236.9 nm) by Gaussian fitting. Fig. 5(b) shows the excitation spectrum of the CdAl2O4:0.01Mn2+ sample monitored at about 495 nm. Compared with Fig. 5(a), the excitation band at about 264.5 nm (37
460 cm−1) was decomposed into two components (220.8 nm and 236.9 nm) by Gaussian fitting. Fig. 5(b) shows the excitation spectrum of the CdAl2O4:0.01Mn2+ sample monitored at about 495 nm. Compared with Fig. 5(a), the excitation band at about 264.5 nm (37![[thin space (1/6-em)]](https://www.rsc.org/images/entities/char_2009.gif) 810.51 cm−1) can be assigned to the O–Mn charge transfer band of CdAl2O4:0.01Mn2+ phosphor. The Fig. 5(c) shows an enlarged view in the 330–470 nm range. The excitation spectrum presents many narrow transitions, associated to 6A1(6S)–4Eg(4D) (354 nm), 6A1(6S)–4Eg,4A1g(4G) (426 nm), 6A1(6S)–4T2g(4G) (436 nm), 6A1(6S)–4T1g(4G) (460 nm) electronic transitions. This indicates that although the Mn4+ were used as Mn source, it was eventually reduced to Mn2+ ions in CdAl2O4 phosphors via a high-temperature solid-state reaction method in an air atmosphere. Fig. 5(d) shows the emission spectrum of CdAl2O4:0.01Mn2+ phosphor. The maximum of the emission is at about 495 nm, with an FWHM of only 1053 cm−1 (26 nm). Moreover, the emission spectrum shows asymmetrical double sigmoidal (Asym2sig) fit (red) with R2 = 0.99986. The Asym2sig function is distributed as follows:
810.51 cm−1) can be assigned to the O–Mn charge transfer band of CdAl2O4:0.01Mn2+ phosphor. The Fig. 5(c) shows an enlarged view in the 330–470 nm range. The excitation spectrum presents many narrow transitions, associated to 6A1(6S)–4Eg(4D) (354 nm), 6A1(6S)–4Eg,4A1g(4G) (426 nm), 6A1(6S)–4T2g(4G) (436 nm), 6A1(6S)–4T1g(4G) (460 nm) electronic transitions. This indicates that although the Mn4+ were used as Mn source, it was eventually reduced to Mn2+ ions in CdAl2O4 phosphors via a high-temperature solid-state reaction method in an air atmosphere. Fig. 5(d) shows the emission spectrum of CdAl2O4:0.01Mn2+ phosphor. The maximum of the emission is at about 495 nm, with an FWHM of only 1053 cm−1 (26 nm). Moreover, the emission spectrum shows asymmetrical double sigmoidal (Asym2sig) fit (red) with R2 = 0.99986. The Asym2sig function is distributed as follows:
Mn2+ doping Zn2SiO4 have been extensively studied in the reported literature.19,22–24 Excitation and emission spectra of as prepared Zn2SiO4:0.01Mn2+ phosphor are shown in Fig. S3.† It can be seen that the excitation and emission spectra of CdAl2O4:Mn2+ are very similar to Zn2SiO4:Mn2+ phosphor. The typical excitation and emission peaks of Mn2+ were observed. There are three broad excitation bands and several sharp excitation peaks which positions are very close to CdAl2O4:Mn2+ in the excitation spectra. And both of them have only one emission band which was explained by the asymmetrical double sigmoidal (Asym2sig) function.
From Fig. 6, PL and PLE spectra of CdAl2O4, CdAl2O4:0.0001Mn2+ and CdAl2O4:0.01Mn2+ phosphors are presented in an immediate contrast. From Fig. 6(a), pure CdAl2O4 phosphor exhibits a strong blue-violet emission band with a maximum at about 395 nm. When monitoring at 395 nm, the excitation spectrum of CdAl2O4 exhibits a broad band in the range of 200–250 nm with the main peak at about 230 nm. As shown in Fig. 6(b), under the excitation of 230 nm, two broad emission bands centered at 395 nm and 495 nm were observed in CdAl2O4:0.0001Mn2+ phosphor. The new emission band centered at 495 nm is attributed to the typical 4T1g(4G)–6A1g(6S) transition of the Mn2+ ions. Fig. 6(c) shows the PL excitation and emission spectra of CdAl2O4:0.01Mn2+ phosphor. As depicted in Fig. 6(c), the excitation spectrum monitored at 495 nm of CdAl2O4:0.01Mn2+ sample primarily contains two broad bands centered at 230 nm and 260 nm. As for the emission spectrum, although the intensity of the blue emission is reduced compared to the pure CdAl2O4 phosphor, but the emission intensity of Mn2+ ions increased as large as several hundred times. The emission spectrum of CdAl2O4 host and excitation spectrum of CdAl2O4:0.01Mn2+ phosphor were shown in an immediate contrast in Fig. 6(d), the CdAl2O4 emission band overlaps with the Mn2+ excitation peaks in the range 330–460 nm, and the energy transfer was expected to occur from CdAl2O4 host to Mn2+ ions.
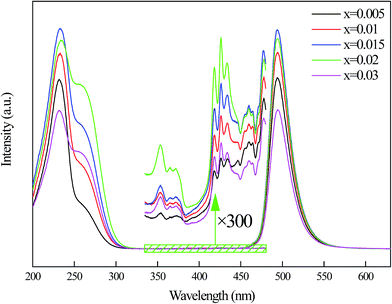
Fig. 7 shows the dependence of Mn2+ fluorescence intensity on concentrations. From the emission spectra, it can be seen that Mn2+ ions emission intensity of the blue-green emission band increase until the maximum x at 0.015. When the concentration of Mn2+ is further increased above 0.015, the emission intensity begins to decrease which can be explained by the appearance of concentration quenching effect at high Mn2+ content. The PL excitation spectra of the samples with different concentrations of Mn2+ ions were monitored at the emission wavelength of 495 nm. However, the optimal doping concentration of 230 nm excitation band is 0.015 while 264 nm excitation band and d–d transition bands are 0.02. This indicates that the origins of excitation bands are different.
To further investigate the characteristics of CdAl2O4:Mn2+ phosphor, the thermal quenching behavior was measured. Fig. S4† depicts the temperature-dependent emission spectra. As can be seen from the picture, with the increase of environment temperature, the emission intensity gradually decreased. The emission intensity of CdAl2O4:Mn2+ phosphor has reduced by about 50% when the temperature exceeds 100 °C. This indicates that CdAl2O4:Mn2+ phosphors are more suitable for low-temperature environment application.
Furthermore, the decay curves of CdAl2O4:0.015Mn2+ phosphor (λex = 266 nm and λem = 495 nm) at room temperature was shown in Fig. S5.† The red curves are a fit of the experimental data to a first order exponential decay equation which indicates that there is one kind of luminescence center homogeneously distributed in the phosphor. This means that Mn2+ occupies the Cd2+ 18f sites. The decay curves were well fitted by a first-order exponential decay equation
I(t) = I(0)![[thin space (1/6-em)]](https://www.rsc.org/images/entities/char_2009.gif) exp(−t/τ) exp(−t/τ) |
Fig. S6† exhibits the variation of the Commission International de L'Eclairage (CIE) chromaticity coordinates of the CdAl2O4, CdAl2O4:0.0001Mn2+ and CdAl2O4:0.015Mn2+ phosphors under excitation at 230 nm. The pure CdAl2O4 host emits blue-violet light with CIE coordinates of (0.1674, 0.1053). When the concentration of Mn2+ is increased to 0.015, a blue-green light can be obtained with CIE coordinates of (0.0704, 0.4800). The results indicate that the emission light can be modulated from blue-violet to blue-green with the increasing doping content of Mn2+ ions.
3.3 Sites occupation and structural analysis
It is well known that Mn2+ ions with similar ionic radius and charge could enter into the lattice by substituting Cd2+ sites. In order to further investigate the phase formation depending on the Mn2+ substitution of CdAl2O4 phosphors, XRD patterns for the selected samples with 3% substitution amount of Cd for CdAl2O4 were shown in Fig. 8.As shown in Fig. 8, all peaks were indexed by trigonal cell R![[3 with combining macron]](https://www.rsc.org/images/entities/char_0033_0304.gif) (no. 148) with parameters close to CdAl2O4 crystal structures. The calculated and observed patterns fit fairly well, and no impurity phases were detected. The refined structural parameters of CdAl2O4:0.03Mn2+ are listed in Table S2.† With Mn2+ ions occupied Cd (18f) sites, the cell volume of compound is smaller than cell volume of CdAl2O4, which is in accordance with smaller value of ion radii (IR) of Mn2+ (CN = 4, IR = 0.66 Å) in comparison with ion radii (IR) of Cd2+ (CN = 4, IR = 0.78 Å).
(no. 148) with parameters close to CdAl2O4 crystal structures. The calculated and observed patterns fit fairly well, and no impurity phases were detected. The refined structural parameters of CdAl2O4:0.03Mn2+ are listed in Table S2.† With Mn2+ ions occupied Cd (18f) sites, the cell volume of compound is smaller than cell volume of CdAl2O4, which is in accordance with smaller value of ion radii (IR) of Mn2+ (CN = 4, IR = 0.66 Å) in comparison with ion radii (IR) of Cd2+ (CN = 4, IR = 0.78 Å).
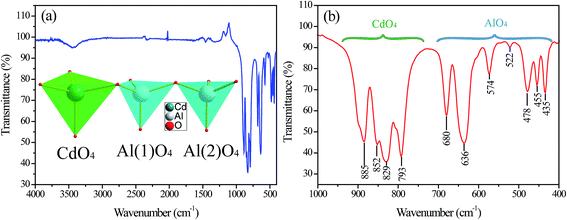
The Fourier transform infrared (FTIR) investigation was carried out to study the crystal structure. Fig. 9(a) and (b) shows the FTIR spectra of the as-prepared CdAl2O4 phosphor by high-temperature solid-state reaction method. The bands in the range 540–1000 cm−1 can be attributed to the asymmetric stretching vibrations of [AlO45−] tetrahedral units as described in Fig. 9(a). And the bands in range 540–400 cm−1 was assigned to asymmetric stretching vibrations of Cd–O bands of [CdO46−] tetrahedral units as shown in Fig. 9(a).
3.4 Measurement of optical bandgap
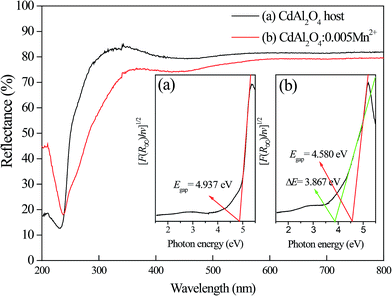
Fig. 10 gives the UV-vis absorption spectra of CdAl2O4 and CdAl2O4:0.015Mn2+ phosphors. It is observed that all of the samples have strong absorption of UV light. With the introduction of Mn2+, the abstraction band edge of the CdAl2O4:0.01Mn2+ phosphor redshifts obviously, which indicates that the introduced Mn2+ ions provide a new absorption band. Simultaneously, the optical band gap of CdAl2O4 phosphor has been shrinking significantly. The correlation between the absorption coefficient of semiconductor oxides and optical band gap Egap can be determined by the following equation:25,26| F(R∞)hν ∝ (hν − Egap)n |
where R∞ is the reflectivity of the sample, h is the Plank constant, ν is the photon energy, and n is determined by the transition type (n = 1/2, 2, 3/2 or 3 for allowed direct, allowed indirect, forbidden direct and forbidden indirect electronic transitions, respectively).
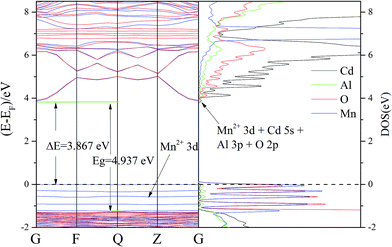
According to the calculation results of band structures from density functional theory (DFT) below (Fig. 11), CdAl2O4 and CdAl2O4:Mn2+ has been confirmed to be allowed indirect band gap materials, therefore, n = 2:
| hν − Egap ∝ (F(R∞)hν)1/2 |
Based on the results, we can get the Tauc-plots of samples as shown in the inset of Fig. 10. As can be seen from the picture, with the introduction of Mn2+ ions, the Mn2+ doped band gap of CdAl2O4 was shrinking from 4.937 eV into 4.580 eV. The absorption boundary of Mn2+ ions in CdAl2O4 host is 3.867 eV.
3.5 First principles calculation
We calculated the crystal structure optimization and electronic structure of the CdAl2O4 and CdAl2O4:Mn2+ phosphors by the first-principles method. The optimized crystal structural parameters of CdAl2O4 after geometry optimization are listed in Table S1.† The optimized crystal structural parameters were very close to the results of Rietveld refinements. To further verify the reasonableness of the structure we calculate the phonon spectrum of CdAl2O4 after geometry optimization (see Fig. S1†). As can be seen from the Fig. S1,† the absence of any imaginary frequency phonon modes proves the dynamical stability of the CdAl2O4 with R![[3 with combining macron]](https://www.rsc.org/images/entities/char_0033_0304.gif) structure.
structure.
The calculated band structures in Fig. 11 revealed that CdAl2O4:Mn2+ is indirect band gap materials (G point to Q point). It is well known that the CASTEP simulation results tend to underestimate the band-gap energies of the semiconductor materials due to the limited dimension of the atomic cluster. Therefore, a scissors operator of 2.235 eV was introduced to widen the gap to consistent with the measured optical band gap value (4.937 eV) of CdAl2O4:Mn2+ phosphors, which agrees well with the absorption edge (250 nm) of the CdAl2O4 without Mn2+ doping.
According to the orbital population analysis of CdAl2O4 phosphor from Fig. 12 (left), the top of the valence band is dominated by the 2p orbitals of O atoms, the interband transition could be ascribed to the charge transfer from the O-2p to Cd-4d orbitals, which basically corresponds to the excitation energy of CdAl2O4 host in Fig. 5(a). From Fig. 12 (right) it can be seen that with the Mn2+ doping, the valence band is dominated by the 2p orbitals of O and 3d orbitals of Mn2+ ions, the interband transition could be ascribed to the charge transfer from the O-2p to Cd-4d orbitals and from the Mn-3d to Mn-3d orbitals, which basically corresponds to the excitation energy of CdAl2O4:0.015Mn2+ sample in Fig. 5(b).
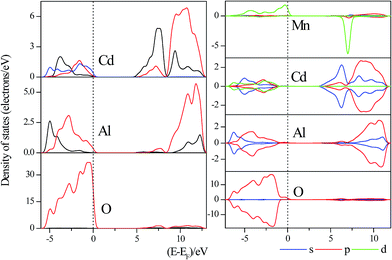 | ||
| Fig. 12 Partial DOSs of ideal CdAl2O4 (left) and CdAl2O4:Mn2+ (right) near the Fermi energy level. The Fermi energy is at zero. | ||
Herein, by combining the excitation spectra of CdAl2O4:Mn2+ phosphors with the parity selection rules and Sugano–Tanabe energy diagram, a detailed spectral analysis and the fitting of crystal field parameters were performed. The sharp bands in the excitation spectra centered at 353 nm (2.83 × 104 cm−1) and 426 nm (2.35 × 104 cm−1) can be attributed to the parity forbidden transitions of 4Eg(4D) → 6A1g(6S) and 4Eg(4G) → 6A1g(6S) which are Dq-independent, respectively. The vertical dashed line indicates the appropriate value of Δ/B (4.98), and the horizontal ones are used to compare the peaks of the absorption of Mn2+ to the energy states in the Tanabe–Sugano diagram in Fig. 13. With the assignment of 17B + 5C = E(4Eg(4D)) and 10B + 5C = E(4Eg(4G)) the Racah parameters B and C for the tetrahedrally coordinated Mn2+ were calculated to be B = 692.8 cm−1, C = 3307 cm−1, and γ = C/B = 4.77. Δ/B = 4.98 and Δo = 3450 cm−1. Since Mn2+ occupies the four-coordinated Cd2+ lattice in CdAl2O4, it is reported that ΔT for tetrahedral complexes is approximately 4/9 of Δo for an octahedral complex. Therefore, the crystal field splitting parameter 10Dq = ΔT = 4/9Δo = 1533 cm−1 of Mn2+ in CdAl2O4 were derived.
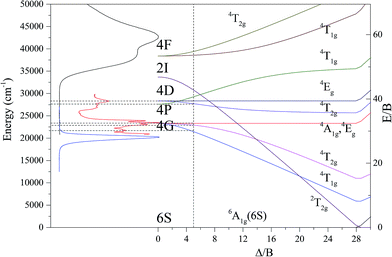 | ||
| Fig. 13 The excitation and emission spectra of CdAl2O4:0.02Mn2+ phosphors associated with the Tanabe–Sugano diagram. | ||
4. Conclusion
In conclusion, the structure of new CdAl2O4 material with space group R![[3 with combining macron]](https://www.rsc.org/images/entities/char_0033_0304.gif) was determined. Mn2+ ions activated blue-green emitting phosphors CdAl2O4:xMn2+ have also been successfully obtained by a conventional high-temperature solid-state reaction method in an air atmosphere. The typical transitions of Mn2+ ions in emission and excitation spectra were observed both in MnCO3 and MnO2 prepared CdAl2O4:0.01Mn2+ phosphors. CdAl2O4:Mn2+ fluorescent materials have a strong characteristic emission of Mn2+ ions when MnCO3 was added as manganese source. That is to say in the CdAl2O4 host, Mn2+ ions were not oxidized in the air atmosphere in high-temperature solid-state reaction. For MnO2 as manganese source, the CdAl2O4:Mn2+ phosphors still exhibit a strong characteristic emission of Mn2+ ions. This indicates that the luminescent centers of Mn2+ ions come from the Mn4+ ions which were reduced at high temperatures. The crystal field splitting parameter 10Dq was estimated to be 1533 cm−1. Although the valence of manganese source was different, their shape and intensities of emission and excitation spectra were very similar. When excited by ultraviolet light, the Mn2+ ions occupied Cd sites emitting strong blue-green luminescence.
was determined. Mn2+ ions activated blue-green emitting phosphors CdAl2O4:xMn2+ have also been successfully obtained by a conventional high-temperature solid-state reaction method in an air atmosphere. The typical transitions of Mn2+ ions in emission and excitation spectra were observed both in MnCO3 and MnO2 prepared CdAl2O4:0.01Mn2+ phosphors. CdAl2O4:Mn2+ fluorescent materials have a strong characteristic emission of Mn2+ ions when MnCO3 was added as manganese source. That is to say in the CdAl2O4 host, Mn2+ ions were not oxidized in the air atmosphere in high-temperature solid-state reaction. For MnO2 as manganese source, the CdAl2O4:Mn2+ phosphors still exhibit a strong characteristic emission of Mn2+ ions. This indicates that the luminescent centers of Mn2+ ions come from the Mn4+ ions which were reduced at high temperatures. The crystal field splitting parameter 10Dq was estimated to be 1533 cm−1. Although the valence of manganese source was different, their shape and intensities of emission and excitation spectra were very similar. When excited by ultraviolet light, the Mn2+ ions occupied Cd sites emitting strong blue-green luminescence.
Acknowledgements
This work was supported by Science and Technology Development Plan of Shandong Province, China (2014GNC110013) and National Natural Science Foundation for Young (No. 2130696).References
- Y. Pan, M. Wu and Q. Su, Comparative investigation on synthesis and photoluminescence of YAG: Ce phosphor, Mater. Sci. Eng., B, 2004, 106, 251–256 CrossRef.
- H. Xie, J. Lu, Y. Guan, Y. Huang, D. Wei and H. J. Seo, Abnormal Reduction, Eu3+ → Eu2+, and Defect Centers in Eu3+-Doped Pollucite, CsAlSi2O6, Prepared in an Oxidizing Atmosphere, Inorg. Chem., 2014, 53, 827–834 CrossRef CAS PubMed.
- J.-C. Zhang, Y.-Z. Long, H.-D. Zhang, B. Sun, W.-P. Han and X.-Y. Sun, Eu2+/Eu3+-emission-ratio-tunable CaZr(PO4)2:Eu phosphors synthesized in air atmosphere for potential white light-emitting deep UV LEDs, J. Mater. Chem. C, 2014, 2, 312–318 RSC.
- M. Peng, Z. Pei, G. Hong and Q. Su, Study on the reduction of Eu3+→Eu2+ in Sr4Al14O25: Eu prepared in air atmosphere, Chem. Phys. Lett., 2003, 371, 1–6 CrossRef CAS.
- M. Peng and G. Hong, Reduction from Eu3+ to Eu2+ in BaAl2O4: Eu phosphor prepared in an oxidizing atmosphere and luminescent properties of BaAl2O4: Eu, J. Lumin., 2007, 127, 735–740 CrossRef CAS.
- M. Peng, Z. Pei, G. Hong and Q. Su, The reduction of Eu3+ to Eu2+ in BaMgSiO4:Eu prepared in air and the luminescence of BaMgSiO4:Eu2+ phosphor, J. Mater. Chem., 2003, 13, 1202–1205 RSC.
- Z. Pei, Q. Zeng and Q. Su, The application and a substitution defect model for Eu3+→Eu2+ reduction in non-reducing atmospheres in borates containing BO4 anion groups, J. Phys. Chem. Solids, 2000, 61, 9–12 CrossRef CAS.
- W. Liu, Q. Lin, H. Li, K. Wu, I. Robel, J. M. Pietryga and V. I. Klimov, Mn2+-Doped Lead Halide Perovskite Nanocrystals with Dual-Color Emission Controlled by Halide Content, J. Am. Chem. Soc., 2016, 138, 14954–14961 CrossRef CAS PubMed.
- L. Wang, L. Tan, T. Hou and J. Shi, Investigation of change regularity of energy states of Mn2+ in halides, J. Lumin., 2013, 134, 319–324 CrossRef CAS.
- W.-R. Liu, C.-H. Huang, C.-W. Yeh, Y.-C. Chiu, Y.-T. Yeh and R.-S. Liu, Single-phased white-light-emitting KCaGd(PO4)2:Eu2+,Tb3+,Mn2+ phosphors for LED applications, RSC Adv., 2013, 3, 9023–9028 RSC.
- M. D. Segall, J. D. L. Philip, M. J. Probert, C. J. Pickard, P. J. Hasnip, S. J. Clark and M. C. Payne, First-principles simulation: ideas, illustrations and the CASTEP code, J. Phys.: Condens. Matter, 2002, 14, 2717 CrossRef CAS.
- H. Hahn, G. Frank, W. Klingler, A. D. Störger and G. Störger, Untersuchungen über ternäre chalkogenide. VI. Über Ternäre chalkogenide des aluminiums, galliums und indiums mit zink, cadmium und Quecksilber, Z. Anorg. Allg. Chem., 1955, 279, 241–270 CrossRef CAS.
- G. A. Slack and I. C. Huseby, Thermal Grüneisen parameters of CdAl2O4, β–Si3N4, and other phenacite-type compounds, J. Appl. Phys., 1982, 53, 6817–6822 CrossRef CAS.
- Y. F. Liu, X. Zhang, Z. D. Hao, Y. S. Luo, X. J. Wang and J. H. Zhang, Generating yellow and red emissions by co-doping Mn2+ to substitute for Ca2+ and Sc3+ sites in Ca3Sc2Si3O12:Ce3+ green emitting phosphor for white LED applications, J. Mater. Chem., 2011, 21, 16379–16384 RSC.
- L. Wang, Z. Hou, Z. Quan, H. Lian, P. Yang and J. Lin, Preparation and luminescence properties of Mn2+-doped ZnGa2O4 nanofibers via electrospinning process, Mater. Res. Bull., 2009, 44, 1978–1983 CrossRef CAS.
- S. G. Kim, S. H. Lee, N. H. Park, H. L. Park, K. W. Min, S. I. Mho, T. W. Kim and Y. H. Hwang, Mn2+ site behaviors in CdxZn1−xGa2O4 and SrxBa1−xAl12O19 green phosphors, Solid State Commun., 1999, 110, 515–518 CrossRef CAS.
- M. Shang, G. Li, D. Yang, X. Kang, C. Peng, Z. Cheng and J. Lin, (Zn, Mg)2GeO4:Mn2+ submicrorods as promising green phosphors for field emission displays: hydrothermal synthesis and luminescence properties, Dalton Trans., 2011, 40, 9379–9387 RSC.
- Z. Wang, L. Feng, J. Zhang, Z. Ci, Z. Zhang and Y. Wang, Nonequivalent Substitution and Charge-Induced Emitter-Migration Design of Tuning Spectral and Duration Properties of NaCa2GeO4F: Mn2+ Persistent Luminescent Phosphor, Inorg. Chem., 2016, 55, 7988–7996 CrossRef CAS PubMed.
- R. Ye, G. Jia, D. Deng, Y. Hua, Z. Cui, S. Zhao, L. Huang, H. Wang, C. Li and S. Xu, Controllable Synthesis and Tunable Colors of α- and β-Zn2SiO4:Mn2+ Nanocrystals for UV and Blue Chip Excited White LEDs, J. Phys. Chem. C, 2011, 115, 10851–10858 CAS.
- L. Hu, Q. Wang, X. Wang, Y. Li, Y. Wang and X. Peng, Photoluminescence and cathodoluminescence properties of Na2MgGeO4:Mn2+ green phosphors, RSC Adv., 2015, 5, 104708–104714 RSC.
- L. Changshi, Prediction of the photoluminescence of In0.53Ga0.47As/InP irradiated by 1 MeV electron, Nucl. Instrum. Methods Phys. Res., Sect. B, 2017, 391, 64–68 CrossRef.
- K. Yoshizawa, H. Kato and M. Kakihana, Synthesis of Zn2SiO4:Mn2+ by homogeneous precipitation using propylene glycol-modified silane, J. Mater. Chem., 2012, 22, 17272–17277 RSC.
- N. Taghavinia, G. Lerondel, H. Makino, A. Parisini, A. Yamamoto, T. Yao, Y. Kawazoe and T. Goto, Activation of porous silicon layers using Zn2SiO4: Mn2+ phosphor particles, J. Lumin., 2002, 96, 171–175 CrossRef CAS.
- C. Bertail, S. Maron, V. Buissette, T. Le Mercier, T. Gacoin and J.-P. Boilot, Structural and Photoluminescent Properties of Zn2SiO4:Mn2+ Nanoparticles Prepared by a Protected Annealing Process, Chem. Mater., 2011, 23, 2961–2967 CrossRef CAS.
- A. E. Morales, E. S. Mora and U. Pal, Use of diffuse reflectance spectroscopy for optical characterization of un-supported nanostructures, Rev. Mex. Fis. S, 2007, 53, 18–22 CAS.
- D. L. Wood and J. Tauc, Weak Absorption Tails in Amorphous Semiconductors, Phys. Rev. B: Solid State, 1972, 5, 3144–3151 CrossRef.
Footnote |
| † Electronic supplementary information (ESI) available. CCDC 1536655. For ESI and crystallographic data in CIF or other electronic format see DOI: 10.1039/c7ra01623a |
| This journal is © The Royal Society of Chemistry 2017 |

