DOI:
10.1039/C7RA01077J
(Paper)
RSC Adv., 2017,
7, 17599-17611
A wheat straw cellulose based semi-IPN hydrogel reactor for metal nanoparticles preparation and catalytic reduction of 4-nitrophenol
Received
24th January 2017
, Accepted 15th March 2017
First published on 22nd March 2017
Abstract
A wheat straw cellulose-g-poly(acrylic acid)/poly(vinyl alcohol) semi-IPN hydrogel (WSC-g-PAA/PVA) was synthesized. Copper and nickel nanoparticles were prepared in situ inside the above hydrogel and then applied as a catalyst to reduce 4-nitrophenol (4-NP). Scanning electron microscopy (SEM), energy dispersion spectrum (EDS), transmission electron microscopy (TEM), Fourier transform infrared spectroscopy (FTIR), thermal gravimetric analysis (TGA) and diffraction analysis (XRD) were employed to characterize the hydrogel–nanometal composite. The operation parameters on reduction of 4-NP were optimized by using the well-known response surface methodology (RSM) based on Box–Behnken design (BBD). Three experimental parameters including reaction temperature, the amount of hydrogel–M (metal) and the amount of NaBH4 on the 4-NP reduction were evaluated. The optimal values of the operation parameters under the related constraint conditions were obtained at 30 °C with 0.07 g of catalyst and 0.07 g of NaBH4 for hydrogel–Cu, and at 30 °C with 0.08 g of catalyst and 0.12 g of NaBH4 for hydrogel–Ni. It was found that the activation energies were 17.30 kJ mol−1 and 19.48 kJ mol−1 for hydrogel–Cu and hydrogel–Ni, respectively, by the analysis of thermodynamics of the reduction reaction. According to the 5 repetitive uses, hydrogel–Cu possessed 98% activity and hydrogel–Ni had 97% activity. And, after being stored for 30 days, both composites retained 70% activity.
1. Introduction
Nitroaromatic compounds are toxic organic pollutants and are widely produced as intermediates or by-products from dyes, agrochemicals, pharmaceuticals and so on.1–3 They can cause serious environmental and ecological problems. Among them, 4-nitrophenol (4-NP), the phenol derivatives, is a primary pollutant due to its high toxicity, stability and resistance to biodegradation.4,5 Many methods for 4-nitrophenol treatment have been developed including the traditional biological and chemical method, electrochemical technique, physical adsorption and so on.6–9 But the low degradation rate is the major disadvantage to treating non-degradable organic contaminants. Converting 4-NP to the available aromatic amines 4-aminophenol (or p-aminophenol: 4-AP) has significance. 4-AP has been applied to many industries and it is traditionally obtained by the reduction of 4-NP. For this purpose, metallic nanoparticles including Pd, Co, Au, Ni, Ag and so on are utilized as catalysts to reduction of 4-nitrophenol.10–14
However, the major problem in the practical use of metallic nanoparticles is that the severe aggregation of catalytic process lead to the decline of the degradation of performance in the reduction reaction.15 To overcome the shortage, some carriers were utilized to prepare metal nanoparticles such as resins and zeolites.16,17 Among them, in virtue of the soft, elastic and flexible natural property, hydrogels have received intensive attention. Hydrogel is a hydrophilic polymer with three-dimensional (3D) network structure. The hydrophilicity of the network is attributed to the hydrophilic groups, such as –COOH, –OH, –NH2, –CONH2, SO3OH and –CONH–, which are introduced into the hydrogel by cross-linking.18 Due to the hydrophilic nature of activity groups, hydrogel became an excellent template material for metal nanoparticle preparation.
Some natural macromolecules, such as cellulose, protein, starch, have been applied to prepare hydrogels. Among them, cellulose based hydrogels has more advantages as green materials due to the biodegradability and low cost.19 And the interactions between the carriers and metal nanoparticles were enhanced due to the various functionalities and porosities in cellulose hydrogels. The gel strength is also vital for the catalytic reduction of various organic pollutants with hydrogel as a reactor. Thus, intensive research effort has been devoted to the fabrication of cellulose based hydrogels. Semi-interpenetrating polymer network (semi-IPN) was a high performance material and it was composed by penetration on a molecular scale of polymer networks (the polymer was synthesized by crosslinking) with some linear or branched macromolecules.20 There is no chemical band between the two components of the semi-IPN, each of which possesses respective properties. So, semi-IPN shows better properties than either of the polymer alone. Recently, we have reported the preparation of the smart cellulose based semi-IPN hydrogel by wheat straw, i.e. cellulose-g-poly(acrylic acid)/poly(vinyl alcohol) semi-IPN hydrogel (WSC-g-PAA/PVA), which possessed good gel mechanical strength and swelling capacity, presented excellent properties in water retention and metal ions adsorption and separation.21–23 So, in this study, we use wheat straw cellulose as skeleton to prepared three-dimensional network structure (hydrogel). The hydrogel worked as a carrier to fix metal nanoparticles and the hydrogel–M (M: metal (Cu or Ni)) composites was applied to reduce 4-NP to 4-AP. During the entire process of experiment, we have made good use of waste material, recycling the metal ions from aqueous solution and converting 4-NP (toxic organic pollutant) to available 4-AP.
In the reduction experiments, the reduction of 4-NP could be influenced by multiple reaction conditions. The traditional optimization experiment is time-consuming and expensive and does not consider the interactions between the factors. As a statistical-based analytical technique, response surface methodology (RSM) has been applied successfully to explain the interaction between reaction parameters. Compared with other designs of RSM, Box–Behnken design (BBD) is the most frequently employed and offers some advantages such as reducing the study time, operating at a high efficiency and predicting results close to the actual experimental data.24 Thus, in the present work, a BBD was applied to determine the optimum 4-NP reduction performance, and also to explain the relationships between 4-NP reduction and three pertinent parameters, namely, reaction temperature, the amount of hydrogel–M composite and the amount of NaBH4.
2. Experimental
2.1 Materials
Acrylic acid (AA), poly(vinyl alcohol) (PVA), potassium hydroxide (KOH), sodium sulfite (Na2SO3), ammonium cerium nitrate ((NH4)2Ce(NO3)6), potassium persulfate (K2S2O8), N,N′-methylenebisacrylamide (MBA), 4-nitrophenol (4-NP), NaBH4, Cu(NO3)2·3H2O and Ni(NO3)2·6H2O were of analytical grade and purchased from Kemiou Chemical Regent factor, Tianjin, China and wheat straw was gained from Liaocheng, China.
2.2 Hydrogel synthesis
The preparation method of crosslinking WSC-g-PAA/PVA hydrogel has been reported earlier.25 In brief, 1.0 g WSC with K2S2O8 and (NH4)2Ce(NO3)6 were simultaneously added into three-necked flask installed with an electric stirrer and placed in a water bath keeping temperature at 50 °C. After 15 min, Na2SO3 and a mixture (AA and KOH) were slowly added into the above solution. After 15 min, PVA was mixed into the flask, after 45 min, MBA as crosslinker was added and reaction sustained for 4 h. The wet sample was obtained and dried at 75 °C. Then, the samples were crushed and sieved through a 20 to 40 mesh for further use.
2.3 Preparation of metal nanoparticles in WSC-g-PAA/PVA semi-IPNs hydrogel
100 mg dried WSC-g-PAA/PVA hydrogel was added into 50 mL of 0.05 M metal solutions (Cu(II) or Ni(II)) and the adsorption experiment was conducted in a constant temperature incubator shaker BPN-25HL at 25 °C for 4 h. The hydrogels of containing metal ions were shifted into distilled water for 2 h to remove unbound metal ions from the above hydrogel. Then, the loaded hydrogel were moved into NaBH4 (0.1 M 50 mL) solution for 2 h until completed reduction of metal ions to metal nanoparticles in situ and then were washed with DW over night. The obtained hydrogel–nanometal composite was named as hydrogel–M (M: Cu or Ni). The amount of metal nanoparticle embodied in the hydrogel was determined as followed: 0.1 g hydrogel–M was placed into 100 mL 5 M HCl to elute the metal of adsorption completely; then the concentration of Cu(II) or Ni(II) was determined by Atomic Absorption Spectroscopy (AAS) on TAS-990 instrument. The experimental result suggested 1 g hydrogel–M contained 177.0 mg copper and 156.1 mg nickel, respectively.
2.4 Characterization
The surface morphology of sample was obtained in a SEM instrument (FEI quanta feg 250) and the elemental components were examined by EDS. The thermal gravimetric analysis (TGA) was measured using a TGA instrument (SHI-MADZU, TGA-50) by heating the sample between 25 °C and 600 °C with the rate of 10 °C min−1 under nitrogen condition. X-ray diffraction (XRD) was obtained from an Empyrean XRD instrument (D8 ADVANCE). TEM was performed from a JEM 2100 instrument. The FTIR was acquired from a NEXUS-470 spectrometer.
2.5 Reduction of 4-NP catalyzed by hydrogel–M
200 mL 50 mg L−1 4-NP containing certain NaBH4 was prepared and placed in a 500 mL beaker. An appropriate dosage of hydrogel–M composite was added into this solution as a catalyst system in the generation of active hydrogen atoms in hydrolysis of NaBH4 and the 4-NP was reduced to 4-AP by hydrogen atoms. To determine the reduction rate of 4-NP, 0.5 mL sample was taken from the beaker every 5 min; then the sample was diluted to a suitable concentration to detect the amount of residual 4-NP at 400 nm absorbance value in a UV-Vis spectrometer. To assess the effect of temperature, hydrogel–M dosage and the amount of NaBH4 on the conversion of 4-NP to 4-AP, the reduction reactions were carried out at different temperatures (30, 40, 50, and 60 °C), different dosage of hydrogel–M (0.05, 0.10, 0.15, 0.20 g) and different amount of NaBH4 (0.05, 0.10, 0.15, 0.20 g) respectively.
To investigate the reusability of the catalyst, the same hydrogel–M was utilized five times consecutively for the reduction reactions and washed with DW before next use. The storage capacity of the catalyst was determined by keeping the hydrogel–M composite in a 50 mL closed container with distilled water at 25 °C.
2.6 Experimental design by BBD
The experiment could be divided into two parts. In the first part, a series of single factor experiments were performed with the purpose of getting the best value range of independent variables for the second part. Three experimental parameters (i.e. temperature, the amount of hydrogel–M and the amount of NaBH4) as independent variables were considered with reduction rate as dependent variable. Then, according to the result of first part, multifactor interaction experiment was designed and carried out by BBD. Reduction rate as response value, the three independent variables were: temperature (°C), the amount of hydrogel–M (g) and the amount of NaBH4 (g). From the first part of experiment, we found the catalytic efficiency of hydrogel–Cu was better than that of hydrogel–Ni in the same condition and the value range of each independent variable was different between them. The values of different variables were shown in Table 1 and 17 groups of experiments were designed and shown in Tables 2 and 3. A second-order model in the form of quadratic polynomial equation was used to describe response value.| |
 | (1) |
where Y was the predict of response value (the reduction rate of 4-NP); α0 was constant coefficient; αi, αii and αij were regression coefficient; xi and xj were the independent variables.
Table 1 Experimental range and level of independent variables for reduction 4-NP by hydrogel–Cu and hydrogel–Ni as catalyst
| Independent variable x |
Range and level |
| Hydrogel–Cu |
Hydrogel–Ni |
| −1 |
0 |
1 |
−1 |
0 |
1 |
| x1; temperature (°C) |
30 |
45 |
60 |
30 |
45 |
60 |
| x2; catalyst amounts (g) |
0.01 |
0.08 |
0.15 |
0.05 |
0.13 |
0.20 |
| x3; NaBH4 (g) |
0.05 |
0.10 |
0.15 |
0.05 |
0.13 |
0.20 |
Table 2 Experimental results and predictive values by hydrogel–Cu as catalyst
| Run |
Experimental conditions |
4-NP reduction rate (%) |
| x1 T |
x2 hydrogel–Cu |
x3 NaBH4 |
Experimental |
Predictive |
| 1 |
45(0) |
0.08(0) |
0.10(0) |
99.46 |
99.41 |
| 2 |
45(0) |
0.08(0) |
0.10(0) |
98.65 |
99.41 |
| 3 |
45(0) |
0.15(+1) |
0.15(+1) |
98.26 |
98.34 |
| 4 |
60(+1) |
0.08(0) |
0.05(−1) |
73.79 |
73.19 |
| 5 |
45(0) |
0.01(−1) |
0.15(+1) |
90.59 |
89.67 |
| 6 |
60(+1) |
0.15(+1) |
0.10(0) |
98.74 |
98.42 |
| 7 |
45(0) |
0.08(0) |
0.10(0) |
99.74 |
99.41 |
| 8 |
30(−1) |
0.15(+1) |
0.10(0) |
99.19 |
98.51 |
| 9 |
45(0) |
0.08(0) |
0.10(0) |
99.74 |
99.41 |
| 10 |
45(0) |
0.15(+1) |
0.05(−1) |
99.86 |
100.78 |
| 11 |
30(−1) |
0.01(−1) |
0.10(0) |
54.31 |
54.63 |
| 12 |
60(+1) |
0.01(−1) |
0.10(0) |
59.45 |
60.13 |
| 13 |
30(−1) |
0.08(0) |
0.15(+1) |
99.87 |
100.47 |
| 14 |
45(0) |
0.01(−1) |
0.05(−1) |
27.36 |
27.28 |
| 15 |
60(+1) |
0.08(0) |
0.15(+1) |
99.33 |
99.58 |
| 16 |
45(0) |
0.08(0) |
0.10(0) |
99.46 |
99.41 |
| 17 |
30(−1) |
0.08(0) |
0.05(−1) |
67.15 |
66.91 |
Table 3 Experimental results and predictive values by hydrogel–Ni as catalyst
| Run |
Experimental conditions |
4-NP reduction rate (%) |
| x1 T |
x2 hydrogel–Ni |
x3 NaBH4 |
Experimental |
Predictive |
| 1 |
30(−1) |
0.13(0) |
0.20(+1) |
99.06 |
100.75 |
| 2 |
45(0) |
0.20(+1) |
0.05(−1) |
97.30 |
98.12 |
| 3 |
45(0) |
0.13(0) |
0.13(0) |
96.65 |
95.95 |
| 4 |
30(−1) |
0.05(−1) |
0.13(0) |
85.00 |
83.38 |
| 5 |
60(+1) |
0.13(0) |
0.20(+1) |
95.18 |
95.92 |
| 6 |
60(+1) |
0.05(−1) |
0.13(0) |
93.92 |
93.25 |
| 7 |
45(0) |
0.05(−1) |
0.20(+1) |
98.92 |
98.86 |
| 8 |
30(−1) |
0.13(0) |
0.05(−1) |
79.62 |
78.89 |
| 9 |
45(0) |
0.05(−1) |
0.05(−1) |
70.83 |
73.19 |
| 10 |
45(0) |
0.13(0) |
0.13(0) |
96.85 |
95.95 |
| 11 |
60(+1) |
0.20(+1) |
0.13(0) |
97.30 |
97.37 |
| 12 |
60(+1) |
0.13(0) |
0.05(−1) |
95.14 |
93.45 |
| 13 |
45(0) |
0.13(0) |
0.13(0) |
92.03 |
95.95 |
| 14 |
30(−1) |
0.20(+1) |
0.13(0) |
98.38 |
99.05 |
| 15 |
45(0) |
0.13(0) |
0.13(0) |
96.76 |
95.95 |
| 16 |
45(0) |
0.13(0) |
0.13(0) |
97.44 |
95.95 |
| 17 |
45(0) |
0.20(+1) |
0.20(+1) |
98.38 |
96.02 |
3. Results and discussion
3.1 Characterization
The surface morphologies of WSC-g-PAA/PVA, WSC-g-PAA/PVA–Cu and WSC-g-PAA/PVA–Ni were shown in Fig. 1. It can be clearly observed that the WSC-g-PAA/PVA hydrogel (a) has a densely reticulate structure. The images of Fig. 1(b) and (c) indicated that WSC-g-PAA/PVA–Cu and WSC-g-PAA/PVA–Ni had spherical morphology about 20–30 nm. From the images, it proved that Cu and Ni nanoparticles have been prepared inside hydrogel. In addition, the EDS spectrum also showed that the Cu and Ni nanoparticles were dispersed on the surface of the hydrogel (Fig. 2).
 |
| | Fig. 1 SEM images of WSC-g-PAA/PVA hydrogel (a), WSC-g-PAA/PVA–Cu hydrogel (b) and WSC-g-PAA/PVA–Ni hydrogel (c). | |
 |
| | Fig. 2 EDS diagrams of WSC-g-PAA/PVA–Cu hydrogel (a)–(c) and WSC-g-PAA/PVA–Ni hydrogel (d)–(f). | |
The TGA and DSC curves of WSC-g-PAA/PVA, WSC-g-PAA/PVA–Cu and WSC-g-PAA/PVA–Ni were shown in Fig. 3. As can be seen from the chart, the pyrolysis process of WSC-g-PAA/PVA showed two stages. The first weight loss of 26.22% before 374 °C was due to the removal of the free water and structural water, the scission of the major and branched chains of polymer. A further weight loss of 22.09% from 374 °C to 522 °C was attributed to the final decomposition of the gels. For hydrogels which contained metal nanoparticle, the pyrolysis processes were both divided into two stages but more thermally stabilized compared with bare hydrogels (with no metal nanoparticle embedded). For WSC-g-PAA/PVA–Cu, the weight loss of 35.45% occurred at the first stage from 23 °C to 450 °C. This may be due to the removal of the free water, structural water and the scissions of C–O and C–C bonds in the polymer which transformed into CO, CO2 and H2O. The second degradation with 2.85% until 593 °C was due to the continued decomposition of the coke structures. For WSC-g-PAA/PVA–Ni, the pyrolysis processes also presented the similar two stages with the weight loss of 34.61% (19–447 °C), and 3.28% (447–600 °C), respectively. Thus, the existence of metal nanoparticles within hydrogel provided fewer amounts of degradations with higher thermal stability than the bare hydrogel.
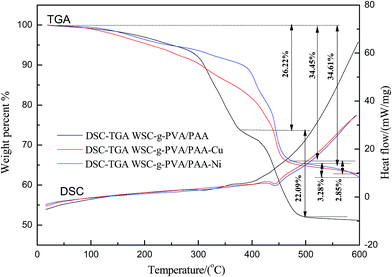 |
| | Fig. 3 TGA and DSC diagrams of WSC-g-PAA/PVA hydrogel, WSC-g-PAA/PVA–Cu hydrogel and WSC-g-PAA/PVA–Ni hydrogel. | |
The FTIR spectra of WSC-g-PAA/PVA, WSC-g-PAA/PVA–Cu/Ni were shown in Fig. 4. A broad absorption band at 3460 cm−1 in Fig. 2(a), 3427 cm−1 in Fig. 2(b) and 3398 cm−1 in Fig. 2(c) corresponding to the stretching vibration of hydroxyl (–OH) of PVA chains implied that the hydroxyl groups didn't participate in the grafting reaction.26 A peak observed at 510 cm−1 due to the vibration of C–N–OH demonstrated that a graft copolymerization process occurred between AA and WSC during the synthesis process of hydrogel; and the peak performed a blue-shift in the curves of WSC–PAA/PVA–Cu hydrogel (519 cm−1) and WSC–PAA/PVA–Ni hydrogel (515 cm−1), respectively, attributed to the interaction between metal (Cu or Ni) nanoparticles and hydrogel networks. In the FTIR spectra, WSC-g-PAA/PVA, WSC–PAA/PVA–Cu and WSC–PAA/PVA–Ni exhibited similar peaks for the asymmetric stretching vibration of methylene (–CH2) at 2934 cm−1, 2928 cm−1 and 2948 cm−1,27 respectively, accounting for the occurrence of crosslinking reaction. The peaks observed at 1573 cm−1 and 1396 cm−1 in WSC-g-PAA/PVA hydrogel respectively attributed to the asymmetric stretching vibration and symmetric stretching vibration of COO− groups that were transformed from –COOH groups in AA.28 But the relevant peaks in WSC-g-PAA/PVA–Cu hydrogel (Fig. 2(b)) and WSC-g-PAA/PVA–Ni hydrogel (Fig. 2(c)) had slight red-shift (1558 cm−1 and 1399 cm−1 in (b); 1561 cm−1 and 1409 cm−1 in (c)) indicating the coordination of COO− and Cu2+ (Ni2+). And the peaks became stronger originating from the infrared absorption of copper (nickel) metal nanoparticles, which may generate a change in photoelectric characteristics of the hydrogel surface.29 The band of C–OH at 1052 cm−1 (stretching vibration of C–OH in WSC (Fig. 2(a)) shifted to 1166 cm−1 (Fig. 2(b)) and 1167 cm−1 (Fig. 2(c)) and the peaks had blue-shift implying that the groups were more stable because of addition of metal nanoparticles (Cu or Ni) into WSC-g-PAA/PVA network.
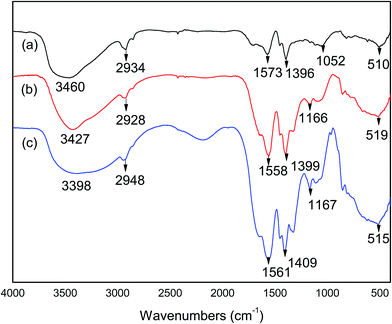 |
| | Fig. 4 FTIR of WSC-g-PAA/PVA hydrogel (a), WSC-g-PAA/PVA–Cu hydrogel (b) and WSC-g-PAA/PVA–Ni hydrogel (c). | |
The X-ray diffraction (XRD) analysis of WSC-g-PAA/PVA and WSC-g-PAA/PVA–Cu/Ni were shown in Fig. 5. There exit no apparent peaks in the XRD image of WSC-g-PAA/PVA indicating no crystal structure in the gel. But for metal nanoparticles embedded hydrogels, three strong peaks were observed at 43.67°, 50.71° and 74.14° in WSC-g-PAA/PVA–Cu corresponding to metal Cu (111), Cu (200) and Cu (220), and 44.65°, 51.71° and 78.07° in the WSC-g-PAA/PVA–Ni consistent with metal Ni (111), Ni (200) and Ni (220), respectively,30,31 which all verified crystallinity of the nanoparticles. Moreover, there exited no characteristic peaks of copper (or nickel) oxides in the XRD images, indicating the fairly stability against oxidation of the metal nanoparticles due to the presence of the hydrogel capping network. Furthermore, the existence of metal nanoparticles was further evidenced by TEM images shown in Fig. 6. It is clearly observed that the Cu/Ni nanoparticles were dispersed inside the hydrogel uniformly with a diameter of 20–30 nm. From the selected area electron diffraction patterns (SAED), the images were composed of a series of concentric circles. These demonstrated that a large number of crystal metal particles existed inside the hydrogel.
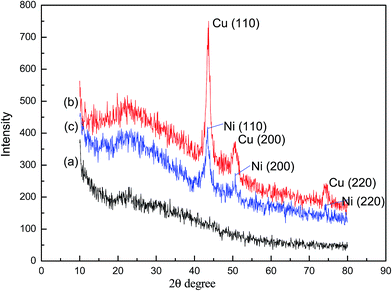 |
| | Fig. 5 XRD of WSC-g-PAA/PVA hydrogel (a), WSC-g-PAA/PVA–Cu hydrogel (b) and WSC-g-PAA/PVA–Ni hydrogel (c). | |
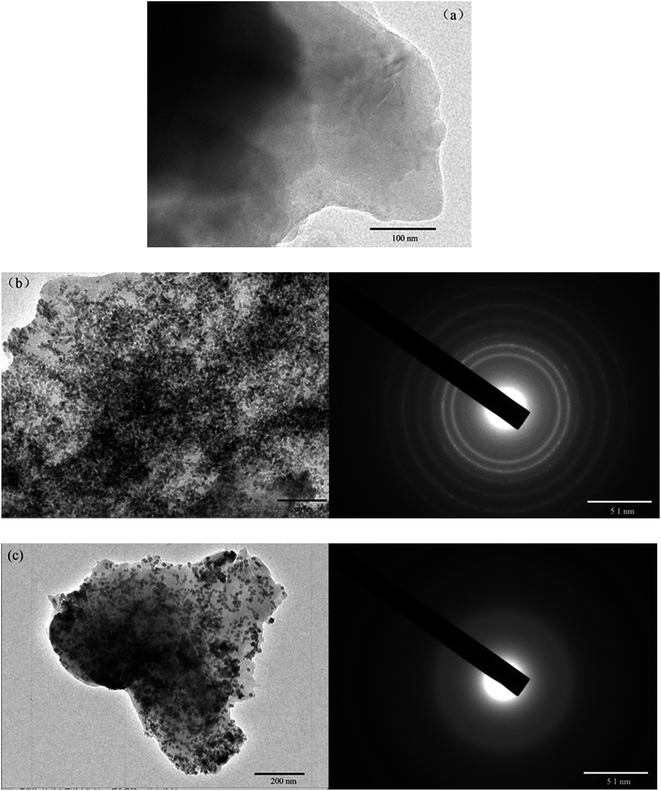 |
| | Fig. 6 TEM images of WSC-g-PAA/PVA hydrogel (a), WSC-g-PAA/PVA–Cu hydrogel (b) and WSC-g-PAA/PVA–Ni hydrogel (c). | |
3.2 Catalytic reduction of 4-NP
As is known to all, a series of noble metal can be applied as catalyst to reduce 4-NP. However, the bare metal nanoparticles have severe aggregation during catalytic process. In virtue of this constraint, the WSC-g-PVA/PAA hydrogel was prepared as a carrier. As shown in Fig. 7, the adsorption of Cu2+ or Ni2+ was combined with the COO− of AA and enhanced the stability of metal nanoparticles (Cu or Ni). The hydrogel has a three-dimensional network structure which made the metal nanoparticles disperse uniformly inside the hydrogel and prevented the aggregation of nanoparticles. Furthermore, the reactor provided a channel that increased the contact between metal nanoparticles and reactant and promoted the efficiency of catalytic reduction.
 |
| | Fig. 7 The mechanism of interaction between metal nanoparticles (Cu/Ni) and WSC-g-PVA/PAA hydrogel. | |
In order to quantitatively evaluate the catalytic performance of nanometal embodied by hydrogel, the reduction of 4-NP catalyzed by WSC-g-PAA/PVA–M (M: Cu or Ni) in the presence of NaBH4 was chosen as a model reaction (Fig. 8). From the picture, the reduction rate of 4-NP with WSC-g-PAA/PVA–Cu composite as catalyst is much faster than WSC-g-PAA/PVA–Ni system. As shown in Fig. 9(a), 4-NP had a maximum absorption peak at 317 nm, and then shifted to 400 nm immediately attributing to the formation of 4-nitrophenolate anion in alkaline condition when NaBH4 was added into the solution.32,33 It was found that the absorption intensity of 4-NP in the UV-vis cure was almost unchanged in about 60 min. The result indicated that the 4-NP was not degraded in the absent of catalyst. By tracking the change of absorption bands by UV-Vis spectrophotometers, the reduction rate of 4-NP to 4-AP could be detected. As WSC-g-PAA/PVA–Cu afford the faster reduction rate of 4-NP, a typical evolution of the UV-Vis spectra observed at every 2 min with the hydrogel–Cu as catalyst was illustrated in Fig. 9(b). It can be seen that the absorption intensity was almost unchanged until the hydrogel–Cu was put into the above solution. The absorption of 4-nitrophenolate anion at 400 nm gradually decreased with the reaction time increasing. And a new absorption peak appeared at 300 nm, which was the corresponding absorption peak at 4-AP, indicated the conversion of 4-NP to 4-AP occurred constantly without any side reaction.34 The reduction reaction could be completed about 14 min evidenced by the peak at 400 nm disappeared and the new peak at 300 nm no more changed.
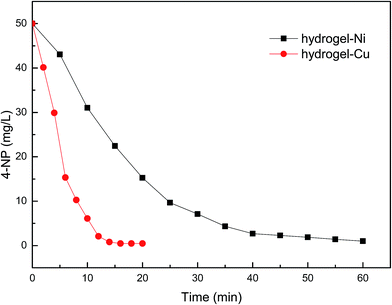 |
| | Fig. 8 The effect of different hydrogel–M as catalyst on the reduction of 4-NP. | |
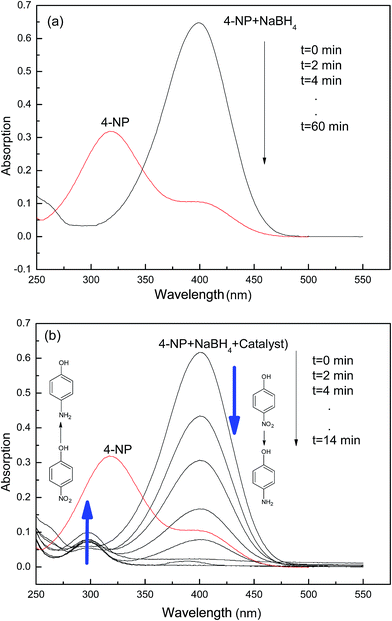 |
| | Fig. 9 UV-Vis spectra for the reduction of 4-NP to 4-AP catalyzed by hydrogel–Cu at 25 °C without NaBH4 (a) and with NaBH4 (b). | |
3.3 Analysis of response surface of the reduction reaction
3.3.1 Analysis of the model. Two catalysts including hydrogel–Cu and hydrogel–Ni were used in the experiment. We made two groups of experiment and each group of experiment has 3 parameters (x1: temperature, x2: the amount of hydrogel–M, x3: the amount of NaBH4). Three factors and three levels experiment was designed to obtain the optimal reduction condition of 4-NP by BBD.The independent variables and the response values (the 4-NP reduction rate) were presented in Table 2 (hydrogel–Cu) and Table 3 (hydrogel–Ni). The following second-order model of the reduction reaction was gained with three factors.
| Y1 = 99.41 + 1.35x1 + 20.54x2 + 15x3 − 1.40x1x2 − 4.79x1x3 − 16.21x2x3 − 7.74x12 − 13.75x22 − 6.64x32 |
| Y2 = 95.95 + 2.43x1 + 5.34x2 + 6.08x3 − 2.50x1x2 − 4.85x1x3 − 6.75x2x3 − 0.70x12 − 1.59x22 − 2.99x32 |
(
Y1: the reduction rate with hydrogel–Cu as catalyst,
Y2: the reduction rate with the hydrogel–Ni as catalyst).
The experimental data of the variance (ANOVA) for hydrogel–Cu was shown in Table 4. The model of F-value was 1326.51 and implied the model was significant. Furthermore, there was only a 0.01% (p-value was 0.0001) chance that a model F-value may occur large change due to noise. The p-value less than 0.05 (ref. 35) indicated that the terms was significant and the values less than 0.0001 showed the terms were highly significant. In contrast, the terms were useless. In this case, x1, x1x2, x1x3, were significant model terms and the most significant model term was x2, x3, x2x3, x12, x22, x32 (p < 0.0001). In general, the value of R2 (0.9994) should be higher than 0.80, which indicated that the model could better explain the 4-NP reduction process. The lack of fit F-value of 6.11 was not significant as the p-value (0.0565) was >0.05. It showed that the model can be successful used to optimize the condition of reduction of 4-NP. Adequate precision measured the ratio between the signal and the noise36 and a ratio greater than 4 was desirable. And the ratio of 59.90 indicated that the model can be successfully used to navigate the design space. Table 5 shows the ANOVA data for hydrogel–Ni as catalyst. The model of F-value was 16.54, which implied that the model was significant. The terms of x1, x2, x3, x1x3, x2x3, x32 were significant (p < 0.05). The model had satisfactory values of R2 (0.9551), could well explain the reduction of 4-NP and the adequate precision ratio of 415.52 was in the accepted range. What's more, the value of lack of fit was insignificant (0.3147 > 0.05).
Table 4 Analysis of variance (hydrogel–Cu)a
| Source |
Sum of squares |
Degrees of freedom |
Mean square |
F value |
p-Value Prob > F |
| R-Squared, 0.9994; adequate precision, 59.90. |
| Model |
7617.05 |
9 |
846.34 |
1326.51 |
<0.0001 |
| x1 |
14.55 |
1 |
14.55 |
22.80 |
0.0020 |
| x2 |
3375.95 |
1 |
3375.95 |
5291.30 |
<0.0001 |
| x3 |
1796.76 |
1 |
1796.76 |
2816.15 |
<0.0001 |
| x1x2 |
7.81 |
1 |
7.81 |
12.24 |
0.0100 |
| x1x3 |
12.88 |
1 |
12.88 |
20.19 |
0.0028 |
| x2x3 |
1050.73 |
1 |
1050.73 |
1646.87 |
<0.0001 |
| x12 |
251.93 |
1 |
251.93 |
394.87 |
<0.0001 |
| x22 |
796.31 |
1 |
796.31 |
1248.10 |
<0.0001 |
| x32 |
185.65 |
1 |
185.65 |
290.99 |
<0.0001 |
| Residual |
4.47 |
7 |
0.64 |
|
|
| Lack of fit |
3.67 |
3 |
1.22 |
6.11 |
0.0565 |
| Pure error |
0.80 |
4 |
0.20 |
|
|
| Corrected total |
7621.52 |
16 |
|
|
|
Table 5 Analysis of variance (hydrogel–Ni)a
| Source |
Sum of squares |
Degrees of freedom |
Mean square |
F value |
p-Value Prob > F |
| R-Squared, 0.9551; adequate precision, 415.52. |
| Model |
927.29 |
9 |
103.03 |
16.54 |
0.0006 |
| x1 |
47.43 |
1 |
47.43 |
7.61 |
0.0281 |
| x2 |
227.88 |
1 |
227.88 |
36.57 |
0.0005 |
| x3 |
295.95 |
1 |
295.95 |
47.50 |
0.0002 |
| x1x2 |
25.02 |
1 |
25.02 |
4.02 |
0.0851 |
| x1x3 |
94 |
1 |
94 |
15.09 |
0.0060 |
| x2x3 |
182.44 |
1 |
182.44 |
29.28 |
0.0010 |
| x12 |
2.07 |
1 |
2.07 |
0.33 |
0.5822 |
| x22 |
10.70 |
1 |
10.70 |
1.72 |
0.2315 |
| x32 |
37.73 |
1 |
37.73 |
6.06 |
0.0434 |
| Residual |
43.62 |
7 |
6.23 |
|
|
| Lack of fit |
24.06 |
3 |
8.02 |
1.64 |
0.3147 |
| Pure error |
19.55 |
4 |
4.89 |
|
|
| Corrected total |
970.91 |
16 |
|
|
|
3.3.2 Analysis of the effect of three factors on response. Using BBD design, the interactive effects of every two factors were graphically depicted by 3D response plots and the optimum values of conditions on reduction of 4-NP were obtained. Fig. 10 and 11 showed three independent response surface plots, which were useful to understand the interaction effects of these factors in the reduction reaction. It was obvious to demonstrate from Fig. 10(a) that when the hydrogel–Cu (B; 0.05–0.15 g) and NaBH4 (C; 0.05–0.15 g) increased, the reduction rate of 4-NP increased constantly. The higher reaction rate with increasing amount of NaBH4 could be attributed to the increase in the concentration of hydrogen atoms provided by NaBH4. In addition, hydrogel–Cu promoted the decomposition of NaBH4 and the adsorption of active hydrogen atoms to reduce 4-NP. As shown in Fig. 10(b) and (c), the reduction rate increased slowly when the temperature (A) was in the range from 30 °C to 48 °C. With the further increasing of the temperature (48–60 °C), the reduction rate went to slightly decrease. The result had verified that the activity of catalyst may be improved at a certain temperature; however, the catalytic performance was affected even deactivated due to high temperature. From the 3D plot (Fig. 11), it was clear that the temperature (A), hydrogel–Ni (B) and NaBH4 (C) had positive effects to the reduction rate of 4-NP (92.5–96.25%, 88–99%, 86–98%). The theoretical description of effects by hydrogel–Ni (B) and NaBH4 (C) were similar to those analyzed in Fig. 10. But the reduction rate increased slightly by 4% in the range from 30 °C to 60 °C, indicating the relative minor impact of temperature on the reaction.
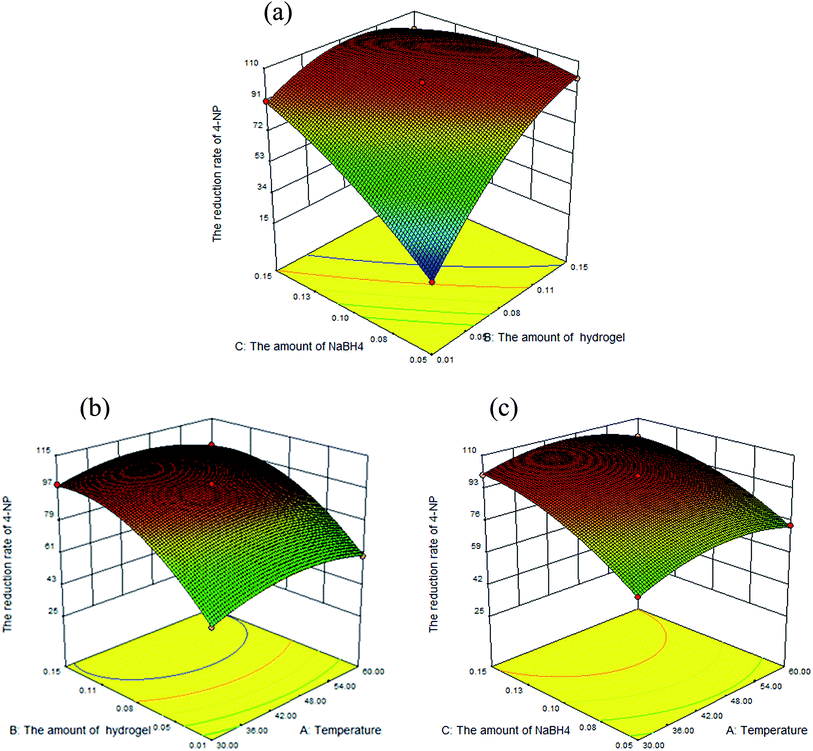 |
| | Fig. 10 3D response surface graph of the reduction of 4-NP catalyzed by hydrogel–Cu with the interactive effect of variables (x1 for A, x2 for B, x3 for C). | |
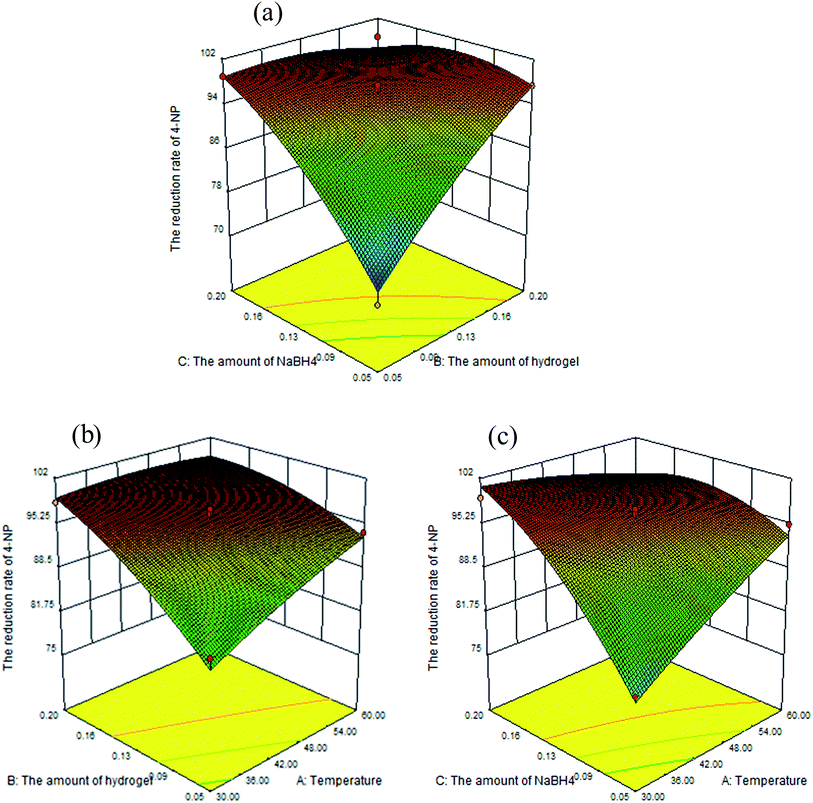 |
| | Fig. 11 3D response surface graph of the reduction of 4-NP catalyzed by hydrogel–Ni with the interactive effect of variables (x1 for A, x2 for B, x3 for C). | |
Fig. 10 and 11 depicted approximate spherical response plots; there were local maximum region under the three variables.37 So the maximum reduction rate could be obtained. In addition to considering the maximizing result, some other factors were also required, such as economy, feasibility and so on. In virtue of these constraints, the numerical optimization was carried out using BBD including three variables (minimize temperature (x1), minimize the amount of hydrogel–M (x2), minimize the amount of NaBH4 (x3)). The optimal conditions were as follows: 0.07 g hydrogel–Cu with 0.07 g NaBH4 at 30 °C and 0.08 g hydrogel–Ni with 0.12 g NaBH4 at 30 °C, respectively.
3.4 Catalytic thermodynamics of the reduction of 4-NP
The effect of temperature on the reduction of 4-NP to 4-AP with hydrogel–Cu and hydrogel–Ni as catalyst were determined by carrying on the reaction at different temperatures in the range of 30 °C to 60 °C and shown in Fig. 12. Using model, the reduction reaction kinetics of 4-NP can be described as ln(C/C0) = kt, where t is reaction time, k is pseudo first-order rate constant (min−1). C0 (mg L−1) and C (mg L−1) are the concentrations of 4-NP at initial and time t, respectively. A linear relationship of ln(C/C0) vs. t corresponding to the reduction catalyzed by hydrogel–Cu (or Ni) was shown in Fig. 12, respectively, which indicated high correlation with the reduction reaction with all the correlation coefficient above 0.97. The k for the reduction reaction was calculated from the slope of the straight line and listed in Table 6. It was found that the reduction rate constant increased gradually as the increasing of temperature, indicating the significant influences of temperature on the catalytic reduction for both catalysts. According to the values of k corresponding to different temperatures, the activation parameters of the reduction reactions catalyzed by hydrogel–Cu (Ni) could be obtained by using Arrhenius (eqn (2)) and Eyring equations (eqn (3)).| |
 | (2) |
| |
 | (3) |
where T is the absolute temperature, R is the ideal gas constant (8.314 J K−1 mol−1), kB is the Boltzmann constant (1.381 × 10⁻²³ J K−1), h is Plank constant (6.626 × 10⁻³⁴ J s), activation energy is Ea, activation entropy is S#, activation enthalpy is H#.
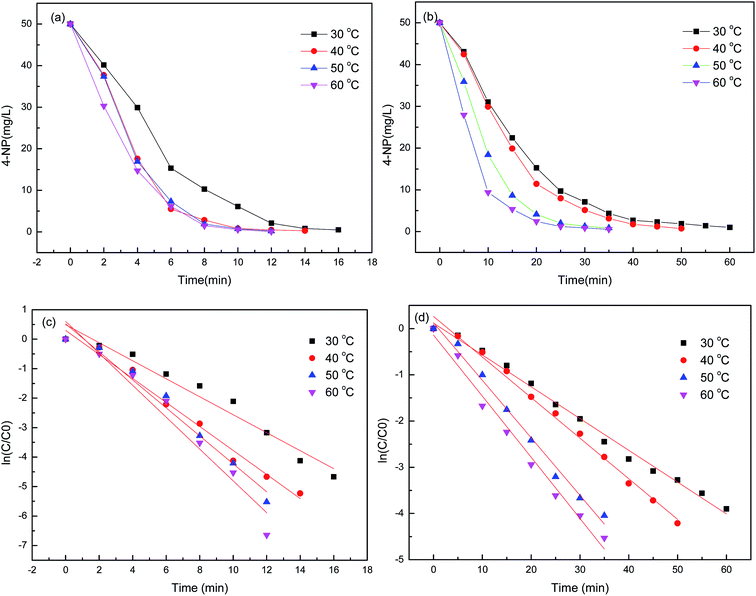 |
| | Fig. 12 The changes in the concentration of 4-NP with time in the reduction reaction catalyzed by hydrogel–Cu (a) (c) and hydrogel–Ni (b) (d). | |
Table 6 The reduction rate constants of 4-NP at different temperatures and activation parameters catalyzed by hydrogel–Cu and hydrogel–Ni
| Catalyst |
T (°C) |
k (min−1) |
R2 |
Ea (kJ mol−1) |
ΔH# (kJ mol−1) |
ΔS# (J mol−1 K−1) |
| Hydrogel–Cu |
30 |
0.331 |
0.9710 |
17.30 |
14.66 |
−205.80 |
| 40 |
0.421 |
0.9859 |
| 50 |
0.527 |
0.9902 |
| 60 |
0.621 |
0.9618 |
| Hydrogel–Ni |
30 |
0.069 |
0.9928 |
19.48 |
16.85 |
−211.59 |
| 40 |
0.088 |
0.993 |
| 50 |
0.124 |
0.9896 |
| 60 |
0.133 |
0.9851 |
And the graphs of ln![[thin space (1/6-em)]](https://www.rsc.org/images/entities/char_2009.gif) k vs. 1/T and ln(k/T) vs. 1/T were shown in Fig. 13. The activation energy, entropy and activation enthalpy were calculated and summarized in Table 6. The activation energies were 17.30 kJ mol−1 and 19.48 kJ mol−1 for hydrogel–Cu and hydrogel–Ni composites as catalyst respectively, and the effect of hydrogel–Cu composites were more effective in the reduction reaction. The value of TOF at different temperatures catalyzed by hydrogel–Cu and hydrogel–Ni was determined in Table 7. TOF was defined as the conversion of 4-NP at per surface metal atom per second.38 The value of TOF indicated that the catalytic performance of catalyst increased with the increase of temperature. The result proved that the temperature enhanced the activity of catalyst. Moreover, we have compared the results with others in the literature and the summary of the recent report and our present work in catalytic application, including the kind of metal nanoparticle, reduction method, nitroaromatic compound and the activation energy (Ea) of hydrogel–Cu/Ni was list in Table 8. It was found that the prepared nanoparticles had a better activity and the activation energy of hydrogel–Cu/Ni nanoparticles was lower than that of the recent reports.
k vs. 1/T and ln(k/T) vs. 1/T were shown in Fig. 13. The activation energy, entropy and activation enthalpy were calculated and summarized in Table 6. The activation energies were 17.30 kJ mol−1 and 19.48 kJ mol−1 for hydrogel–Cu and hydrogel–Ni composites as catalyst respectively, and the effect of hydrogel–Cu composites were more effective in the reduction reaction. The value of TOF at different temperatures catalyzed by hydrogel–Cu and hydrogel–Ni was determined in Table 7. TOF was defined as the conversion of 4-NP at per surface metal atom per second.38 The value of TOF indicated that the catalytic performance of catalyst increased with the increase of temperature. The result proved that the temperature enhanced the activity of catalyst. Moreover, we have compared the results with others in the literature and the summary of the recent report and our present work in catalytic application, including the kind of metal nanoparticle, reduction method, nitroaromatic compound and the activation energy (Ea) of hydrogel–Cu/Ni was list in Table 8. It was found that the prepared nanoparticles had a better activity and the activation energy of hydrogel–Cu/Ni nanoparticles was lower than that of the recent reports.
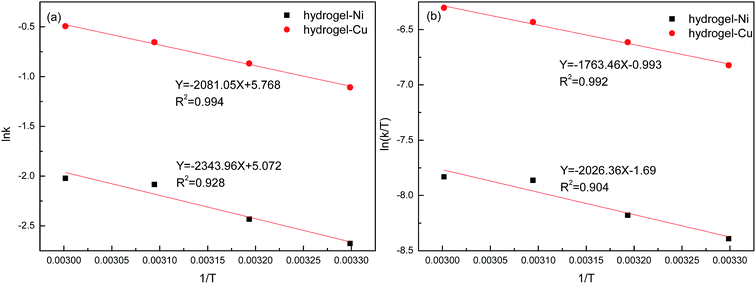 |
| | Fig. 13 ln![[thin space (1/6-em)]](https://www.rsc.org/images/entities/char_2009.gif) k vs. 1/T (a) and ln(k/T) vs. 1/T (b) graphs for reduction of 4-NP catalyzed by hydrogel–Cu and hydrogel–Ni. k vs. 1/T (a) and ln(k/T) vs. 1/T (b) graphs for reduction of 4-NP catalyzed by hydrogel–Cu and hydrogel–Ni. | |
Table 7 The values of the turnover frequency (TOF) at different temperatures in the reduction reaction catalyzed by hydrogel–Cu and hydrogel–Ni
| Catalyst |
The amount of metal nanoparticles (% mol) |
T (°C) |
TOF (h−1) |
| Hydrogel–Cu |
0.2782 |
30 |
3.55 |
| 40 |
4.07 |
| 50 |
4.76 |
| 60 |
5.72 |
| Hydrogel–Ni |
0.2787 |
30 |
0.93 |
| 40 |
1.12 |
| 50 |
1.61 |
| 60 |
1.89 |
Table 8 Comparison of catalytic performance of the prepared hydrogel–M (M: Cu or Ni) with others in the reported literature
| Metal nanoparticles |
Reduction method |
Nitroaromatic compounds |
Ea (kJ mol−1) |
Reference |
| MBS–Cu |
NaBH4 |
4-NP |
47.42 |
10 |
| p(SPM)–Cu |
NaBH4 |
4-NP |
33.86 |
39 |
| p(AAGA)–Ag |
NaBH4 |
4-NP |
33.78 |
1 |
| p(AMPS)–Co |
NaBH4 |
4-NP |
27.80 |
14 |
| p(AMPS)–Ni |
NaBH4 |
4-NP |
25.70 |
2 |
| p(SPM)–Cu |
NaBH4 |
2-NP |
24.96 |
39 |
| WSC-g-PAA/PVA–Ni |
NaBH4 |
4-NP |
19.48 |
This work |
| WSC-g-PAA/PVA–Cu |
NaBH4 |
4-NP |
17.30 |
This work |
3.5 The reusability and storage capacity of hydrogel–M
Based on the feasibility of catalyst in practical applications, the reusability and the storage capacity could be determined. To investigate the reusability of hydrogel–M, 0.05 g WSC-g-PAA/PVA–Cu (or Ni) was used in 5 consecutive runs to catalyze the reduction of 200 mL 50 mg L−1 aqueous 4-NP solution at 25 °C in order to determine the percent conversion and the activity. Conversion was calculated based on the theoretical value according to 4-NP reduction reaction and activity was estimated by taking the ratios of 4-NP reduction rates for each use to the initial reduction rate. From Fig. 14, it can be seen that 100% conversion was obtained after each successive use for 4-NP reduction, while the catalytic activity of the hydrogel–M was slowly reduced from 100% to 98% for WSC-g-PAA/PVA–Cu and 97% for WSC-g-PAA/PVA–Ni at the end of fifth use, respectively. The slight decrease in activity could be due to the accumulation of NaBO2 on the catalyst surface during the NaBH4 hydrolysis.39 In addition, the oxidation of the metal nanoparticles by the close proximity of carboxylic acid groups in hydrogel matrices can also lead to the reduction of the catalytic activity of hydrogel–M catalyst. In spite of this, it is worth mentioning that WSC-g-PAA/PVA–Cu (or Ni) still provided better catalytic properties, lower cost and more environmentally friendly compared with conventional hydrogel–M catalyst which posed similar behavior.1,3,39
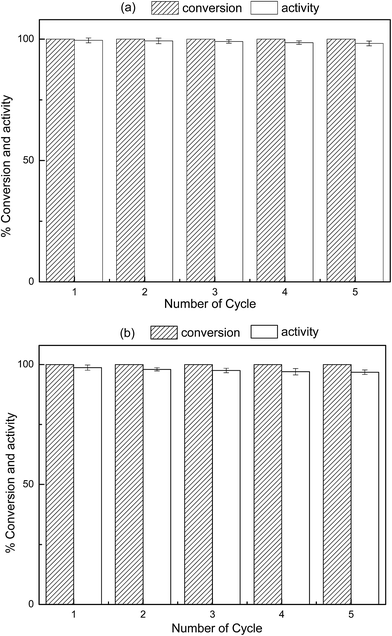 |
| | Fig. 14 The change in the conversion and activity of reduction 4-NP for five cycles with hydrogel–Cu (a) and hydrogel–Ni (b) as catalyst. | |
In order to determine the shelf-life of the hydrogel–M, the Cu or Ni nanoparticles embodied WSC-g-PAA/PVA hydrogel were stored in DW with filling nitrogen in closed containers and stored in the dark at 25 °C. The changes in the conversion and activity of WSC-g-PAA/PVA–M in different storage time were tested at the 1st, 3rd, 7th, 15th and 30th day and the result was depicted in Fig. 15. After 30 days stored, both WSC-g-PAA/PVA–Cu and WSC-g-PAA/PVA–Ni composites can provide 100% conversion and 70% activity, which indicated the good storage performance in application. It was attributed to the hydrogel media, which offered a wonderful environment to prevent the aggregation of metal nanoparticles and obstructed the loss of activity compared with bare nanoparticles.
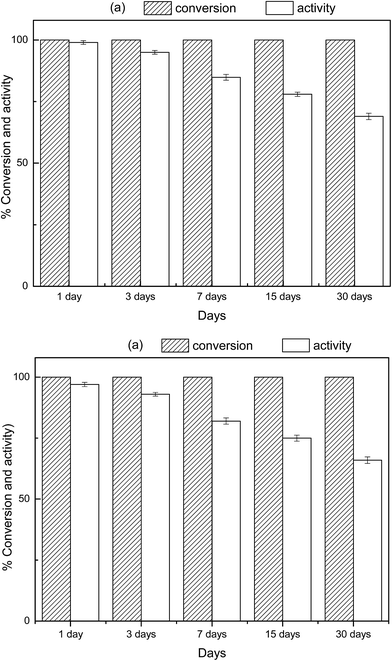 |
| | Fig. 15 The effect of storage time on the conversion and activity of hydrogel–Cu (a) and hydrogel–Ni (b). | |
4. Conclusions
In this study, Cu and Ni nanoparticles in situ preparation inside a semi-IPN WSC-g-PAA/PVA hydrogel were demonstrated and then applied as catalyst system to reduce 4-NP to 4-AP. According to the BBD design, the optimality conditions for the reduction were as follows: 0.07 g hydrogel–Cu with 0.07 g NaBH4 at 30 °C and 0.08 g hydrogel–Ni with 0.12 g NaBH4 at 30 °C, respectively. The lower activation energy values confirmed that hydrogel–Cu possessed better catalytic performance than hydrogel–Ni for reduction of 4-NP. The activity slightly changed (about 2–3%) at the end of the fifth usage and after storage of 30 days, the conversion and activity were almost 100% and 70%, respectively. These results showed that the WSC-g-PAA/PVA–M (Cu or Ni) had great potentials in the future applications.
Acknowledgements
The authors are grateful for financial support from National Natural Science Foundation of China (21477064 and 21677088), Natural Science Foundation of Shandong Province (ZR2014EEM042), Universities Innovation Projects of Jinan City (20130380) and Young Scholars Program of Shandong University (2015WLJH34). This work was supported by the Taishan Scholar Program (No. ts201511003).
References
- S. Butun and N. Sahiner, Polymer, 2011, 52, 4834–4840 CrossRef CAS.
- A. Rahman and S. B. Jonnalagadda, Catal. Lett., 2008, 123, 264–268 CrossRef CAS.
- N. Sahiner, H. Ozay, O. Ozay and N. Aktas, Appl. Catal., A, 2010, 385, 201–207 CrossRef CAS.
- A. J. Chaudhary and S. M. Grimes, Chemosphere, 2008, 72, 1636–1642 CrossRef CAS PubMed.
- S. Hamidouche, O. Bouras, F. Zermane, B. Cheknane, M. Houari, J. Debord, M. Harel, J.-C. Bollinger and M. Baudu, Chem. Eng. J., 2015, 279, 964–972 CrossRef CAS.
- G. Busca, S. Berardinelli, C. Resini and L. Arrighi, J. Hazard. Mater., 2008, 160, 265–288 CrossRef CAS PubMed.
- L. Z. Huang, H. C. Hansen and M. J. Bjerrum, J. Hazard. Mater., 2016, 306, 175–183 CrossRef CAS PubMed.
- L. Levin, M. Carabajal, M. Hofrichter and R. Ullrich, Int. Biodeterior. Biodegrad., 2016, 107, 174–179 CrossRef CAS.
- T.-H. Pham, B.-K. Lee and J. Kim, Process Saf. Environ. Prot., 2016, 104, 314–322 CrossRef CAS.
- S. Chairam, W. Konkamdee and R. Parakhun, J. Saudi Chem. Soc., 2015 DOI:10.1016/j.jscs.2015.11.001.
- R. K. Dhokale, H. M. Yadav, S. N. Achary and S. D. Delekar, Appl. Surf. Sci., 2014, 303, 168–174 CrossRef CAS.
- J. Gao, J. Xu, S. Wen, J. Hu and H. Liu, Microporous Mesoporous Mater., 2015, 207, 149–155 CrossRef CAS.
- K. Hareesh, R. P. Joshi, D. V. Sunitha, V. N. Bhoraskar and S. D. Dhole, Appl. Surf. Sci., 2016, 389, 1050–1055 CrossRef.
- N. Sahiner, H. Ozay, O. Ozay and N. Aktas, Appl. Catal., B, 2010, 101, 137–143 CrossRef CAS.
- P. Guo, L. Tang, J. Tang, G. Zeng, B. Huang, H. Dong, Y. Zhang, Y. Zhou, Y. Deng, L. Ma and S. Tan, J. Colloid Interface Sci., 2016, 469, 78–85 CrossRef CAS PubMed.
- E. Murugan and R. Rangasamy, J. Polym. Sci., Part A: Polym. Chem., 2010, 48, 2525–2532 CrossRef CAS.
- N. Sahiner, Prog. Polym. Sci., 2013, 38, 1329–1356 CrossRef CAS.
- F. Ullah, M. B. Othman, F. Javed, Z. Ahmad and H. Md Akil, Mater. Sci. Eng., C, 2015, 57, 414–433 CrossRef CAS PubMed.
- J. P. de Oliveira, G. Pinheiro Bruni, K. Oliveira Lima, S. Lisie Mello El Halal, G. Silveira da Rosa, A. Renato Guerra Dias and E. da Rosa Zavareze, Food Chem., 2017, 221, 153–160 CrossRef PubMed.
- J. T. Zhang, R. Bhat and K. D. Jandt, Acta Biomater., 2009, 5, 488–497 CrossRef CAS PubMed.
- H. El-Saied, O. A. El-Hady, A. H. Basta, C. Y. El-Dewiny and S. A. Abo-Sedera, J. Saudi Soc. Agric. Sci., 2016, 15, 188–194 Search PubMed.
- J. Liu, Q. Li, Y. Su, Q. Yue and B. Gao, Carbohydr. Polym., 2014, 107, 232–240 CrossRef CAS PubMed.
- A. A. Oun and J. W. Rhim, Carbohydr. Polym., 2016, 150, 187–200 CrossRef CAS PubMed.
- J. Zhang, D. Fu, Y. Xu and C. Liu, J. Environ. Sci., 2010, 22, 1281–1289 CrossRef CAS.
- X. Li, Q. Li, X. Xu, Y. Su, Q. Yue and B. Gao, J. Taiwan Inst. Chem. Eng., 2016, 60, 564–572 CrossRef CAS.
- Q. Wei, Y. Luo, C. Zhang, L. Fan and Y. Chen, Sens. Actuators, B, 2008, 134, 49–56 CrossRef CAS.
- F. Fug, C. Nies and W. Possart, Int. J. Adhes. Adhes., 2014, 52, 66–76 CrossRef CAS.
- Y. Zheng, Y. Liu and A. Wang, Chem. Eng. J., 2011, 171, 1201–1208 CrossRef CAS.
- W. U. Yu-Guang, T. H. Zhang, M. X. Xie and G. Zhou, J. Funct. Mater., 2002, 33, 92–96 Search PubMed.
- J. Geng, D. A. Jefferson and B. F. Johnson, Chemistry, 2009, 15, 1134–1143 CrossRef CAS PubMed.
- S. Pourbeyram and S. Mohammadi, J. Non-Cryst. Solids, 2014, 402, 58–63 CrossRef CAS.
- S. Ghosh, Appl. Catal., A, 2004, 268, 61–66 CrossRef CAS.
- X.-Q. Wu, X.-W. Wu, Q. Huang, J.-S. Shen and H.-W. Zhang, Appl. Surf. Sci., 2015, 331, 210–218 CrossRef CAS.
- P. Zhang, Y. Sui, G. Xiao, Y. Wang, C. Wang, B. Liu, G. Zou and B. Zou, J. Mater. Chem. A, 2013, 1, 1632–1638 CAS.
- B. K. Körbahti and M. A. Rauf, Chem. Eng. J., 2008, 136, 25–30 CrossRef.
- A. Özer, G. Gürbüz, A. Çalimli and B. K. Körbahti, Chem. Eng. J., 2009, 146, 377–387 CrossRef.
- K. Zhong and Q. Wang, Carbohydr. Polym., 2010, 80, 19–25 CrossRef CAS.
- X. Huang, Y. Li, Y. Li, H. Zhou, X. Duan and Y. Huang, Nano Lett., 2012, 12, 4265–4270 CrossRef CAS PubMed.
- N. Sahiner, A. Kaynak and S. Butun, J. Non-Cryst. Solids, 2012, 358, 758–764 CrossRef CAS.
|
| This journal is © The Royal Society of Chemistry 2017 |
Click here to see how this site uses Cookies. View our privacy policy here.  Open Access Article
 *,
Liwei Zhao,
Xiaodi Li,
Qinyan Yue and
Baoyu Gao


![[thin space (1/6-em)]](https://www.rsc.org/images/entities/char_2009.gif) k vs. 1/T and ln(k/T) vs. 1/T were shown in Fig. 13. The activation energy, entropy and activation enthalpy were calculated and summarized in Table 6. The activation energies were 17.30 kJ mol−1 and 19.48 kJ mol−1 for hydrogel–Cu and hydrogel–Ni composites as catalyst respectively, and the effect of hydrogel–Cu composites were more effective in the reduction reaction. The value of TOF at different temperatures catalyzed by hydrogel–Cu and hydrogel–Ni was determined in Table 7. TOF was defined as the conversion of 4-NP at per surface metal atom per second.38 The value of TOF indicated that the catalytic performance of catalyst increased with the increase of temperature. The result proved that the temperature enhanced the activity of catalyst. Moreover, we have compared the results with others in the literature and the summary of the recent report and our present work in catalytic application, including the kind of metal nanoparticle, reduction method, nitroaromatic compound and the activation energy (Ea) of hydrogel–Cu/Ni was list in Table 8. It was found that the prepared nanoparticles had a better activity and the activation energy of hydrogel–Cu/Ni nanoparticles was lower than that of the recent reports.
k vs. 1/T and ln(k/T) vs. 1/T were shown in Fig. 13. The activation energy, entropy and activation enthalpy were calculated and summarized in Table 6. The activation energies were 17.30 kJ mol−1 and 19.48 kJ mol−1 for hydrogel–Cu and hydrogel–Ni composites as catalyst respectively, and the effect of hydrogel–Cu composites were more effective in the reduction reaction. The value of TOF at different temperatures catalyzed by hydrogel–Cu and hydrogel–Ni was determined in Table 7. TOF was defined as the conversion of 4-NP at per surface metal atom per second.38 The value of TOF indicated that the catalytic performance of catalyst increased with the increase of temperature. The result proved that the temperature enhanced the activity of catalyst. Moreover, we have compared the results with others in the literature and the summary of the recent report and our present work in catalytic application, including the kind of metal nanoparticle, reduction method, nitroaromatic compound and the activation energy (Ea) of hydrogel–Cu/Ni was list in Table 8. It was found that the prepared nanoparticles had a better activity and the activation energy of hydrogel–Cu/Ni nanoparticles was lower than that of the recent reports.
![[thin space (1/6-em)]](https://www.rsc.org/images/entities/char_2009.gif) k vs. 1/T (a) and ln(k/T) vs. 1/T (b) graphs for reduction of 4-NP catalyzed by hydrogel–Cu and hydrogel–Ni.
k vs. 1/T (a) and ln(k/T) vs. 1/T (b) graphs for reduction of 4-NP catalyzed by hydrogel–Cu and hydrogel–Ni.


