 Open Access Article
Microtubular solid oxide fuel cells fabricated by gel-casting: the role of supporting microstructure on the mechanical properties
M. Morales *a and
M. A. Laguna-Bercero
 b
b
aIREC, Catalonia Institute for Energy Research, Dept of Advanced Materials for Energy Applications, Jardins de les Dones de Negre 1, Planta 2, 08930, Sant Adrià del Besós, Barcelona, Spain. E-mail: mmorales@irec.cat; mmoralescomas@yahoo.es
bInstituto de Ciencia de Materiales de Aragón, ICMA, CSIC – Universidad de Zaragoza, Pedro Cerbuna 12, 50009 Zaragoza, Spain
First published on 21st March 2017
Abstract
Different cell configurations of anode-supported microtubular solid oxide fuel cells (mT-SOFCs) using samaria-doped ceria (SDC) as the electrolyte were fabricated. Several cells were processed varying the porosity and wall thickness (outer diameter) of NiO–SDC tubular supports. Suitable aqueous slurry formulations of NiO–SDC for gel-casting were prepared using agarose, as a gelling agent, and sucrose, as a pore former. The subsequent NiO–SDC anode functional layer (AFL), the SDC electrolyte and the La0.6Sr0.4Co0.2Fe0.8O3−δ–SDC cathode were deposited by spray-coating. Afterwards, the electrochemical performance of different single cells was tested under humidified hydrogen as the fuel and air as the oxidant. The mechanical strength of the supporting tubes at different processing stages (green, pre-/post-sintering, post-reduction, post-redox cycle conditions) were also determined to study the macro-mechanical failure behaviour of the cells. In addition, the mechanical strength of half-cells with different porosity, sintering temperature and wall thickness in the tubular supports was also determined. For this purpose, the modulus of rupture was measured by a three point bending test. This study shows that the electrochemical properties and mechanical strength are feasible for further development of anode-supported mT-SOFCs fabricated by gel-casting.
1 Introduction
Solid oxide fuel cells (SOFCs) are electrochemical energy conversion devices applicable from portable systems of a few watts up to megawatt-sized power plants with high efficiency and low emissions of pollution.1,2 SOFCs can also be used for portable applications, as Auxiliary Power Units (APUs), in the transport sector or as small power units for personnel, submarines, airplanes, etc. Tubular SOFC designs have been demonstrated to be effective for portable devices, due to their high thermal shock resistance, less stringent sealing requirements, and a low thermal stress caused by rapid heating up to the operating temperature.3,4 By decreasing the tubular cell diameter to a few millimetres or sub-millimetres, such as mT-SOFCs, it is possible to improve the mechanical stability, thermo-cycling resistance, volumetric power density, and to reduce the times of start-up and shut-down.5–10 In addition, enhancing the performance at low operation temperatures also allows using cost-effective materials for interconnects and balance of plant.11 For this purpose, both decrease of the electrolyte thickness to reduce the ohmic resistance losses and using electrolytes based on gadolinium doped ceria (GDC), samarium doped ceria (SDC), or strontium and magnesium doped LaGaO3 perovskite (LSGM), which present high ionic conductivity at intermediate temperatures, are good approaches.12–15For anode-supported tubular cells, volumetric power density depends on the inverse of cell diameter; so the narrowest diameter presents the best electrochemical performance.16 In addition, the performance is also strongly affected by the wall thickness and the porosity of anode support. The best mT-SOFC performance reported in the open literature was achieved by Suzuki et al.,17 which achieved a power density higher than 1.1 W cm−2 (at 600 °C) with 1.9 mm diameter and a porosity of 54% (before reduction). This represents a good balance between porosity to aid gas flow and continuity of material to help the electrical conductivity. The effect of pore former amounts and the type of material used as a pore former have been also investigated by several researchers.18,19 In general, tubular supports with high values in porosity are weaker mechanically. For instance, Roy et al.19 quantified this weakening for several volume percentages of pore former (40%, 50% and 60%), thus observing a drop of 26% in average burst strength for each 10% volumetric increment of pore former. The average burst strength was 11.7 ± 7.5 MPa for the tested tubes with 60% pore-former by volume. It may be sufficient in many cases. However, this weakening effect due to the added porosity must be considered when high mechanical resistances in cells are required. Therefore, the design of mT-SOFCs should be balanced between their electrical and mechanical properties. In addition, the manufacturing of these devices should not be only focussed on electrochemical performance, but also on mechanical properties. The cells should require a minimum strength to allow their handling during single-cell manufacturing and their assembling into fuel-cell stack. They must also survive to thermal cycling under operation conditions. The failure of a cell in a stack will decrease the stack efficiency, as well as shorten considerably its lifetime. Therefore, the mechanical strength of the different components of the mT-SOFCs is critical for their future implementation. Despite these mechanical requirements, the specific study of the mechanical properties of mT-SOFCs has not received much attention. Up to date, only several studies about mechanical and thermal characterization of tubular anode-supports18,20–24 and electrolyte-supports25 fabricated by extrusion technique have been reported. The cells were characterized mechanically using macroscopic techniques, such as three- or four-point bending, burst testing and c-ring testing.
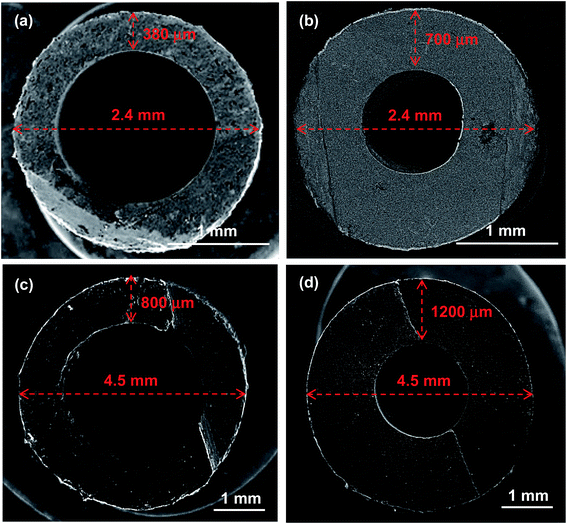
Owing to the important electrochemical and mechanical requirements of tubular cells, the manufacturing of the support is probably the most important part in microtubular SOFC research. It presents several technical difficulties, particularly in terms of a relatively high investment in equipment and a long time for the adjustment of processing parameters. Typical fabrication procedures for the tubular support include cold isostatic pressing,26,27 slip-casting,28,29 powder extrusion moulding,30,31 electrophoretic deposition32 and co-extrusion33 amongst others. Alternatively, aqueous gel-casting is a wet-forming technique that allows to prepare dense and porous ceramics, with high quality and complex geometry, in short forming times, and low-cost equipment.34–37 Morales et al.38–40 reported a new methodology combining the agarose gel-casting and spray-coating techniques that are easily industrially scalable for processing of the anode-supported tubular cells based on NiO–Sm0.2Ce0.8O1.9/Sm0.2Ce0.8O1.9/La0.6Sr0.4Co0.2Fe0.8O3−d–Sm0.2Ce0.8O1.9 (Ni–SDC/SDC/LSCF–SDC). Tubular supports were shaped by a gel-casting method based on a new and simple forming technique, which operates as a syringe. Electrochemical performance of mT-SOFC cells fabricated by agarose gel-casting was optimized. The cell with a support of 2.4 mm outer diameter, 380 μm wall thickness, and using 10 wt% sucrose as a pore former, achieved a power density of 0.4 W cm−2 at 650 °C. In the present work, special attention will be focused on the effect of the support on the mechanical properties for anode-supported microtubular SOFCs fabricated by gel-casting. For this purpose, several NiO–SDC tubular supports were manufactured varying different processing parameters: porosity, sintering temperature and wall thickness (outer diameter). The relationships between manufacturing parameters and electrochemical and mechanical properties will be discussed. In addition, the mechanical strength of the supporting tubes at different processing stages will be analysed to study the macro-mechanical failure behaviour of the cells.
2 Experimental procedure
2.1 Cell manufacturing
The mT-SOFCs were fabricated using the process developed in our previous studies.38,39 Compositions and dimensions of the cells were initially selected based on preliminary electrochemical results.40 Samarium-doped ceria, nickel oxide–samarium doped ceria (60![[thin space (1/6-em)]](https://www.rsc.org/images/entities/char_2009.gif) :
:![[thin space (1/6-em)]](https://www.rsc.org/images/entities/char_2009.gif) 40 and 50
40 and 50![[thin space (1/6-em)]](https://www.rsc.org/images/entities/char_2009.gif) :
:![[thin space (1/6-em)]](https://www.rsc.org/images/entities/char_2009.gif) 50 wt%), and lanthanum strontium cobaltite powders, with a nominal composition of Sm0.2Ce0.8O1.9 (SDC), NiO–Sm0.2Ce0.8O1.9 (NiO–SDC) and La0.6Sr0.4Co0.2Fe0.8O3−δ (LSCF) respectively, were synthesized by polyacrylamide gel combustion as described elsewhere.41,42 All these powders were characterized by BET specific surface and XRD in order to confirm their quality. The composition of the microtubular SOFCs was selected as follows: NiO–SDC (60
50 wt%), and lanthanum strontium cobaltite powders, with a nominal composition of Sm0.2Ce0.8O1.9 (SDC), NiO–Sm0.2Ce0.8O1.9 (NiO–SDC) and La0.6Sr0.4Co0.2Fe0.8O3−δ (LSCF) respectively, were synthesized by polyacrylamide gel combustion as described elsewhere.41,42 All these powders were characterized by BET specific surface and XRD in order to confirm their quality. The composition of the microtubular SOFCs was selected as follows: NiO–SDC (60![[thin space (1/6-em)]](https://www.rsc.org/images/entities/char_2009.gif) :
:![[thin space (1/6-em)]](https://www.rsc.org/images/entities/char_2009.gif) 40 wt%) as the anode tubular support, NiO–SDC (50
40 wt%) as the anode tubular support, NiO–SDC (50![[thin space (1/6-em)]](https://www.rsc.org/images/entities/char_2009.gif) :
:![[thin space (1/6-em)]](https://www.rsc.org/images/entities/char_2009.gif) 50 wt%) as the anode functional layer (AFL), SDC as the electrolyte and LSCF–SDC (70
50 wt%) as the anode functional layer (AFL), SDC as the electrolyte and LSCF–SDC (70![[thin space (1/6-em)]](https://www.rsc.org/images/entities/char_2009.gif) :
:![[thin space (1/6-em)]](https://www.rsc.org/images/entities/char_2009.gif) 30 wt%) as the cathode. The reference tubular support of cells, used as a baseline for variation processing parameters, was fabricated with a formulation consisted of 1.0 wt% dispersant/solid loading (DOLAPIX GmbH & Co), 34 wt% NiO–SDC solid loading/water, 10 wt% sucrose/solid loading as a pore former, and 0.90 wt% agarose (Lab. Conda)/suspension (in vol.) as a gelling agent. In order to obtain a homogeneous slurry, the agarose suspension was firstly activated by heating around 80–90 °C, and then kept above 40 °C until casting. Tubes were extruded by gel-casting using a steel punch (Ø = 3 mm) with an in-house-designed aluminium die (Ø = 6 mm, and length = 250 mm). The resulting green tubes were finally dried in air for 48 h, and cut to a length of 100–120 mm. Afterwards, an anode functional layer (50
30 wt%) as the cathode. The reference tubular support of cells, used as a baseline for variation processing parameters, was fabricated with a formulation consisted of 1.0 wt% dispersant/solid loading (DOLAPIX GmbH & Co), 34 wt% NiO–SDC solid loading/water, 10 wt% sucrose/solid loading as a pore former, and 0.90 wt% agarose (Lab. Conda)/suspension (in vol.) as a gelling agent. In order to obtain a homogeneous slurry, the agarose suspension was firstly activated by heating around 80–90 °C, and then kept above 40 °C until casting. Tubes were extruded by gel-casting using a steel punch (Ø = 3 mm) with an in-house-designed aluminium die (Ø = 6 mm, and length = 250 mm). The resulting green tubes were finally dried in air for 48 h, and cut to a length of 100–120 mm. Afterwards, an anode functional layer (50![[thin space (1/6-em)]](https://www.rsc.org/images/entities/char_2009.gif) :
:![[thin space (1/6-em)]](https://www.rsc.org/images/entities/char_2009.gif) 50 wt% NiO–SDC and 15 μm thickness) was deposited by colloidal spray-coating onto the tubular substrates, and then pre-sintered at 1100 °C. Subsequently, the SDC electrolyte layer (15 μm thickness) was deposited by colloidal spray-coating, which was also made by mixing commercial SDC with cobalt oxide (2.0 wt%) used as a sintering aid. Then, both anode and electrolyte were co-sintered at 1450 °C for 5 h. After co-sintering, the 70
50 wt% NiO–SDC and 15 μm thickness) was deposited by colloidal spray-coating onto the tubular substrates, and then pre-sintered at 1100 °C. Subsequently, the SDC electrolyte layer (15 μm thickness) was deposited by colloidal spray-coating, which was also made by mixing commercial SDC with cobalt oxide (2.0 wt%) used as a sintering aid. Then, both anode and electrolyte were co-sintered at 1450 °C for 5 h. After co-sintering, the 70![[thin space (1/6-em)]](https://www.rsc.org/images/entities/char_2009.gif) :
:![[thin space (1/6-em)]](https://www.rsc.org/images/entities/char_2009.gif) 30 wt% LSCF–SDC cathode was sprayed onto the half-cell and sintered at 1050 °C for 2 h in air. Final cell dimensions are: 2.4 mm outer diameter, 380 μm wall thickness, 80–100 mm in length, and a cathode active area of 60–100 mm2, in order to keep the cells in the isothermal zone of the furnace. Microstructures of the cell components were analyzed by field emission scanning electron microscope (Merlin FE-SEM, Carl Zeiss). The porosity amount and the pore size distribution of the supports, after reduction of NiO to Ni, were determined by Hg-porosimetry (Quantachrome Poremaster porosimeter). The relative density of SDC electrolyte layer was determined by image analysis using DigitalMicrograph (TM) 365 (Gatan Inc., USA) software. For this purpose, three different images for each sample taken with identical magnification (×5000) were analyzed. The volume fraction of pore phase was calculated by image thresholding in a similar manner as described in a previous work.43 Image treatment consists in reducing the 256 grey levels from the original image to only 2 grey levels corresponding to the two phases (black for pores and grey for SDC). This is achieved by applying a threshold to the grey level histogram of the original image to obtain two binary images corresponding to the SDC and pore phases.
30 wt% LSCF–SDC cathode was sprayed onto the half-cell and sintered at 1050 °C for 2 h in air. Final cell dimensions are: 2.4 mm outer diameter, 380 μm wall thickness, 80–100 mm in length, and a cathode active area of 60–100 mm2, in order to keep the cells in the isothermal zone of the furnace. Microstructures of the cell components were analyzed by field emission scanning electron microscope (Merlin FE-SEM, Carl Zeiss). The porosity amount and the pore size distribution of the supports, after reduction of NiO to Ni, were determined by Hg-porosimetry (Quantachrome Poremaster porosimeter). The relative density of SDC electrolyte layer was determined by image analysis using DigitalMicrograph (TM) 365 (Gatan Inc., USA) software. For this purpose, three different images for each sample taken with identical magnification (×5000) were analyzed. The volume fraction of pore phase was calculated by image thresholding in a similar manner as described in a previous work.43 Image treatment consists in reducing the 256 grey levels from the original image to only 2 grey levels corresponding to the two phases (black for pores and grey for SDC). This is achieved by applying a threshold to the grey level histogram of the original image to obtain two binary images corresponding to the SDC and pore phases.
2.2 Processing variations
In order to optimize the microstructure for the electrochemical and mechanical behaviour, several design parameters were modified during processing of the tubular supports. The three key design parameters of these supports are as: content of 10 wt% sucrose as a pore former, sintering temperature of 1450 °C (then reduced at 700 °C), and wall thickness of 380 μm (2.4 mm outer diameter). These parameters will be modified by: (1) varying the percent of pore former between 0 and 15 wt% sucrose, (2) decreasing the sintering temperature to 1400 and 1350 °C, and (3) increasing the wall thickness to 700 μm for 2.4 mm outer diameter, 800 μm and 1200 μm for 4.5 mm outer diameter.2.3 Mechanical characterization
Three-point bending test was used to evaluate the mechanical strength of both the tubular anode supports at different processing stages (green, pre-/post-sintering, post-reduction, post-redox cycle conditions) and the half-cells (anode + electrolyte) manufactured under different conditions. Flexural strength, also well-known as modulus of rupture (MOR), was determined using an uniaxial dynamic test equipment (INSTRON 8032). The samples were fixed onto the sample holder set at a span length of 30 mm. The MOR was calculated using the following eqn (1):
 | (1) |
In order to understand the reliability of the flexural strengths, their variability was analysed using the Weibull statistical method. The cumulative Weibull distribution describes the fracture probability P for a given uniaxial stress σ, expressed as:
 | (2) |
 | (3) |
The values of m and σ0 can be obtained by fitting the experimental data, using the conventional least square regression method.
2.4 Electrochemical characterization
The electrochemical performance of the cells was tested using H2 as fuel in the anodic compartment and air in the cathodic chamber. Electrical connections were made using four Ag wires. Ag meshes were used as current collectors at the cathode and anode (inner part of the tube). The tube was sealed using Ceramabond 503 sealant (Aremco, US) into alumina tubes and finally all the system was introduced into a quartz tube, and sealed again to separate both chambers. Additional details of the experimental setup can be found in previous works.45,46 The cell was heated up to 700 °C in a small tubular furnace under nitrogen at the anode chamber and static air at the cathode side. At this temperature, hydrogen was introduced to reduce the anode. The full reduction takes about 2 hours and subsequently the cells were characterized. Electrochemical measurements were carried out at a temperature of 650 °C. j–V (current density–voltage) measurements were performed using a VSP Potentiostat/Galvanostat (Princeton Applied Research, Oak Ridge, US) in potentiodynamic mode from OCV down to 0.35 V at 0.25 mA s−1.3 Results and discussion
3.1 Mechanical strength of supports and half-cells during manufacturing
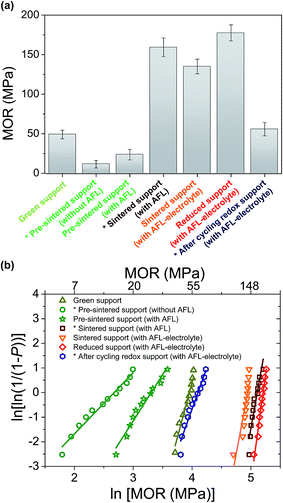
MOR and the corresponding Weibull plots for the reference tubular support and half-cell at different process stages are shown in Fig. 1. A summary of the calculated MOR values and the Weibull statistical analyses performed on the data in the form of Weibull moduli and σ0 values are presented in Table 1. The σ0 values are a representation of the statistical probability of failure, and so, the tubular supports and half-cells will fail in large percentages at or below the σ0 value. The Weibull modulus may be used to describe the scatter of the mechanical strength in brittle (or quasi-brittle) materials. The results show that although the green tubes with AFL present a relatively low mechanical strength, they are strong enough for handling. In contrast, the tubular supports pre-sintered at 1100 °C are remarkable brittle and weak. In addition, the tubular support without AFL possesses lower mechanical strength than that with AFL, which is attributed to the effect of AFL microstructure with higher density compared to the support. In both cases, the large scatter is attributed to a lack of uniformity in this step of the fabrication process. As expected, the co-sintering process of the half-cell (tubular support and electrolyte) at 1450 °C significantly increases their mechanical strength. However, the MOR value of tubular support is more strongly increased after sintering the support without electrolyte. This decrease in the MOR value may be due to the thermo-mechanical stress generated by electrolyte layer on the support. Finally, the reduction process of NiO to Ni improves the mechanical strength and Weibull modulus of the half-cell, due to the high toughness of Ni–SDC cermet skeleton in the tubular support of half-cell. The MOR value in the reduced support of half-cell is around 20–30% lower than those reported in previous studies for Ni-YSZ/YSZ tubular half-cells also tested by three- or four-point bending.20,21 This decrease can be attributed to both the microstructural differences of tubular support and the use of doped ceria in the support, AFL and electrolyte, which presents lower mechanical properties than YSZ.47,48 In any case, the mechanical strength in terms of MOR and Weibull modulus for the studied half-cell may be suitable for their implementation in robust stacks.5,19–21| Processing stages of reference half-cell | MOR (MPa) | Weibull parameters | |
|---|---|---|---|
| σ0 | m | ||
| Green support | 49.4 ± 5.4 | 52.2 | 8.9 |
| Pre-sintered support (without AFL)* | 11.9 ± 4.8 | 14.5 | 2.5 |
| Pre-sintered support (with AFL) | 23.9 ± 6.6 | 27.4 | 3.8 |
| Sintered support (with AFL)* | 159.4 ± 11.8 | 165.8 | 13.4 |
| Sintered support (with AFL–electrolyte) | 135.2 ± 9.2 | 140.8 | 12.8 |
| Reduced support (with AFL–electrolyte) | 177.6 ± 10.1 | 182.6 | 17.5 |
| After cycling redox support (with AFL–electrolyte) * | 56.0 ± 8.4 | 60.3 | 6.7 |
On the other hand, one full redox cycle: (1) reduction under H2 at 700 °C for 2 h, (2) re-oxidation under synthetic air at 700 °C for 5 h, and (3) post-reduction (H2/700 °C/2 h), produces a remarkable decrease in the mechanical strength of half-cell. As observed in Fig. 2, re-oxidation and post-reduction of the support and AFL may origin irreversible damages to the tubular half-cell: fractures in the microstructural integrity of the support, AFL and electrolyte, as well as delamination between the different components. This is attributed to the increase of volume during nickel oxidation, which induces high tensile stress and cracks at interfaces.49,50
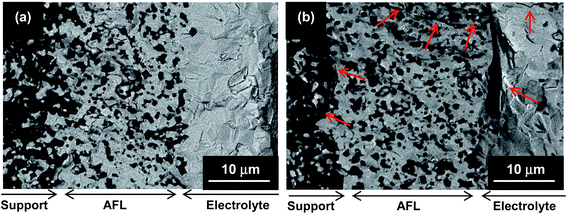 | ||
| Fig. 2 SEM images of: (a) half-cell after the reduction process, and (b) reduced half-cell after one redox cycle. The arrows indicate different cracks at the region of support, AFL and electrolyte. | ||
3.2 Mechanical properties of the microtubular cells
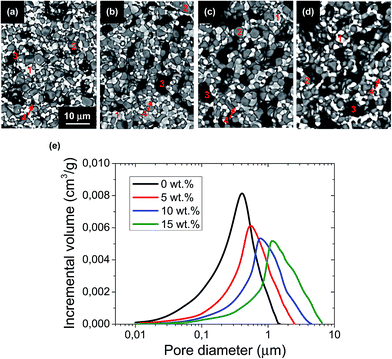
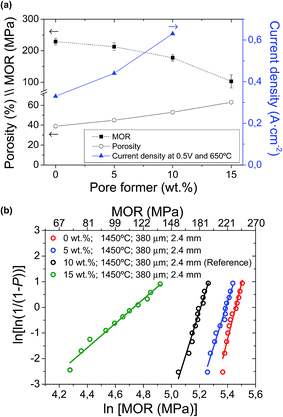
Afterwards, the mechanical strength of the different supports was evaluated. As shown in Fig. 4 and Table 2, an almost linear relationship between the increase of pore former (in weight, wt%) and the decrease of MOR is observed for the studies pore former range (between 0 and 15 wt%). For example, a 5 wt% increase in pore former with respect to the reference support (10 wt%) decreases the strength from 177.6 ± 10.1 MPa to 102.2 ± 21.4 MPa, which is approximately a decrease of 42%. Furthermore, the mechanical integrity of these supports with 15 wt% pore former is relatively critical during the manufacturing process, as a consequence of their high porosity after pre-sintering. According to their Weibull modulus, these conditions yield high failure percentages during fabrication, making it difficult to obtain suitable cells for electrochemical testing. As a consequence, the support with 15 wt% pore former and 62% porosity was finally dismissed, and unfortunately, it could not be electrochemically tested, due to its low mechanical strength and low dimensional stability. In contrast, a decrease of pore former to 5 wt% and 0 wt% increases the mechanical strength to 212.8 ± 12.2 MPa and 229.1 ± 10.5 MPa, respectively (improvement of 20% and 23% vs. to the reference support). In conclusion, the large variation in porosity and pore size distribution between the half-cell supports with different amounts of pore former would explain the apparent difference in mechanical strength.
| Half-cells with different processing variations | MOR (MPa) | Weibull parameters | |
|---|---|---|---|
| σ0 | m | ||
| 0 wt%; 1450 °C; 380 μm; 2.4 mm (1) | 229.1 ± 10.5 | 233.2 | 21.9 |
| 5 wt%; 1450 °C; 380 μm; 2.4 mm (1) | 212.8 ± 11.2 | 219.2 | 18.5 |
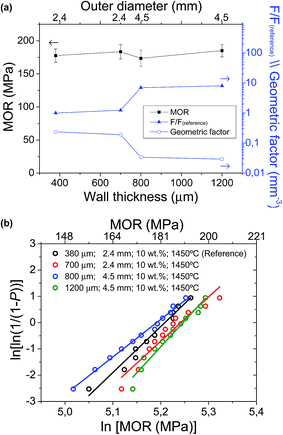
| 10 wt%; 1450 °C; 1200 μm; 4.5 mm (1) | 185.1 ± 9.4 | 190.0 | 19.8 |
| 10 wt%; 1450 °C; 700 μm; 2.4 mm (1) | 183.5 ± 10.9 | 189.3 | 16.8 |
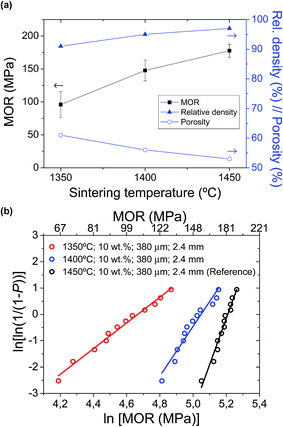
| 10 wt%; 1450 °C; 380 μm; 2.4 mm (reference) (1) | 177.6 ± 10.1 | 182.6 | 17.5 |
| 10 wt%; 1450 °C; 800 μm; 4.5 mm (2) | 173.5 ± 12.2 | 179.0 | 14.3 |
| 10 wt%; 1400 °C; 380 μm; 2.4 mm (2) | 147.7 ± 15.8 | 156.0 | 9.4 |
| 15 wt%; 1450 °C; 380 μm; 2.4 mm (3) | 102.2 ± 21.4 | 113.8 | 4.7 |
| 10 wt%; 1350 °C; 380 μm; 2.4 mm (3) | 95.9 ± 19.9 | 106.7 | 4.9 |
3.3 Electrochemical characterization
A detailed electrochemical characterization of this type of cells was already reported in a previous work.40 Current densities at 0.5 V and 650 °C for the cells with different amounts of pore former in the support are also presented in Fig. 3a. As clearly observed, current density values are significantly enhanced when increasing the amount of pore former in the support (0.33, 0.44 and 0.63 A cm−2 with 0, 5 and 10 wt% pore former, respectively). Unfortunately, the cell with 15 wt% pore former in the support could not be electrochemically tested properly, due to its low mechanical strength and low dimensional stability. The current density, as an electrochemical parameter, clearly shows the gas transport limitations on cell performances, especially working at high current densities. The effect of gas transport limitation was confirmed by EIS experiments,40 where the low frequency Warburg response (hydrogen transport through the Ni–SDC support) increases when reducing the porosity of the support. Therefore, the large variation in porosity and pore size distribution between the cells with different amounts of pore former in the support would explain the significant differences in cell performance. As a summary, although the addition of pore former produces a remarkable mechanical weakness in the cells, but it also leads to an improvement on cell performance. The sample with about 50% porosity in the support was found to be the optimal to avoid a strong limitation of gas transport and guarantee enough mechanical strength.On the other hand, Fig. 8 also shows the cell performances for different cells as a function of the wall thickness (380, 700 and 1200 μm), collected at 0.5 V and 650 °C. Unfortunately, the cell with 800 μm wall thickness and 4.5 mm outer diameter could not be tested with a suitable electrochemical stability in operation. Although this configuration presented an enough mechanical strength and Weibull parameters close to the others, the presence of punctual microcracks and/or pores at the electrolyte layer created during the sintering process generated significant gas leakages between anode and cathode chambers. In order to obtain an enhanced electrolyte layer, it would be necessary to modify both pre-sintering and sintering temperatures. In the cells tested without remarkable problems, it is observed that both area and volumetric power densities are significantly improved with the reduction of the wall thickness. In terms of area power density, the performance of the reference cell is increased more than 150% and 200% (0.42 W cm−2 with almost 400 μm wall thickness) compared to the cells with 700 μm (0.24 W cm−2) and 1200 μm (0.18 W cm−2) wall thickness, respectively. In contrast, the volumetric power density of reference cell (0.70 kW L−1 with 2.4 mm outer diameter) is 4 times higher than that of 1200 μm wall thickness and 4.5 mm outer diameter (0.16 kW L−1), as the volumetric performance depends on the wall thickness and additionally the inverse of the cell outer diameter. This is also consistent with EIS analysis, as concentration polarization increases when increasing wall thickness.40 In conclusion, the reduction of wall thickness and outer diameter in a mT-SOFC significantly increases the volumetric and area power density keeping almost constant both the MOR and the microstructural properties.
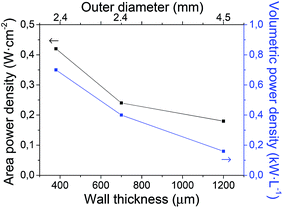 | ||
| Fig. 8 Area and volumetric power densities (at 0.5 V and 650 °C) as a function of the wall thickness of half-cell (support–AFL–electrolyte). | ||
4 Conclusions
Microtubular SOFCs based on Ni–SDC support and doped ceria electrolyte fabricated by gel-casting, have been mechanically characterized in order to analyse the macro-mechanical failure behaviour during their manufacturing. Three-point bending tests evidence that the pre-sintering of tubular support at 1100 °C is the most critical step mechanically, as the MOR is only 23.9 ± 6.6 MPa, making difficult their handling. Afterwards, the co-sintering and reduction processes significantly improve both the MOR of the half-cell to 177.6 ± 10.1 MPa and the Weibull modulus (m = 17.5), evidencing that they can be suitable for their implementation in robust stacks. The low amount of scattering in the final half-cells is attributed to the good uniformity of the overall fabrication process, except for pre-sintering step.On the other hand, the influence of Ni–SDC tubular support on the electrochemical and mechanical properties of mT-SOFCs has been evaluated by varying several processing parameters: amount of sucrose as a pore former, sintering temperature, and wall thickness and outer diameter. For this purpose, a half-cell fabricated with 10 wt% pore former, sintered at 1450 °C, and 380 μm wall thickness and 2.4 mm outer diameter has been used as a reference. The best results were attained with the reference cell (53% porosity and sintered at 1450 °C) achieving optimized gas transport (high current densities) and good mechanical strength with low scattering. This is mainly attributed to a good microstructural support in terms of porosity amount and distribution (with 10 wt% pore former), but also guaranteeing a dense electrolyte and a good adhesion of support–AFL–electrolyte. Finally, it was found that the volumetric and area power densities are strongly enhanced by the reduction of wall thickness and outer diameter in a mT-SOFC. For instance, the volumetric power density of reference cell (0.70 kW L−1) is 4 times higher than that of 1200 μm wall thickness and 4.5 mm outer diameter (0.16 kW L−1). Although both design parameters of tubular support are not significantly affected on the MOR values and microstructural properties, they increment the tube geometric factor strongly decreasing the applied force to rupture at a determined span length, and vice versa. In conclusion, the tubular support design for a mT-SOFC stack requires a good balance between wall thickness, outer diameter and span length in order to maximize the volumetric and area performance and minimize the loss of mechanical strength in terms of applied force to rupture.
Acknowledgements
The present work was financed by the Spanish Government (Ministerio de Economía y Competitividad) and the Feder program of the European Union with the project MAT2015-68078-R.References
- R. M. Ormerod, Solid oxide fuel cells review, Chem. Soc. Rev., 2003, 32, 17–28 RSC.
- P. Aguiar, D. J. L. Brett and N. P. Brandon, J. Power Sources, 2007, 171, 186–197 CrossRef CAS.
- K. Kendall and M. Palin, J. Power Sources, 1998, 71, 268–270 CrossRef CAS.
- C. E. Hatchwell, N. M. Sammes and K. Kendall, J. Power Sources, 1998, 70, 85–90 CrossRef CAS.
- V. Lawlor, S. Griesser, G. Buchinger, A. G. Olabi, S. Cordiner and D. Meissner, J. Power Sources, 2009, 193, 387–399 CrossRef CAS.
- T. Suzuki, T. Yamaguchi, Y. Fujishiro and M. Awano, J. Electrochem. Soc., 2006, 1535, A925–A928 CrossRef.
- V. M. Orera, A. Larrea and M. A. Laguna-Bercero, Front. Energy Res., 2014, 2, 1–13 Search PubMed.
- M. Torrell, A. Morata, P. Kayser, M. Kendall, K. Kendall and A. Tarancón, J. Power Sources, 2015, 285, 439–448 CrossRef CAS.
- H. Monzón and M. A. Laguna-Bercero, Electrochim. Acta, 2016, 222, 1622–1627 CrossRef.
- A. Hornés, M. Torrell, A. Morata, M. Kendall, K. Kendall and A. Tarancón, Int. J. Hydrogen Energy, 2017, 1–13 Search PubMed.
- B. C. H. Steele and A. Heinzel, Nature, 2001, 414, 345–352 CrossRef CAS PubMed.
- V. V. Kharton, F. M. B. Marques and A. Atkinson, Solid State Ionics, 2004, 174, 135–149 CrossRef CAS.
- J. Fergus, R. Hui, X. Li, D. P. Wilkinson and J. Zhang, Solid Oxide Fuel Cells: Materials Properties and Performance, CRC, 2008 Search PubMed.
- M. Morales, J. J. Roa, J. M. Perez-Falcón, J. Tartaj, F. Espiell and M. Segarra, J. Power Sources, 2014, 246, 918–925 CrossRef CAS.
- M. Morales, J. J. Roa, J. Tartaj and M. Segarra, J. Eur. Ceram. Soc., 2016, 36, 1–16 CrossRef CAS.
- K. S. Howe, G. J. Thompson and K. Kendall, J. Power Sources, 2011, 196, 1677–1686 CrossRef CAS.
- T. Suzuki, Z. Hasan, Y. Funahashi, T. Yamaguchi, Y. Fujishiro and M. Awano, Science, 2009, 325(5942), 852–855 CrossRef CAS PubMed.
- C. Jin, J. Liu, L. Li and Y. Bai, J. Membr. Sci., 2009, 341, 233–237 CrossRef CAS.
- B. R. Roy, N. M. Sammes, T. Suzuki, Y. Funahashi and M. Awano, J. Power Sources, 2009, 188, 220–224 CrossRef CAS.
- N. M. Sammes and Y. Du, J. Mater. Sci., 2003, 38, 4811–4816 CrossRef CAS.
- N. M. Sammes and Y. Du, Int. J. Appl. Ceram. Technol., 2007, 4, 89–102 CrossRef CAS.
- N. Droushiotis, U. Doraswami, K. Kanawka, G. H. Kelsall and K. Li, Solid State Ionics, 2009, 180, 1091–1099 CrossRef CAS.
- Y.-W. Sin, K. Galloway, B. Roy, N. M. Sammes, J.-H. Song, T. Suzuki and M. Awano, Int. J. Hydrogen Energy, 2011, 36, 1882–1889 CrossRef CAS.
- H. Sumi, T. Yamaguchi, K. Hamamoto, T. Suzuki and Y. Fujishiro, J. Am. Ceram. Soc., 2013, 96, 3584–3588 CrossRef CAS.
- Y. Du, N. M. Sammes, G. A. Tompsett, D. Zhang, J. Swan and M. Bowdend, J. Electrochem. Soc., 2003, 150, A74–A78 CrossRef CAS.
- V. Gil, J. Gurauskis, R. Campana, R. I. Merino, A. Larrea and V. M. Orera, J. Power Sources, 2011, 196, 1184 CrossRef CAS.
- T. Mahata, S. R. Nair, R. K. Lenka and P. K. Sinha, Int. J. Hydrogen Energy, 2012, 37, 3874 CrossRef CAS.
- A. Mirahmadi and K. Valefi, Ionics, 2011, 17, 767 CrossRef CAS.
- J. J. Roa, J. C. Ruiz-Morales, J. Canales-Vázquez, M. Morales, X. G. Capdevila, P. Núñez and M. Segarra, Fuel Cells, 2011, 11, 124–130 CrossRef CAS.
- H. Monzón, M. A. Laguna-Bercero, A. Larrea, B. I. Arias, A. Várez and B. Levenfeld, Int. J. Hydrogen Energy, 2014, 39, 5470 CrossRef.
- B. I. Arias-Serrano, M. E. Sotomayor, A. Várez, B. Levenfeld, H. Monzón, M. A. Laguna-Bercero and A. Larrea, RSC Adv., 2016, 6, 19007–19015 RSC.
- J. S. Cherng, C. C. Wu, W. H. Chen and T. H. Yeh, Ceram. Int., 2013, 39, S601 CrossRef CAS.
- M. H. D. Othman, N. Droushiotis, Z. Wu, G. Kelsall and K. Li, Adv. Mater., 2011, 23, 2480 CrossRef CAS PubMed.
- A. Douy, Int. J. Inorg. Mater., 2001, 3, 699–707 CrossRef CAS.
- A. J. Millán, I. Santacruz, A. J. Sánchez-Herencia, M. I. Nieto and R. Moreno, Adv. Eng. Mater., 2002, 4, 913–915 CrossRef.
- K. Prabhakaran, A. Melkeri, M. O. Beigh, N. M. Gokhale and S. C. Sharma, J. Am. Ceram. Soc., 2007, 90(2), 622–625 CrossRef CAS.
- J. Yang, J. Yu and Y. Huang, J. Eur. Ceram. Soc., 2011, 31, 2569–2591 CrossRef CAS.
- M. E. Navarro, X. G. Capdevila, M. Morales, J. J. Roa and M. Segarra, J. Power Sources, 2012, 200, 45–52 CrossRef CAS.
- M. Morales, M. E. Navarro, X. G. Capdevila, J. J. Roa and M. Segarra, Ceram. Int., 2012, 38, 3713 CrossRef CAS.
- M. Morales, M. A. Laguna-Bercero, M. E. Navarro, F. Espiell and M. Segarra, RSC Adv., 2015, 5, 39350–39357 RSC.
- M. Morales, J. J. Roa, X. G. Capdevila, M. Segarra and S. Piñol, Fuel Cells, 2011, 11, 108–115 CrossRef CAS.
- M. Morales, F. Espiell and M. Segarra, J. Power Sources, 2015, 293, 366–372 CrossRef CAS.
- A. Faes, A. Hessler-Wyser, D. Presvytes, C. G. Vayenas and J. Van Herle, Fuel Cells, 2009, 9, 841–851 CrossRef CAS.
- W. Weibull, J. Appl. Math. Mech., 1951, 18, 293–297 Search PubMed.
- M. Á. Laguna-Bercero, A. Férriz, A. Larrea, L. Correas and V. M. Orera, Fuel Cells, 2013, 13, 1116–1122 CrossRef CAS.
- M. A. Laguna-Bercero, R. Campana, A. Larrea, J. A. Kilner and V. M. Orera, J. Electrochem. Soc., 2010, 157, B852–B855 CrossRef CAS.
- M. Morales, J. J. Roa, X. G. Capdevila, M. Segarra and S. Piñol, J. New Mater. Electrochem. Syst., 2009, 12, 187–193 CAS.
- M. Morales, J. J. Roa, X. G. Capdevila, M. Segarra and S. Piñol, Acta Mater., 2010, 58(7), 2504–2509 CrossRef CAS.
- H. Monzón and M. A. Laguna-Bercero, Int. J. Hydrogen Energy, 2012, 37, 7262–7270 CrossRef.
- A. Faes, A. Hessler-Wyser, A. Zryd and J. Van Herle, Membranes, 2012, 2, 585–664 CrossRef CAS PubMed.
- T. Suzuki, Y. Funahashi, T. Yamaguchi, Y. Fujishiro and M. Awano, J. Power Sources, 2008, 183, 544–550 CrossRef CAS.
| This journal is © The Royal Society of Chemistry 2017 |

