 Open Access Article
Effects of nitroguanidine on the thermal behavior and burning characteristics of 5-amino-1H-tetrazole-based propellants
Cheng-Yang Cao ,
Song Lu*,
Dan Zhang,
Lun-Lun Gong and
He-Ping Zhang*
State Key Laboratory of Fire Science, University of Science and Technology of China, Hefei, Anhui, China. E-mail: lusong@ustc.edu.cn; zhanghp@ustc.edu.cn
First published on 28th February 2017
Abstract
The 5AT/Sr(NO3)2 mixture has recently attracted attention as a gas-generating agent for use in novel fire-suppression applications. However, it cannot provide the desired combustion behavior alone. Thus, nitroguanidine (NQ) was added as a fuel component to 5AT/Sr(NO3)2 in attempt to improve the mixture's combustion behavior. The effects of NQ on the thermal and burning characteristics of 5AT/Sr(NO3)2 were investigated. Thermogravimetry-differential scanning calorimetric (TG-DSC) analysis with four heating rates (5, 10, 15, 20 K min−1) under a nitrogen atmosphere was performed to determine the thermal characteristics and non-isothermal reaction kinetic parameters. The addition of NQ decreases the activation energy of the Stage II and III decomposition reaction, and accelerates the redox reaction and decomposition of Sr(NO3)2. Thermodynamic calculations and measurements of temperature profile and liner burning rates were performed to evaluate the combustion characteristics. Adding NQ decreased the adiabatic combustion temperature, outlet temperature, average flame height, flame oscillation frequency and pressure exponent of Vieille's equation, and increased the gas output and linear burning rate. Notably, mesa burning occurred when NQ was added, the mechanism of which is elaborated using a physical combustion model. The analysis deepens the understanding of when the gas-phase or condensed-phase reactions control the burning characteristics of the composite propellant.
Introduction
Halon agents are effective fire suppressants and are widely used in fire-extinguishing systems. However, the large amount of by-products that halocarbon agents generate has been linked to ozone depletion and the use of halons has now been restricted in all countries following the signing of the Montreal Protocol.1,2 It is therefore urgent to investigate and develop clean and efficient substitute fire-extinguishing technologies. Solid propellant gas generators (SPGGs) were first proposed by Yang and Grosshandler in 1995 and involve solid propellants producing heated gas-phase components that then ignited to extinguish the fire mainly by oxygen-starvation.3 Compared to other fire-suppression techniques, the advantages of SPGGs include: no ozone-depleting or radiative forcing by-products; rapid distribution (typically within 0.1 s); and a compact structure.4,5 Meanwhile, the propulsive performance of SPGGs impacts their suppression effectiveness and depends on the combustion characteristics and the propellant's gas production. To improve firefighting performance, numerous propellant formulations have been proposed and developed to accommodate factors such as higher gas output, lower outlet temperature, a suitable burning rate and better combustion stability.Generally, the gas-generating agent in SPGGs is a mixture of an energetic nitrogenous fuel and an oxidant. One prospective gas generating material is 5-aminotetrazole (5AT), which has a high nitrogen content (82.3% wt), a large positive enthalpy, and a high thermal stability.6 Considerable work has reported on the firefighting performance of SPGGs that consist of 5AT and various oxidants and shown that a 5AT/Sr(NO3)2 mixture is superior to other formulations.7,8 Consequently, 5AT/Sr(NO3)2 has formed the basic formulation for SPGGs in practical use for many years. However, the relatively high gas outlet temperature and poor combustion stability of 5AT/Sr(NO3)2 limit its usefulness for firefighting on aircraft.9 Various additives have been employed to modify the propulsive performance of the propellant, including coolants,10,11 burning rate modifiers,12,13 and low-burning-temperature propellants.14,15 Dey et al.16 found adding biuret to an ammonium perchlorate-based composite propellant decreased the burning rate by almost 60%, reaching the ideal combustion temperature. Zhang et al.10 found that adding 20 wt% CaCO3 to 5AT/Sr(NO3)2 more than halved the burning rate and decreased the adiabatic combustion temperature by 544 K. Although adding coolant can effectively decrease the combustion temperature, this is usually accompanied by a severe decrease in the burning rate. To compensate for this decrease it is common to add a propellant with a low burning temperature to the mixture, which can decrease the quantity of coolant needed while maintaining a relatively high burning rate. Nitroguanidine (NQ) is widely used as a fuel constituent in various propellants because of its ability to decrease the propellant flash and flame temperature without decreasing the chamber pressure.17,18 Wingborg et al.15 reported that adding NQ to an ammonium dinitramide-based propellant could improve its ballistic properties while other work claimed that a propellant mixture of 5AT and NQ has a flame temperature of approximately 2100 K, lower than that of a 5AT-only propellant.19 However, this result was obtained using an approximate thermochemical calculation rather than a direct investigation into how NQ affects the characteristics and mechanism of combustion.
Given that adding NQ could improve the propulsive performance of 5AT/Sr(NO3)2 propellant, this study therefore investigates the thermal behavior and combustion characteristics of such a mixture and provides an initial discussion of the mechanism by which NQ impacts the propellant.
Experimental section
Sample ingredients
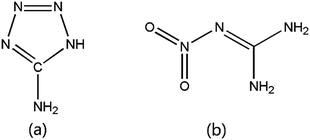
Table 1 presents the ingredients used in this work. The mean particle diameters of 5AT, NQ and Sr(NO3)2 were approximately 60, 25, and 110 μm, respectively. The molecular structures of 5AT and NQ are shown in Fig. 1.| Ingredient | Type | Purity | Source |
|---|---|---|---|
| 5AT | Fuel | ≥99.0% | Dongyang Tianyu Chemical Co., Ltd |
| NQ | Fuel | ≥98.0% | Aladdin Chemical Company |
| Sr(NO3)2 | Oxidizer | ≥99.5% | Tianjin Fengchuan Chemical Reagent Technologies Co., Ltd |
To investigate the effect of NQ on the 5AT/Sr(NO3)2 propellant, two mixtures were prepared: one (P1) contained only 5AT/Sr(NO3)2 while the other (P2) included 10 wt% NQ. The mass fraction of 5AT and Sr(NO3)2 were calculated based on the zero oxygen balance principle.20 The compositions of the mixtures are presented in Table 2.
| Propellant | 5AT | NQ | Sr(NO3)2 |
|---|---|---|---|
| P1 | 36.42 | 0 | 63.58 |
| P2 | 29.83 | 10 | 60.17 |
The propellant mixtures were ground for approximately an hour with a ball mill and then dried in a vacuum thermostat for two hours. The samples were mixed in a planet type grinding mill with ethanol and ground with an agate ball for 12 hours before being dried and ground into a powder. The powders were compressed at approximately 2 MPa for 5 minutes to produce a cylindrical pellet (diameter: 25.5 mm) for the following tests.
Theoretical estimation of propellant performance
There are two widely known limitations in experimentally measuring combustion temperatures: the high temperature and heat transfer rates are difficult to accurately record in the available space and time; and physical intrusion into the combustion process may disrupt its delicate balance.21 To overcome these limitations, various empirical and theoretical calculation methods have been developed to estimate the combustion temperature.22,23The gas output (Vo), adiabatic combustion temperature (Tc), and combustion products of the propellants were theoretically estimated in this study through an initial analysis based on the chemical equilibrium equation was then improved using a Gibbs free energy minimization method. Initial conditions were a combustion pressure of 7.0 MPa, an exit pressure of 0.1 MPa, and an initial temperature of 298.0 K.
Thermal decomposition
The thermal behavior of each of the propellants was measured by thermogravimetry-differential scanning calorimetry (TG-DSC) using a SDT-Q600 thermal analyzer (TA Co., USA). The equipment was operated under flowing nitrogen (100 mL min−1) at atmospheric pressure. A sample mass of 3 to 5 mg was placed in an aluminum oxide crucible and heated from 298 to 1000 K at four different heating rates (β); 5, 10, 15, and 20 K min−1. To mitigate the heterogeneity of the composite propellants, each sample was measured twice consecutively.Flame temperature profile
The flame characteristics of a burning solid propellant and the parameters that influence these characteristics are important in forming a basic understanding of the combustion mechanism.24 Flame temperature profiles were obtained to compare the effect of NQ on the structure and temperature of the flame of the burning samples. The flame structure under atmospheric pressure was recorded using a digital video camera. The flame temperature was measured using four micro-thermocouples (Pt/Pt-Rh13%, time constant: 0.008 s) which were placed parallel to the propellant surface at heights of 0, 1, 2 and 3 cm. The temperature–time data was obtained using an Agilent 34970A instrument.Burning rate
A strand burner and a closed-bomb vessel are the most commonly used apparatus for measuring the burning rates of solid propellants.25,26 Their relatively low cost, simplicity, and ability to quickly achieve robust results mean that they are particularly useful for laboratory-scale evaluation of different propellant formulations.27 The closed bomb set up was chosen over the strand burner because it was faster to use and more able to obtain continuous pressure/burning rate data. Full details of the 700 mL closed bomb apparatus used are described elsewhere.10In brief, each propellant pellet (strand) was placed at the bottom of the vessel with one end then ignited by a 12 V electric match. To mitigate the significant impact of initial temperature on the linear burning rate,28,29 all samples were ignited at 298 K. The side faces of each pellet were coated with a thin layer of epoxy resin to achieve parallel-layer combustion. Each formulation was measured in triplicate with the average values then used in data analysis.
The heat loss (Qloss) during the closed bomb test could lead to subnormal pressure results. The Crow–Grimshaw method was therefore used to provide a rough estimate of the maximum pressure loss rate.30 This was then used to calculate the experimental heat loss rate (Qloss/Qw) using eqn (1).
 | (1) |
Results and discussion
Theoretical propellant performance
Thermodynamic parameters for the different formulations were calculated with the commonly used chemical equilibrium method. First, the stoichiometric combustion equation was written according to the Le-Chatelier and Brinkley–Wilson methods with an oxygen balance of zero, as shown in eqn (2) and (3), respectively:| CH3N5 + 0.7Sr(NO3)2 → CO2 + 3.2N2 + 1.5H2O + 0.7SrO | (2) |
| CH4N4O2 + 0.4Sr(NO3)2 → CO2 + 2.4N2 + 2H2O + 0.4SrO | (3) |
The theoretical calculations then involved three assumptions:31,32 all reaction enthalpies produced by the reactants were completely transferred to products; gas temperatures were homogeneous; and the reaction overall was considered adiabatic.
The absorbed heat at a constant pressure (Qp) could then be written according to the first law of thermodynamics as eqn (4):
| Qp = W + ΔE = PΔV + ΔE | (4) |
The molar enthalpy is defined as H = E + PV, therefore:
| Qp = ΔH | (5) |
The ΔH of reaction was calculated from eqn (6) using the heats of formation and heat capacity values provided in Table 3.
| ΔH = ∑ΔH(products) − ∑ΔH(reactants) | (6) |
| Molecular weight | Standard molar enthalpies of formation (kJ mol−1) | Isobaric specific heat capacity [J (mol K)−1] | |
|---|---|---|---|
| 5AT | 85.07 | 208.74 | — |
| NQ | 104.07 | −91.46 | |
| Sr(NO3)2 | 211.63 | −978.22 | — |
| CO2 | 44.01 | −393.51 | 28.66 + 35.702 × 10⁻³T |
| CO | 28.01 | −110.53 | 26.54 + 7.68 × 10⁻³T |
| H2O | 18.02 | −241.82 | 30.01 + 10.71 × 10⁻³T |
| N2 | 28.01 | 0.00 | 27.87 + 4.27 × 10⁻³T |
| NO | 30.01 | 90.29 | 29.41 + 3.85 × 10⁻³T |
| SrO | 103.62 | −592.04 | 51.61 + 4.68 × 10⁻³T |
| Sr(OH)2 | 121.63 | −595.80 | 95.02 + 2.8 × 10⁻³T |
For the combustion process at a constant pressure, we have:
 | (7) |
Neglecting the dissociation reaction and side reactions means that the calculated combustion temperature will be an overestimate. This was then corrected using a total Gibbs free energy minimization method. For a reactive system with gaseous and condensed-phase combustion products, the total Gibbs free energy (Gtot) of reactive system can be expressed as:33,34
 | (8) |
This equation was solved using the Lagrange multiplier method to yield the equilibrium composition for a given temperature and pressure. These results were then used to correct the adiabatic combustion temperature for the mixture (both of which are shown in Table 4). The P2 mixture exhibited a Tc value that was 46 K lower than that of P1. Although this remained higher than the target value of 2000 K, it could be further decreased by adding coolant. The P2 samples also showed slightly increased molality for CO2 and H2O and a higher gas output of 2.54 mol/(100 g). In summary, although substituting 10 wt% of 5AT with NQ improved the Tc and Vo values, the results still fell short of their targets.
| Mixture | P1 | P2 | |
|---|---|---|---|
| Adiabatic combustion temperature (K) | 2554.07 | 2508.50 | |
| Mainly generated products (mol kg−1) | CO2 | 3.92 | 4.07 |
| CO | 0.36 | 0.39 | |
| H2O | 6.19 | 6.9 | |
| N2 | 13.66 | 13.47 | |
| NO | 0.10 | 0.11 | |
| SrO (s) | 2.91 | 2.73 | |
| Sr(OH)2 | 0.09 | 0.10 | |
| Gas output [mol per (100 g)] | 2.47 | 2.54 | |
Thermal decomposition behavior
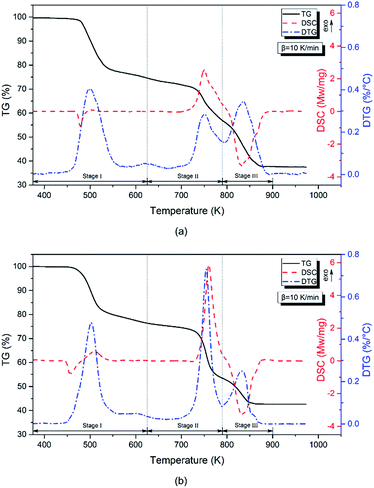
Fig. 2 shows the TG-DTG-DSC curves for the samples at a heating rate of 10 K min−1 under a nitrogen atmosphere. The general information about the thermal behavior of the samples, in terms of percentage mass loss, DTG and DSC peak temperature, is summarized in Table 5. Three distinct stages of mass loss (Stages I–III) were observed during the decomposition process. In Stage I, a weak endothermic peak followed was followed by an exothermic peak in the temperature range of 375–625 K. Stage II ranged from 625–790 K and showed a strong exothermic peak while Stage III ranged from 790–900 K and included an endothermic peak. As Fig. 2 shows, Stages II and III appeared to be influenced by the replacement of 5AT with NQ. The reaction rate of P2 in Stage II was higher than that of P1 while the terminal temperature for P2's Stage III decomposition was lower than that found for P1.| β (K min−1) | Stage I | Stage II | Stage III | ||||||
|---|---|---|---|---|---|---|---|---|---|
| Tp1 (K) | Tp2 (K) | ML (%) | Tp1 (K) | Tp2 (K) | ML (%) | Tp1 (K) | Tp2 (K) | ML (%) | |
| a Tp1 represents the peak temperature of DTG curve, Tp2 represents the peak temperature of DSC curve, ML represents the mass loss. | |||||||||
| P1 | |||||||||
| 5 | 487.6 | 489.8 | 26.1 | 736.3 | 740 | 16.6 | 822.9 | 827.8 | 19.1 |
| 10 | 497.5 | 500.4 | 25.3 | 751.6 | 751.9 | 17.5 | 836.5 | 830.9 | 19.5 |
| 15 | 508.1 | 509.9 | 25.1 | 756.5 | 761.8 | 16.9 | 840.7 | 841.5 | 19.7 |
| 20 | 513.2 | 514.4 | 24.9 | 760.8 | 762.4 | 17.7 | 851.6 | 854.2 | 18.9 |
![[thin space (1/6-em)]](https://www.rsc.org/images/entities/char_2009.gif) |
|||||||||
| P2 | |||||||||
| 5 | 490.8 | 497.8 | 24.6 | 740 | 744 | 22.1 | 816.5 | 822.8 | 10.5 |
| 10 | 502.5 | 509.8 | 23.5 | 754.4 | 760.2 | 22.9 | 832.7 | 836 | 10.9 |
| 15 | 509.9 | 519.2 | 23.7 | 761.1 | 767.9 | 20.8 | 842.8 | 847.4 | 12.8 |
| 20 | 515.4 | 527.1 | 23.7 | 766 | 773.4 | 20.2 | 849.9 | 853.3 | 12.1 |
For P1, Stage I showed an endothermic peak at approximately 477 K and a weak exothermic peak at approximately 500 K which corresponded to the melting and decomposition of 5AT, respectively. When NQ was added to the mixture, the endothermic peak emerged at 456 K because NQ has a lower melting point than 5AT. Previous studies suggest that between 375 and 625 K the mass loss of 5AT and NQ is 60 and 75%, respectively.35,36 In the current work, the mass loss of P1 and P2 across this range was 25.3% and 23.5%, respectively. Although calculations showed that the mass loss of P2 was below that expected, the maximum DTG rate for P2 was 0.48% K−1, which was higher than that for P1. Meanwhile, the exothermic peak was found at higher temperature in the DSC curve, suggesting that NQ melted and decomposed first with the decomposition of 5AT then retarded. This may be explained by considering that some 5AT could have been covered by the melting layer of NQ's pyrolysis products, which would have obstructed heat transfer to the 5AT.
In Stage II, the main exothermic peak occurred at approximately 753 K, with rapid mass losses of 17.5% and 22.9% for P1 and P2, respectively, during this stage. Previous work36,37 suggested that the decomposition process within this temperature range was mainly caused by the condensation reaction of melamine, a pyrolysis product produced by both 5AT and NQ in Stage I. Meanwhile, it was found that the total variation in mass loss at the end of Stage II, which was bigger than the mass ratio of fuel, indicating partial decomposition of the oxidizer. This could suggest that the stage's dominant reaction is the redox reaction of 5AT/Sr(NO3)2 and NQ/Sr(NO3)2. A final observation for this stage was that the addition of NQ appeared to accelerate the reactions here resulting in an increased maximum DTG value (from 0.28 to 0.73% K−1) and a sharper DSC peak.
In Stage III, a strong endothermic peak was observed at approximately 833 K, with a mass loss of 19.5% for P1, and 10.9% for P2. Sr(NO3)2 is known to decompose at approximately 875 K with polycondensation reactions taking place during the decomposition process of 5AT and NQ above 720 K.38 The polymerized products (melon and melon-like substances) are thermally stable up to at least 973 K, so the mass loss in this stage mainly resulted from the decomposition of Sr(NO3)2. For P1 and P2 the maximum DTG values were 0.34 and 0.25% K−1. The terminal temperature of P2 was 854 K, 31 K lower than that of P1, indicating that the decomposition of Sr(NO3)2 was accelerated by the addition of NQ.
For composite propellants, the decomposition gases diffuse to the gas phase before being burnt. Decomposition at a lower temperature means the decomposition gas could probably have reacted at a lower temperature as well.39 Moreover, the formation of polymer products can sometimes suppress the burning rate and enhance plateau burning.40 Therefore, the existence of NQ could have lowered the ignition temperature of the 5AT/Sr(NO3)2 mixture, and possibly influenced the burning rate and flame characteristics at specific pressure zone.
Non-isothermal reaction kinetics
To provide more detail of the decomposition mechanism, the Kissinger method was employed to calculate the activation energy (Ea) and pre-exponential factor (A).41,42 The calculation uses eqn (9) and the DTG results.
 | (9) |
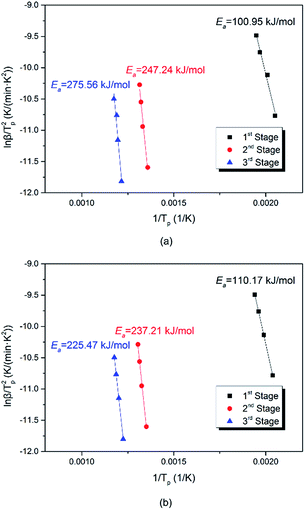
Ea and A for each stage were calculated using the Tp and β values listed in Table 5 to produce the plots of ln(β/Tp2) against 1/Tp for each sample that are shown in Fig. 3. The Ea results presented in Table 6 were obtained using the slope of the line and eqn (10). The high r2 values show the applicability of the Kissinger method.
| Ea = −slope × R | (10) |
| Propellant | Stage | Ea (kJ mol−1) | log![[thin space (1/6-em)]](https://www.rsc.org/images/entities/char_2009.gif) A[1/S] A[1/S] |
r2 |
|---|---|---|---|---|
| P1 | 1 | 100.95 | 16.68 | 0.9837 |
| 2 | 247.24 | 32.14 | 0.9773 | |
| 3 | 275.56 | 32.00 | 0.9641 | |
| P2 | 1 | 110.17 | 18.80 | 0.9998 |
| 2 | 237.21 | 30.28 | 0.9947 | |
| 3 | 225.49 | 24.72 | 0.9999 |
As shown in Table 6, adding NQ slightly increased the activation energy in Stage I, but decreased it in Stages II and III. Taken with the analysis above, these results confirmed that adding NQ retarded the decomposition of 5AT and catalyzed the redox reaction. Moreover, P2's Stage III activation energy was significantly (50 kJ mol−1) lower than that of P1, which, along with the lower terminal temperature, potentially suggested that the Sr(NO3)2 decomposition reaction may be catalyzed.
Temperature profile
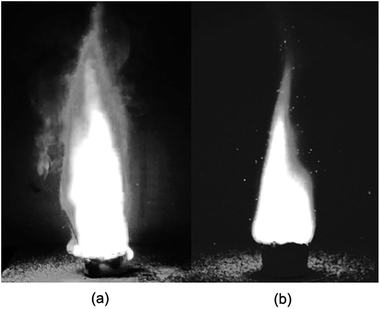
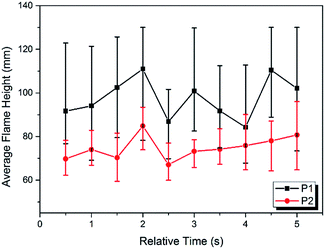
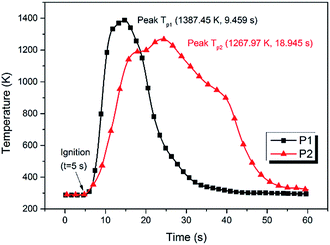
The images of the flames during propellant combustion are shown in Fig. 4. For P1 a typical premixed flame structure was observed and a crater-shaped solid residue was formed at the burning surface, which had a loose and porous structure which likely benefitted gaseous diffusion. The combustion of P2 showed a thinner gas-phase layer, which may have been caused by the existence of a melting layer retarding gas flow. The average flame height during the stable combustion stage was lower for P2 than for P1, as shown in Fig. 5. Moreover, fast Fourier transform (FTT) calculations using the flame height data showed that the flame oscillation for P1 and P2 were 5.19 and 3.58 Hz, respectively, indicating adding NQ resulted in a smoother and more homogeneous flame. Taken together, these results suggested that the addition of NQ could improve the performance of the gas-generating agent used in SPGG.The temperature measurements were corrected for heat loss by radiation using an estimated error of +33 K at 1100 K. The corrected temperature measurement results showed that the peak flame temperature was reached in the luminous zone, which is plotted for both mixtures in Fig. 6. Peak temperatures of 1387 and 1268 K for P1 and P2, respectively, indicated that adding NQ decreased the flame temperature. The time from ignition to peak flame temperature for P2 was double that of P1 (18.9 and 9.5 s, respectively) with the P2 flame lasting almost 15 s longer and suggesting a lower, more stable burning.
Burning rate characteristics
For a solid propellant, the relation between the burning rate (μ) and pressure (P) can be described by Vieille's law:| μ = aPn | (11) |
 | (12) |
From the experimental pressure–time curve, the volumetric fraction of burnt propellant (ϕ) can be calculated using a transformed, constant volume version of the Noble–Abel equation:45
 | (13) |
 | (14) |
Meanwhile, the relation between and z can be expressed as eqn (15) according to the geometric burning law.46
| ϕ = χz(1 + λz + εz2) | (15) |
The calculated parameters for each sample are listed in Table 7.
| Parameter | Symbol | P1 | P2 |
|---|---|---|---|
| Impetus | f (kJ kg−1) | 0.322 | 0.190 |
| Co-volume | α (m3 kg−1) | 0.012 | 0.020 |
| Density | ρ (kg m−3) | 1379 | 1443 |
| Loading density | Δ (kg m−3) | 20.891 | 22.596 |
| Shape characteristic parameters | χ | 3.227 | 3.187 |
| λ | −1.070 | −1.059 | |
| ε | 0.380 | 0.372 |
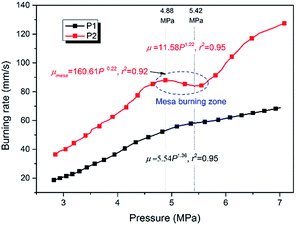
Using eqn (12)–(15), the pressure–time data obtained from the closed bomb was used to derive the burning rate, which was then fitting to eqn (11) to obtain the pressure exponent. Comparing the results with parallel layer combustion theory47 suggested that the calculated burning rate was credible with pressure ranging from a point where ϕ = 0.15 to a point defined by (dϕ/dt)max. Considering the actual working pressure for SPGGs,48 the burning rate was plotted for the range 2.8–7 MPa in Fig. 7 with the relative parameters listed in Table 8.
| Propellant | Pressure range (MPa) | Expression | r2 |
|---|---|---|---|
| P1 | 2.8–7.0 | μ = 5.54P1.36 | 0.95 |
| P2 | 2.8–7.0 | μ = 11.58P1.22 | 0.95 |
| 4.9–5.4 | μmesa = 160.61P−0.22 | 0.92 |
As Fig. 7 shows, the burning rate of P1 steadily increased with increasing pressure. The pressure exponent was found to be 1.36 which was consistent with other studies showing that 5AT/Sr(NO3)2 propellants have relatively high pressure exponents, meaning that it is difficult to control their combustion progress. For P2, the addition of NQ significantly changed the burning rate profile across the pressure range. The burning rate was higher-increasing 75% and 60% at 4 and 6 MPa, respectively – the pressure exponent lower (1.22), and a mesa burning phenomenon, which is favorable in the design of gas-generating agents, was observed at 4.9–5.4 MPa. Within this mesa burning zone the pressure exponent was −0.22, which is highly beneficial for gas-generating agents.
Mechanism of burning rate enhancement by NQ
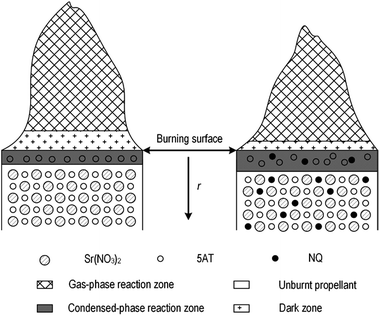
Burning rate characteristics are by impacted by the process' heat release, the burning rate of the monopropellant, the formation of a surface melting layer, and the gas diffusion process.49 Present results were combined with those from a previous study7,23 to create the simplified physical combustion model that explains the impact on burning rate characteristics illustrated in Fig. 8. The model consists of unburnt propellant, a condensed-phase reaction zone, a dark zone and a gas reaction zone and can be explained as such: after ignition, the propellant is heated and a part of the fuels is decomposed at the burning surface, which forms a melting layer in the condensed-phase zone. With enough combustible gas decomposition products (for example, HN3 and NH3) diffusing into the gas reaction zone, the gas-phase combustion reaction can take place. The heat produced by combustion is then transferred to the burning surface and accelerates the decomposition of the propellant. Unburnt propellant heated by these exothermic reactions then starts to melt and decompose. This maintains the combustion process and shifts the burning surface to the unburnt propellant, with the burning front then progressing uniformly along the pellet.Using the model to explain the experimental results, the addition of NQ thickened the melting layer because of the decomposition of NQ, which restricted the diffusion of gas products and decreased the quantity of heat transferred from the gas reaction zone to the burning surface. However, because of its lower activation energy and melting temperature, NQ was more easily decomposed than 5AT. Thus, although the thicker melting layer partly retarded the 5AT decomposition process, the amount of combustible gases produced from the overall decomposition increased. This meant that the burning rate of propellant accelerated when NQ was present because the gas phase reaction dominates control of the burning rate at low pressures. At higher pressures the condensed phase reaction controls the burning rate, and here the retardation caused by NQ cannot be neglected, which is why the burning rate decreased (mesa burning). As pressure was further increased, the melting layer became thinner and the gas-phase reaction zone was forced closer to the burning surface. This caused the balance between NQ's accelerating and decelerating impacts to switch and the burning rate again increased once the pressure was above 5.4 MPa.
Conclusion
To improve the propulsive performance of gas-generating agents used in SPGGs, NQ was used to partially substitute 5AT in the 5AT/Sr(NO3)2 propellant. The effects of adding NQ on the thermal behavior and burning characteristics were investigated theoretically and experimentally and the mechanism by which NQ enhances the burning rate was also explored. The following conclusions can be drawn:(1) In general, adding NQ accelerates the burning rate, and decreases the pressure exponent of 5AT-based propellants. However, NQ impacted the burning rate differently depending on the combustion pressure. NQ was found to enhance the gas-phase reaction for pressures of 2.8 to 4.9 MPa, and to retard the condensed-phase reaction for pressures of 4.9 to 7.0 MPa. This led to a mesa burning phenomenon occurring at 4.9–5.4 MPa.
(2) Adding NQ decreased the adiabatic combustion temperature and the outlet temperature because of the low combustion temperature of NQ and the catalytic effect of NQ on the endothermic decomposition of Sr(NO3)2.
(3) Adding NQ improved the combustion characteristics because of the melting layer formed during the decomposition of NQ. The average flame height and flame oscillation frequency both decreased, suggesting more stable combustion.
In summary, NQ has been shown to be effective at improving the thermal behavior and burning characteristics of a 5AT-based propellant, which could be useful for SPGG applications. Further work will investigate the thermal behavior at higher pressures, and the chemical mechanisms underpinning NQ's impact on the burning rate of 5AT-based propellants.
Acknowledgements
This study was supported by the Fundamental Research Funds for the Central Universities WK2320000028, WK6030000030, and WK2320000030.References
- B. Moghtaderi, B. Dlugogorski and E. Kennedy, Dev. Chem. Eng. Miner. Process., 2000, 8, 113–128 CrossRef.
- U. Stoin, A. I. Shames and Y. Sasson, RSC Adv., 2013, 3, 24440–24446 RSC.
- J. C. Yang and W. L. Grosshandler, International Conference on Fire Research and Engineering, 1995 Search PubMed.
- A. Kim, Z. Liu and G. Crampton, Progress in Safety Science and Technology: Proceedings of the 2004 International Symposium on Safety Science and Technology, 2004, vol. 4, pp. 1070–1074 Search PubMed.
- S. E. Hodges and S. J. McCormick, Fire Technol., 2013, 49, 379–394 CrossRef.
- J. C. Gálvez-Ruiz, G. Holl, K. Karaghiosoff, T. M. Klapötke, K. Löhnwitz, P. Mayer, H. Nöth, K. Polborn, C. J. Rohbogner and M. Suter, Inorg. Chem., 2005, 44, 4237–4253 CrossRef PubMed.
- Y. Miyata and K. Hasue, Propellants, Explos., Pyrotech., 2004, 29, 247–252 CrossRef CAS.
- T. W. Xu, Z. M. Du and M. M. Wang, Adv. Mater. Res., 2014, 1004, 719–725 CrossRef.
- A. Hamins, T. G. Cleary and J. Yang, An Analysis of the Wright Patterson Full-scale Engine Nacelle Fire Suppression Experiments, US Department of Commerce, Technology Administration, National Institute of Standards and Technology, 1997 Search PubMed.
- D. Zhang, S. Lu, L.-L. Gong, C.-Y. Cao and H.-P. Zhang, Energy Convers. Manage., 2016, 109, 94–102 CrossRef CAS.
- A. Dey, J. Athar, P. Varma, H. Prasant, A. K. Sikder and S. Chattopadhyay, RSC Adv., 2015, 5, 1950–1960 RSC.
- T. Wei, Y. Zhang, K. Xu, Z. Ren, H. Gao and F. Zhao, RSC Adv., 2015, 5, 70323–70328 RSC.
- K. D. Grossman, T. S. Sakthivel, C. Dillier, E. L. Petersen and S. Seal, RSC Adv., 2016, 6, 89635–89641 RSC.
- S. Yoshino and A. Miyake, J. Therm. Anal. Calorim., 2010, 102, 513–516 CrossRef CAS.
- N. Wingborg, J. Johansson, M. Johansson, M. Liljedahl, A. Lindborg, C. Oscarson, Å. Pettersson and M. Sjöblom, in 49th AIAA/ASME/SAE/ASEE Joint PropulsionConference, 2013, p. 3723 Search PubMed.
- A. Dey, V. G. Ghorpade, A. Kumar and M. Gupta, Cent. Eur. J. Energ. Mater., 2014, 11, 3–13 CAS.
- A. McKay, Chem. Rev., 1952, 51, 301–346 CrossRef CAS.
- X. Zhang, L. Zheng and Y. He, Plasmonics, 2016, 11, 1573–1578 CrossRef CAS.
- E. O. Hosey, U.S. Patent Application No. 11/778,222, 2007.
- R. Li, X. Li and X. Xie, Combust., Explos. Shock Waves, 2006, 42, 607–610 CrossRef.
- A. C. Eckbreth, Laser diagnostics for combustion temperature and species, CRC Press, 1996 Search PubMed.
- D. Zhang, S. Lu, C.-Y. Cao, C.-C. Liu, L.-L. Gong and H.-P. Zhang, Fuel, 2017, 191, 371–382 CrossRef CAS.
- L. B. Whitson Jr and S. F. Son, Combust. Theory Modell., 2016, 20, 58–76 CrossRef.
- A. J. Sabadell and J. Wenograd, The Measurement of the Temperature Profiles of Burning Solid Propellants by Microthermocouples, DTIC Document, 1963 Search PubMed.
- M. A. Cooper and M. S. Oliver, Combust. Flame, 2013, 160, 2619–2630 CrossRef CAS.
- S. Shioya, M. Kohga and T. Naya, Combust. Flame, 2014, 161, 620–630 CrossRef CAS.
- G. Gupta, L. Jawale, D. Mehilal and B. Bhattacharya, Cent. Eur. J. Energ. Mater., 2015, 12, 593–620 Search PubMed.
- L.-L. Liu, G.-Q. He, Y.-H. Wang and S.-Q. Hu, RSC Adv., 2015, 5, 101416–101426 RSC.
- E. Degirmenci, Fuel, 2015, 146, 95–102 CrossRef CAS.
- E. Freedman, BLAKE-A Thermodynamics Code Based on TIGER: Users' Guide and Manual, DTIC Document, 1982 Search PubMed.
- C. Tang, J. Zheng, Z. Huang and J. Wang, Energy Convers. Manage., 2010, 51, 288–295 CrossRef CAS.
- T. Zhang, G. Li, Y. Yu, Z. Sun, M. Wang and J. Chen, Energy Convers. Manage., 2014, 87, 965–974 CrossRef CAS.
- S. Jarungthammachote and A. Dutta, Energy Convers. Manage., 2008, 49, 1345–1356 CrossRef CAS.
- Q. Wu, W. Zhu and H. Xiao, RSC Adv., 2014, 4, 3789–3797 RSC.
- G. Leiper and J. Cooper, Propellants, Explos., Pyrotech., 1997, 22, 347–350 CrossRef CAS.
- V. G. Kiselev and N. P. Gritsan, J. Phys. Chem. A, 2009, 113, 3677–3684 CrossRef CAS PubMed.
- J. C. Oxley, J. L. Smith, M. A. Donnelly, K. Colizza and S. Rayome, Propellants, Explos., Pyrotech., 2015, 41, 98–113 CrossRef.
- P. J. Haines, Thermal methods of analysis: principles, applications and problems, Springer Science & Business Media, 2012 Search PubMed.
- A. A. Vargeese, Combust. Flame, 2016, 165, 354–360 CrossRef CAS.
- G. Williams, S. Palopoli and T. Brill, Combust. Flame, 1994, 98, 197–204 CrossRef.
- H. E. Kissinger, Anal. Chem., 1957, 29, 1702–1706 CrossRef CAS.
- D. Kumari, S. Anjitha, C. S. Pant, M. Patil, H. Singh and S. Banerjee, RSC Adv., 2014, 4, 39924–39933 RSC.
- H. Yaman, V. Çelik and E. Değirmenci, Fuel, 2014, 115, 794–803 CrossRef CAS.
- W. F. Oberle, A. A. Juhasz and T. M. Griffie, A Simplified Computer Code for Reduction to Burning Rates of Closed Bomb Pressure-Time Data (MINICB), DTIC Document, 1987 Search PubMed.
- S. Liao, D. Jiang, Z. Huang, W. Shen, C. Yuan and Q. Cheng, Energy Convers. Manage., 2007, 48, 857–863 CrossRef CAS.
- Z. Jin and C. Weng, Advanced interior ballistics, Higher Education Press, Beijing, 2003 Search PubMed.
- V. Babuk, I. Dolotkazin, A. Gamsov, A. Glebov, L. DeLuca and L. Galfetti, J. Propul. Power, 2009, 25, 482–489 CrossRef CAS.
- A. Kim, Z. Liu and G. Crampton, Fire Technol., 2007, 43, 145–172 CrossRef.
- J. Zhen, The Properties and Formulation Design Expert System of High Energy Solid Propellants, National Defense Industry Press, Beijing, 2014 Search PubMed.
| This journal is © The Royal Society of Chemistry 2017 |

