 Open Access Article
Biobased copolyesters: synthesis, crystallization behavior, thermal and mechanical properties of poly(ethylene glycol sebacate-co-ethylene glycol 2,5-furan dicarboxylate)
Guoqiang Wang ,
Min Jiang,
Qiang Zhang,
Rui Wang and
Guangyuan Zhou*
Changchun Institute of Applied Chemistry, Chinese Academy of Science, Changchun 130022, China. E-mail: gyzhou@ciac.ac.cn
First published on 1st March 2017
Abstract
A series of biobased copolyesters, poly(ethylene sebacate-co-ethylene 2,5-furandicarboxylate) (PESF), were synthesized from available biobased ethylene glycol (EG), sebacic acid (SA) and 2,5-furandicarboxylic acid (FDCA) through a two-step melt polycondensation method. The composition, molecular weight and its distribution, crystal structure, and crystallization behavior of PESFs were investigated by 1H NMR, GPC, WAXD, and DSC methods, respectively. Tensile properties were also evaluated. While increasing the content of the FDCA unit, the glass transition temperatures of PESFs increased and the crystallization rates of PESFs decreased. Compared with poly(ethylene sebacate) (PES), PESF20 showed two melting peaks due to the formation of secondary crystals (small and imperfects crystals) caused by the incorporation of FDCA during the isothermal crystallization process. POM data showed that the nucleation density of PESF10 and PESF20 increased and the size of spherulites decreased due to the chain irregularity caused by randomization distribution with the introduction of FDCA. However, the crystal structure remained unchanged. Ring-banded spherulites were not detected for PESF20 in a wide temperature range (28–44 °C) as the incorporation of FDCA can restrict lamellar twisting and scrolling of PES segments. The thermal transition and mechanical properties of copolymers are tunable with the composition.
1. Introduction
Recently, biobased polymers have become an effective substitute for fossil-based polymers, which have gained more attention due to the inevitable depletion of fossil resources and environmental pollution.1–4 A particularly attractive class of biobased polymers are aliphatic polyesters. Aliphatic polyesters such as polyhydroxyalkanoates (PHA), polylactic acid (PLA), poly(butylene succinate) (PBS) and polycaprolactone (PCL) attract considerable attention due to their biodegradability and biobased origin. There are many biobased diacid and diol monomers, such as succinic acid, 1,3-propanediol, 1,4-butanediol (BDO), and lactic acid.5–8 Among them, sebacic acid (SA), a naturally occurring dicarboxylic acid, is an intermediate product of u-oxidization of long chain aliphatic acids.9 Compared with short chain diacids, sebacic acid is more suitable for the preparation of polyesters due to a long –(CH2)– sequence and can prevent intra-molecular cyclization. Moreover, SA has a long enough series of –CH2– groups, which can improve the liquidity and crystal quality of polyester. Ethylene glycol (EG) drived from the product of cracking of sorbitol is also a biobased monomer. Compared with BDO, EG is more suitable for the preparation of polyesters and can prevent intra-molecular cyclization.Although biobased poly(ethylene sebacate) (PES) derived from sebacic acid and ethylene glycol has been synthesized,10,11 the thermal properties, durability, and mechanical properties of PES are unsatisfactory in some applications like other aliphatic polyesters. An efficient strategy to improve the performance of aliphatic polyesters is to introduce some rigid molecular structure into the polymeric backbone. Recently, isosorbide has gained more attention due to two cis-fused tetrahydrofuran rings. However, the hydroxyl group in endo position is easier to form intra-molecular hydrogen bond with the oxygen in the other ring, which leads to the poor reactivity of the secondary hydroxyl group and the low number average molecular weights of copolyesters (<18![[thin space (1/6-em)]](https://www.rsc.org/images/entities/char_2009.gif) 000 g mol−1).9 2,5-Furandicarboxylic acid (FDCA) is another important biological monomer with furan ring, which can be produced from cellulose.12–14 Previous approaches to synthesizing FDCA use dehydration processes to convert hexose sugars into hydroxymethyl furfural (HMF), which is then oxidized to form FDCA. However, it is not the most desired route due to the expensive purification procedures for synthesizing HMF. Recently, since 2-furoic acid can readily be made from lignocellulose,15 Banerjee provides a new way to transform inedible biomass and CO2 into FDCA.16 FDCA has been highlighted as biobased replacement of fossil-based terephthalic acid (TPA).17–22 Therefore, FDCA is an ideal candidate satisfied the above-mentioned issues.
000 g mol−1).9 2,5-Furandicarboxylic acid (FDCA) is another important biological monomer with furan ring, which can be produced from cellulose.12–14 Previous approaches to synthesizing FDCA use dehydration processes to convert hexose sugars into hydroxymethyl furfural (HMF), which is then oxidized to form FDCA. However, it is not the most desired route due to the expensive purification procedures for synthesizing HMF. Recently, since 2-furoic acid can readily be made from lignocellulose,15 Banerjee provides a new way to transform inedible biomass and CO2 into FDCA.16 FDCA has been highlighted as biobased replacement of fossil-based terephthalic acid (TPA).17–22 Therefore, FDCA is an ideal candidate satisfied the above-mentioned issues.
In our previous report, lots of FDCA-based polyesters have been prepared, involving poly(ethylene 2,5-furandicarboxylate), poly(trimethylene 2,5-furandicarboxylate), poly(butylene 2,5-furandicarboxylate), poly(hexylene 2,5-furandicarboxylate), and poly(octylene 2,5-furandicarboxylate).20 In the present paper, in order to improve the thermal and mechanical properties of PES, we further synthesized a series of new biobased copolyesters poly(ethylene sebacate-co-ethylene 2,5-furandicarboxylate) (PESFs). The effects of FDCA on the microstructure, thermal and mechanical properties of copolyesters were emphasized. Additionally, since the physical properties of polymers greatly depend on the spherulite morphology, crystal structure and degree of crystallinity, the crystallization behavior of copolyesters were also investigated. It was found that their properties varied from thermoplastics to elastomers with the copolymer composition. It is expected that the results will be of great help to understanding the relationships between structures and properties in the case of aliphatic–aromatic copolyesters with incorporated FDCA.
2. Experimental
2.1 Materials
Sebacic acid (SA, 99%) and tetrabutyl titanate (99%), were purchased from Tianjin Guangfu Fine Chemical Research Institute. Ethylene glycol (EG, 99%), was purchased from Beijing Chemical Works. 2,5-Furandicarboxylic acid (FDCA, 99.5%), was purchased from Chinese University of Science and Technology. All other regents were used as received.2.2 Synthesis of copolyesters
PESFs were synthesized by a two-step esterification and polycondensation process, as depicted in Scheme 1. The molar ratio of EG![[thin space (1/6-em)]](https://www.rsc.org/images/entities/char_2009.gif) :
:![[thin space (1/6-em)]](https://www.rsc.org/images/entities/char_2009.gif) (SA + FDCA) was 1.6
(SA + FDCA) was 1.6![[thin space (1/6-em)]](https://www.rsc.org/images/entities/char_2009.gif) :
:![[thin space (1/6-em)]](https://www.rsc.org/images/entities/char_2009.gif) 1 and appropriate amount of tetrabutyl titanate was used as a catalyst. During the first stage (esterification process), the mixture was heated at 190 °C under a nitrogen atmosphere for 1 h, at 210 °C for additional 1–3 h. In the polycondensation step, the pressure was reduced to 100 Pa and the temperature was raised up to 230 °C to completely remove the byproduct and the unreacted monomers, and the polycondensation was continued for 5 h. Poly(ethylene sebacate) (PES) and poly(ethylene 2,5-furandicarboxylate) (PEF) were also prepared by a similar synthetic procedure for comparison. The samples with various feed ratios are displayed in Table 1.
1 and appropriate amount of tetrabutyl titanate was used as a catalyst. During the first stage (esterification process), the mixture was heated at 190 °C under a nitrogen atmosphere for 1 h, at 210 °C for additional 1–3 h. In the polycondensation step, the pressure was reduced to 100 Pa and the temperature was raised up to 230 °C to completely remove the byproduct and the unreacted monomers, and the polycondensation was continued for 5 h. Poly(ethylene sebacate) (PES) and poly(ethylene 2,5-furandicarboxylate) (PEF) were also prepared by a similar synthetic procedure for comparison. The samples with various feed ratios are displayed in Table 1.
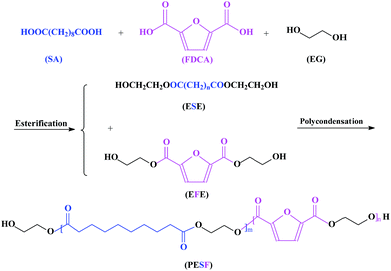 | ||
| Scheme 1 Synthesis of PESFs copolyesters from EG, SA and FDCA via two-step esterification–polycondensation procedure. | ||
| Sample | ΦEF in feed (mol%) | 1H NMR | 1H NMR | Mn (g mol−1) | Mw (g mol−1) | PDI | ||
|---|---|---|---|---|---|---|---|---|
| ΦEF in copolymer (mol%) | Ln,ES | Ln,EF | R | |||||
| PES | 0 | 0 | — | — | — | 48![[thin space (1/6-em)]](https://www.rsc.org/images/entities/char_2009.gif) 200 200 |
96![[thin space (1/6-em)]](https://www.rsc.org/images/entities/char_2009.gif) 000 000 |
2.00 |
| PESF10 | 10 | 11.2 | 10.5 | 1.1 | 1.00 | 56![[thin space (1/6-em)]](https://www.rsc.org/images/entities/char_2009.gif) 200 200 |
113![[thin space (1/6-em)]](https://www.rsc.org/images/entities/char_2009.gif) 000 000 |
2.02 |
| PESF20 | 20 | 15.7 | 5.1 | 1.1 | 1.11 | 54![[thin space (1/6-em)]](https://www.rsc.org/images/entities/char_2009.gif) 400 400 |
147![[thin space (1/6-em)]](https://www.rsc.org/images/entities/char_2009.gif) 000 000 |
2.70 |
| PESF30 | 30 | 33.7 | 4.2 | 1.4 | 0.95 | 28![[thin space (1/6-em)]](https://www.rsc.org/images/entities/char_2009.gif) 100 100 |
76![[thin space (1/6-em)]](https://www.rsc.org/images/entities/char_2009.gif) 100 100 |
2.00 |
| PESF40 | 40 | 37.7 | 2.4 | 1.6 | 1.04 | 33![[thin space (1/6-em)]](https://www.rsc.org/images/entities/char_2009.gif) 300 300 |
64![[thin space (1/6-em)]](https://www.rsc.org/images/entities/char_2009.gif) 200 200 |
1.93 |
| PESF50 | 50 | 54.4 | 2.0 | 1.9 | 1.03 | 138![[thin space (1/6-em)]](https://www.rsc.org/images/entities/char_2009.gif) 000 000 |
328![[thin space (1/6-em)]](https://www.rsc.org/images/entities/char_2009.gif) 000 000 |
2.36 |
| PESF60 | 60 | 62.8 | 1.7 | 2.3 | 1.04 | 53![[thin space (1/6-em)]](https://www.rsc.org/images/entities/char_2009.gif) 000 000 |
115![[thin space (1/6-em)]](https://www.rsc.org/images/entities/char_2009.gif) 000 000 |
2.16 |
| PESF70 | 70 | 71.3 | 1.4 | 3.1 | 1.03 | 123![[thin space (1/6-em)]](https://www.rsc.org/images/entities/char_2009.gif) 000 000 |
300![[thin space (1/6-em)]](https://www.rsc.org/images/entities/char_2009.gif) 000 000 |
2.44 |
| PESF80 | 80 | 83.0 | 1.2 | 3.3 | 1.11 | 81![[thin space (1/6-em)]](https://www.rsc.org/images/entities/char_2009.gif) 000 000 |
197![[thin space (1/6-em)]](https://www.rsc.org/images/entities/char_2009.gif) 000 000 |
2.43 |
| PESF90 | 90 | 91.5 | 1.1 | 8.0 | 1.01 | 64![[thin space (1/6-em)]](https://www.rsc.org/images/entities/char_2009.gif) 600 600 |
146![[thin space (1/6-em)]](https://www.rsc.org/images/entities/char_2009.gif) 000 000 |
2.26 |
| PEF | 100 | 100 | — | — | — | 103![[thin space (1/6-em)]](https://www.rsc.org/images/entities/char_2009.gif) 000 000 |
252![[thin space (1/6-em)]](https://www.rsc.org/images/entities/char_2009.gif) 000 000 |
2.44 |
2.3 Characterization
Weight-average molecular weight (Mw), number-average molecular weight (Mn), and their distribution (PDI) were obtained by Waters gel permeation chromatography (GPC). 1,1,1,3,3,3-Hexafluoro-2-propanol (HFIP) was used as solvent and polystyrene standards were used for calibration.FT-IR spectra were recorded in the range 4000–400 cm−1 with a Bruker IFS 66V in KBr and polyethylene medium.
1H NMR spectra were recorded on a Bruker Avance 600 MHz apparatus, using trifluoroacetic acid-d (CF3COOD) as solvent for all samples.
Thermogravimetric analysis (TGA) of PESFs was performed by the Mettler Instrument from 30 to 600 °C at a heating rate of 10 °C min−1 under a air flow.
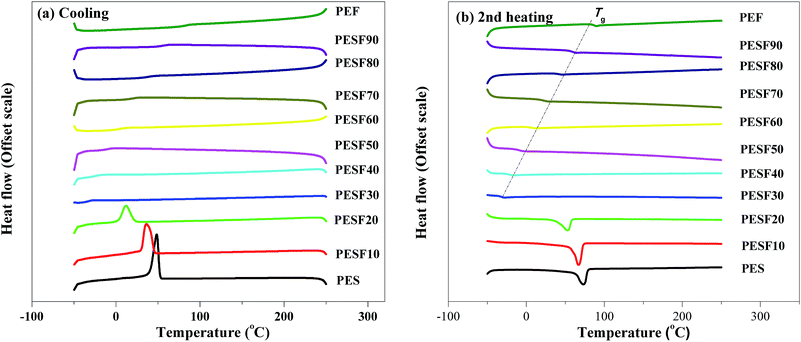
Differential scanning calorimetry (DSC) measurements were carried out with a Mettler Instrument under a nitrogen flow. The samples were heated for the first run from −50 to 250 °C, at 250 °C for 5 min to erase the thermal history, then cooled to −50 °C at a rate of 10 °C min−1, and heated again for the second run from −50 to 250 °C at a rate of 10 °C min−1. For the investigation of isothermal crystallization kinetics, the samples were initially melted at 100 °C for 5 min, then quenched to the desired crystallization temperature at a rate of 60 °C min−1. After the completion of isothermal crystallization, the samples were directly heated to the melt at a rate of 10 °C min−1. The heat flows during both crystallization and melting processes were recorded for the later kinetics analysis of isothermal crystallization and the estimation of the equilibrium melting point.
Wide-angle X-ray diffraction (WAXD) patterns were recorded on a Bruker D8 focus, using Cu-Kα radiation in the scan ranged from 5° to 45° (λ = 0.154 nm).
Spherulite morphologies of the copolyesters were observed by a Leica DM 2500P polarized optical microscope (POM) equipped with a Linkam LTS350 hot stage. The samples were placed between two cover glasses, melted and pressed at 100 °C for 5 min, then quenched to predetermined temperature (Tc) for isothermal crystallization, and the representative spherulitic morphologies were recorded.
Tensile tests were done with Instron-1121 tester at 25 °C in accordance with ASTM D638. The crosshead speed was 5 mm min−1. The dumbbell-shaped samples of 4 mm width, and 2 mm thickness were made by a HAAKE MiniJet Injection moulding machine. At least three specimens were tested for each sample. The Young's modulus, tensile strength and elongation at break were obtained.
3. Results and discussion
3.1 Synthesis and characterization of copolyesters
Biobased copolyesters PESFs were synthesized by a traditional two-step melt esterification and polycondensation process, as shown in Scheme 1. The molecular characteristics obtained by GPC are summarized in Table 1. The number average molecular weight (Mn) ranges from 28![[thin space (1/6-em)]](https://www.rsc.org/images/entities/char_2009.gif) 100 to 138
100 to 138![[thin space (1/6-em)]](https://www.rsc.org/images/entities/char_2009.gif) 000 g mol−1 and polydispersity ranged from 1.9 to 2.7.
000 g mol−1 and polydispersity ranged from 1.9 to 2.7.
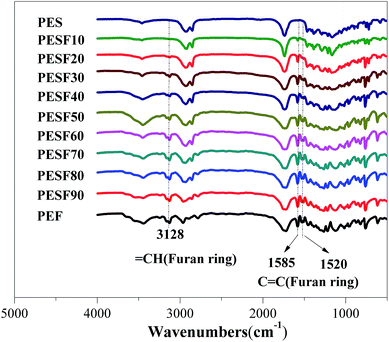
The chemical structure and composition of PESFs were determined by FTIR and 1H NMR. Fig. 1 shows the FTIR spectra of PES, PEF and PESFs. The strong absorption at 1735 cm−1 is attributed to the ester bonds (νC![[double bond, length as m-dash]](https://www.rsc.org/images/entities/char_e001.gif) O). In comparison with PES, some extra absorption peaks appear for PESFs due to the introduction of FDCA, including νC–H of the furan ring at 3128 cm−1, furan C
O). In comparison with PES, some extra absorption peaks appear for PESFs due to the introduction of FDCA, including νC–H of the furan ring at 3128 cm−1, furan C![[double bond, length as m-dash]](https://www.rsc.org/images/entities/char_e001.gif) C bond at 1585 cm−1 and 1520 cm−1.23 They increase with increasing the molar percentage of EF (ΦEF).
C bond at 1585 cm−1 and 1520 cm−1.23 They increase with increasing the molar percentage of EF (ΦEF).
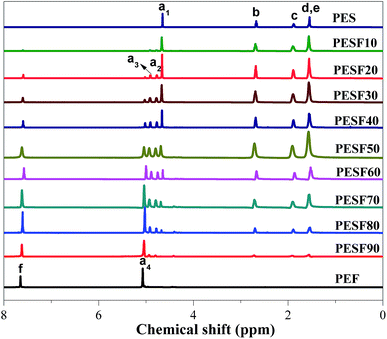
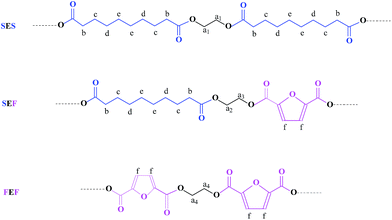
As 1H NMR is sensitive to the monomer sequence, it is used to analyze the sequential structures of PESFs. Fig. 2 shows the 1H NMR spectra of PES, PEF and PESFs. The attributions of the chemical shifts are shown in Scheme 2 and Fig. 2. For PES, the chemical shifts of CH2 in EG appear at 4.66 ppm (a1), and for PEF, the chemical shifts of CH2 in EG appear at 5.08 ppm (a4). For PESFs, some new chemical shifts of CH2 in the EG unit appear at 4.78 and 4.90 ppm (a2 and a3). Therefore, these proton signals were applied to analyze the comonomer composition and the sequential structures of PESFs.
The integrated proton resonance intensities for the signal (2,5-furandicarboxylate unit, F) was employed to quantitatively determine the comonomer compositions of ethylene 2,5-furandicarboxylate (ΦEF) according to eqn (1). As shown in Table 1, it is found that the molar percentage of EF (ΦEF) in PESFs is consistent with that in the monomer feed. The number-average sequence length of ES and EF repeating units (Ln,ES and Ln,EF) and the degree of randomness (R) were calculated respectively according to eqn (2)–(4). With increasing the molar percentage of EF (ΦEF), the Ln,EF increases and Ln,ES decreases. For all PESFs, the degree of randomness are very close to 1.0, which indicates that PESFs are random copolymers.
| ΦEF (mol%) = 2If/(2If + Ic) × 100% | (1) |
| Ln,ES = 1 + 2Ia1/(Ia2 + Ia3) | (2) |
| Ln,EF = 1 + 2Ia4/(Ia2 + Ia3) | (3) |
| R = 1/Ln,ES + 1/Ln,EF | (4) |
3.2 Thermal stability
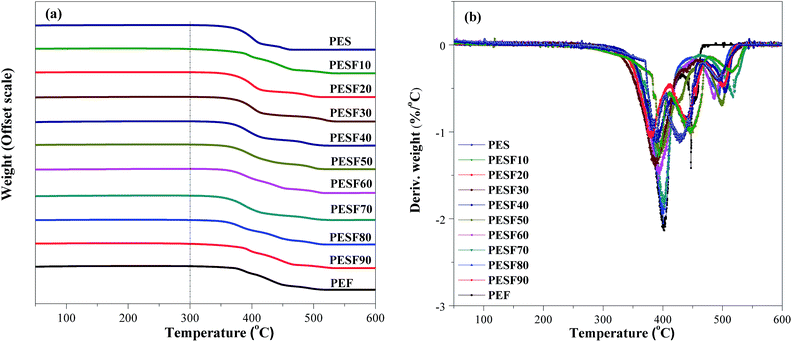
Fig. 3 shows TGA (a) and DTG (b) curves of PES, PEF, and PESFs under dynamic air atmosphere. The thermal properties data are summarized in Table 2. The decomposition temperature at 5% weight loss (Td,5%) of copolyesters are in a range between 347 °C and 376 °C, and the weight of residues at 600 °C is in the range of 3.0–11.0%. PES is almost completely degraded, while 11.0% is left for PEF. Compared with PES, Td,5% of PEF is higher and the weight loss is lower. These results show PEF has better thermal stability than PES. For all copolymers, the Td,5% and the weight of residues at 600 °C are irregular, but weight loss does not take place before 300 °C, which indicates that they exhibit excellent thermal stability. According to the report, the thermal stability of a polymer is determined by the bond energy between atoms in the main chain.24 Structures of PESFs are similar to that of poly(butylene succinate-co-terephthalate) (PBST), the chemical bonds in the main chain are strong bonds, and therefore PESFs also exhibit excellent thermal stability.| Sample | 1st heating | Cooling | 2nd heating | Td,5% (°C) | Weight600b (%) | ||||
|---|---|---|---|---|---|---|---|---|---|
| Tm (°C) | ΔHm (J g−1) | Tc (°C) | ΔHc (J g−1) | Tg (°C) | Tm (°C) | ΔHm (J g−1) | |||
| a Not available.b Weight at 600 °C. | |||||||||
| PES | 74 | 58.5 | 48 | 65.4 | n.a. | 73 | 57.5 | 363 | 5.8 |
| PESF10 | 70 | 70.0 | 36 | 57.7 | n.a. | 67 | 50.3 | 347 | 4.2 |
| PESF20 | 53 | 47.9 | 11 | 23.8 | n.a. | 52 | 36.8 | 359 | 3.0 |
| PESF30 | 40 | 28.0 | n.a.a | n.a. | −33 | n.a. | n.a. | 368 | 6.4 |
| PESF40 | 39 | 25.7 | n.a. | n.a. | −18 | n.a. | n.a. | 367 | 9.4 |
| PESF50 | n.a. | n.a. | n.a. | n.a. | −10 | n.a. | n.a. | 364 | 5.8 |
| PESF60 | n.a. | n.a. | n.a. | n.a. | 12 | n.a. | n.a. | 368 | 8.6 |
| PESF70 | n.a. | n.a. | n.a. | n.a. | 21 | n.a. | n.a. | 357 | 8.0 |
| PESF80 | n.a. | n.a. | n.a. | n.a. | 46 | n.a. | n.a. | 356 | 4.9 |
| PESF90 | n.a. | n.a. | n.a. | n.a. | 58 | n.a. | n.a. | 350 | 4.2 |
| PEF | 218 | 3.6 | n.a. | n.a. | 89 | n.a. | n.a. | 376 | 11.0 |
3.3 Non-isothermal and isothermal crystallization behavior
As is known, the crystallization has a great influence on mechanical properties. Fig. 4 shows the non-isothermal crystallization behavior of PES, PEF, and PESFs.The composition of PESFs has little influence on the thermal stability but plays a great influence on the crystallization and melting behavior. From Fig. 4a, it can be seen that the crystallization exotherms of PESFs (ΦEF ≦ 20%) become more and more wide, the crystallization peak temperature (Tc) shifts to a lower temperature and the corresponding ΔHc decreases with increasing the FDCA content, which indicates that the crystallization becomes difficult and imperfect crystals appear with increasing the FDCA content. Meanwhile, melting enthalpy (ΔHm) in the first heating run is higher than that obtained from the second heating run, which may be explained by the fact that specimens are obtained under a natural cooling mode and therefore the crystallization time is longer. Although PESF30 and PESF40 all neither crystallize nor melt during the cooling and second heating at 10 °C min−1, melting peaks appear at 40 °C (ΔHm = 28.0 J g−1), and 39 °C (ΔHm = 25.7 J g−1), respectively, during the first heating at 10 °C min−1. The results are clearly indicative of the fact that they can crystallize slowly by natural cooling. Thus, PESF30 and PESF40 are rubbery polymers, with a Tg below room temperature and low crystallinity. In contrast, PESF60–90 all neither crystallize nor melt during the first heating, cooling, and second heating at 10 °C min−1, which shows that they have no crystallizability and they are amorphous as the introduction of FDCA breaks the regularity of the molecular chain. In addition, like PESF30 and PESF40, PEF can only crystallize slowly by natural cooling, with low melting enthalpy (ΔHm) of 3.6 J g−1 during the first heating, which can be attributed to the high molecular weight and an angle of 129.4° between carboxylic acid carbons. The results agrees well with that reported by Koros.17 According to the report by Koros, the nonlinear character in FDCA combined with the permanent dipole frustrates the crystallization process, resulting in the slow crystallization rate of PEF.
During the second heating, the mobility of molecule chains decreases due to the introduction of furan ring, which leads to the enhancement of glass transition temperature (Tg). Unfortunately, no remarkable glass transition is detected for PES, PESF10 and PESF20 due to the limitation of our instrument.
Only isothermal crystallization kinetics of PES, PESF10 and PESF20 investigated by differential scanning calorimetry at different temperatures are shown in Fig. 5 because the crystallizability of other copolymers is weak.
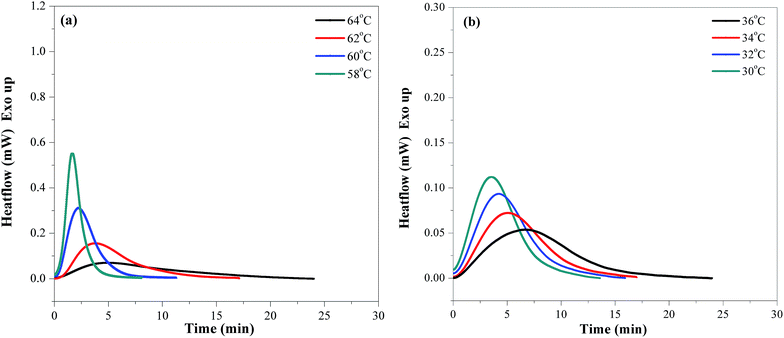 | ||
| Fig. 5 DSC thermograms of isothermal crystallization at different temperatures: (a) PES, (b) PESF20. | ||
For the sake of the completion of crystallization within an approximate crystallization time, the intervals of crystallization temperature of PESF20 gradually shift to lower temperature ranges than that of PES, which means the crystallization rate of PESFs reduce due to the incorporation of FDCA. Evidently, with increasing the content of FDCA unit, furan ring restricts the chain mobility and depresses the polymer crystallization. Moreover, with increasing the isothermal crystallization temperature (Tc), the exothermic peak becomes broader and the crystallization time becomes longer due to the decline of the crystallization rate.
In order to understand the isothermal crystallization process, we use the well-known Avrami model.25,26 A comparative study of the crystallization kinetics of neat PES and PESF20 is carried out. The relative crystallinity (Xt) can be defined as follow:
 | (5) |
Fig. 6 shows the relative degree of crystallinity with time for isothermal crystallization at different temperatures of PES and PESF20. Fig. 6 shows the similar S-shaped curves, which are consistent with Avrami equation. The crystallization rate is usually defined as the inverse of the crystallization halftime (t1/2). The t1/2 values for PES, PESF10 and PESF20 are summarized in Table 3. With increasing the crystallization temperature, t1/2 increases due to the decreasing of the crystallization rate, which is consistent with the results in Fig. 5.
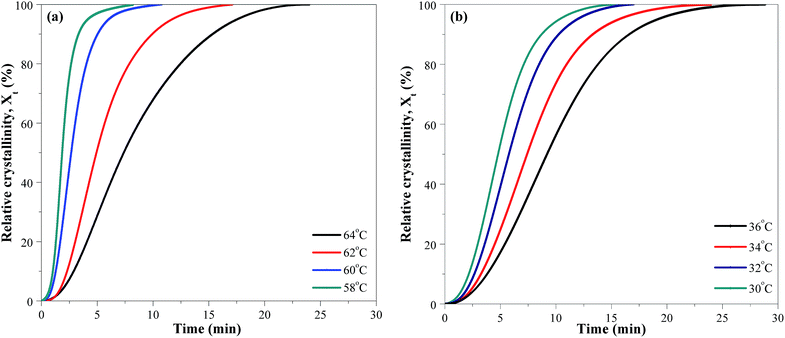 | ||
| Fig. 6 Relative degree of crystallinity with time for isothermal crystallization at different temperatures: (a) PES, (b) PESF20. | ||
| Sample | Tc (°C) | t1/2 (min) | k (min−n) | n | n (average) |
|---|---|---|---|---|---|
| PES | 58 | 1.85 | 0.194 | 2.08 | 1.87 |
| 60 | 2.67 | 0.102 | 1.95 | — | |
| 62 | 4.93 | 0.041 | 1.77 | — | |
| 64 | 7.40 | 0.025 | 1.66 | — | |
| PESF10 | 54 | 1.76 | 0.153 | 2.16 | 2.07 |
| 56 | 3.46 | 0.045 | 2.14 | — | |
| 58 | 6.25 | 0.018 | 1.94 | — | |
| 60 | 13.0 | 0.004 | 2.04 | — | |
| PESF20 | 30 | 4.80 | 0.023 | 2.16 | 2.16 |
| 32 | 5.77 | 0.014 | 2.22 | — | |
| 34 | 7.42 | 0.009 | 2.15 | — | |
| 36 | 9.20 | 0.007 | 2.09 | — |
Avrami model is frequently used as a common method to obtain relevant parameters characterizing the crystallization kinetics.27,28
Just as the Avrami model depicted, the relative degree of crystallinity is a function of time, then the Avrami equation can be defined as follow:
| Xt = 1 − exp(−ktn) | (6) |
ln(−ln(1 − Xt)) = ln![[thin space (1/6-em)]](https://www.rsc.org/images/entities/char_2009.gif) k + n k + n![[thin space (1/6-em)]](https://www.rsc.org/images/entities/char_2009.gif) ln ln![[thin space (1/6-em)]](https://www.rsc.org/images/entities/char_2009.gif) t t
| (7) |
From the slope and the intercept of the Avrami plots, the parameters k and n, respectively, are estimated and summarized in Table 3. The average value of n for PES was 1.87, which indicates that both one-dimensional and two-dimensional crystal growths simultaneously occur. The average value of n for PESF20 is 2.16, which indicates that both two-dimensional and three-dimensional crystal growths simultaneously occur. With decreasing the supercooling (difference between T0m and Tc), the values of k obviously decrease. The k values of PES and PESF10 at 58 and 60 °C are compared. It is found that the k value decreases with increasing the content of FDCA unit, which means that the crystallization rate decreases. Because of the incorporation of the FDCA units into the PES chains, the FDCA units along the polymer chain are hard to mobile and easy to form nucleuses. The variation of n from 1.87 to 2.16 also indicates that the mechanism of the manner of crystal growth of the copolyesters have been gradually altered from both one- and two-dimensional crystal growths to two- and three-dimensional crystal growths.
Fig. 7 shows the melting curves of PES and PESF20 after isothermal crystallization at the indicated temperatures. Compared with the single melting peak of PES, that of PESF20 shows two melting peaks due to the introduction of FDCA. Peak I in Fig. 7b has a low amplitude and its temperature position linearly increases with increasing crystallization temperature. However, its area remains almost constant and its temperature position is still about 5 °C higher than Tc, which is the typical characteristic of an “annealing peak”. As proposed by Wei et al., by analogy with poly(propylene sebacate), peak I can be attributed to the melting of secondary crystals (small and imperfects crystals) formed during the isothermal crystallization process.29 The same observations were reported in the case of poly(ethylene-2,5-furanoate) and poly(ethylene terephthalate).30,31
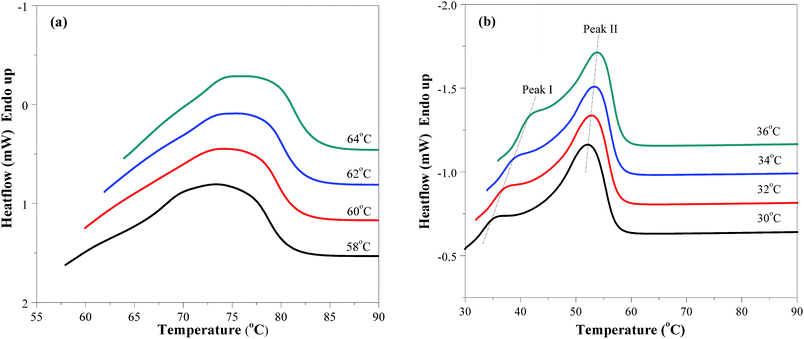 | ||
| Fig. 7 Melting behavior of (a) PES and (b) PESF20 after isothermal crystallization at different temperatures. | ||
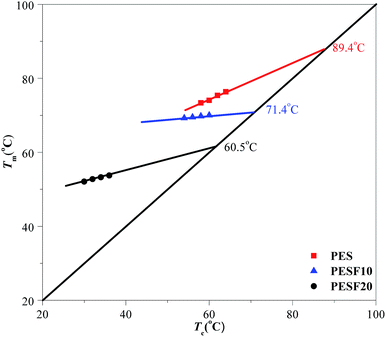
Fig. 8 shows the Hoffman–Weeks plots for PES, PESF10, and PESF20. The values of the equilibrium melting point for PES, PESF10, and PESF20 were determined to be 89.4, 71.4, and 60.5 °C, respectively. That's to say, the molecular mobility is confined due to the introduction of rigid segments (FDCA) into PES, and hence the crystallization ability declines. This behavior had also been observed by Wei et al. in isosorbide–poly(decamethylene sebacate) and isosorbide–poly(propylene sebacate) systems.9,29
3.4 Crystal structure and spherulitic morphology
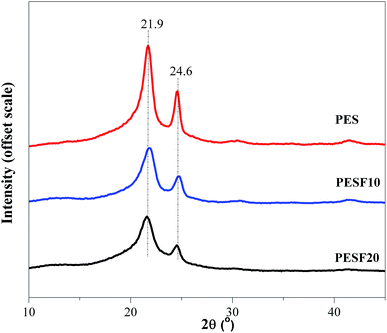
In order to study the relationship between the composition and crystallizability of PESFs, the crystal structures of PESFs were further performed with WAXD. As shown in Fig. 9, PES shows two diffraction peaks with relatively strong intensities at 21.9 and 24.6°. With the introduction of FDCA, PESF50 was a amorphous copolymer due to the randomization distribution and the incompatibility in crystal lattices of ES and EF. PESF10 and PESF20 were found to show two diffraction peaks at 21.9 and 24.6°. No new peak is observed for PESF10 and PESF20. WAXD patterns of PESF10 and PESF20 are the same as that of PES, indicating that they have the same crystal structure as PES. It also indicates that the EF segment is excluded from crystal region of PES and subject to present as an amorphous region due to its bulky furan ring. The variation of the degree of crystallinity (Xc) observed in the WAXD pattern is in agreement with the changes of the fusion enthalpy.It is well known that the physical properties largely depend on the spherulitic morphology.32 The effects of copolymer composition and crystallization temperature on the spherulitic morphologies of PES, PESF10 and PESF20 were further investigated by POM. Fig. 10 displays a series of POM images of PES, PESF10 and PESF20 isothermally crystallized at various temperatures. With the introduction of FDCA, PESF10 and PESF20 form large numbers of nuclei even at elevated temperatures. Compared with PES and PESF10, PESF20 gives slightly smaller spherulites due to higher nucleation density.
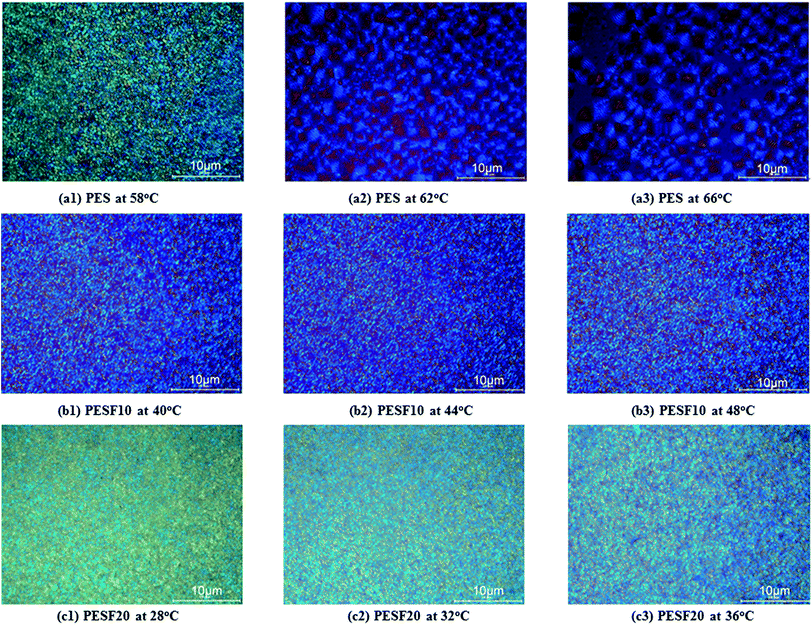 | ||
| Fig. 10 Spherulitic morphologies of (a) PES, (b) PESF10, and (c) PESF20 after isothermal crystallization at indicated temperatures for 15 min. | ||
Moreover, with increasing crystallization temperature, the nucleation density of PES decreases and the size of spherulites increases due to the difficulty of nucleation at high crystallization temperature. Unfortunately, it is difficult to observe the variation of the size of spherulites for PESF10 and PESF20 as many crystal nuclei are formed and the crystals collide with each other quickly.
In general, ring-banded spherulites are commonly observed in short chain aliphatic polyesters.33 As expected, besides Maltese cross spherulites, ring-banded spherulites were also observed for PES at 62 and 66 °C, which is consistent with the results of Keith.10 Ring-banded spherulites couldn't be detected for PESF10 at 40, 44 and 48 °C, however, detected at 58 °C. In addition, ring-banded spherulites couldn't be detected for PESF20 in a wide temperature range (28–44 °C), that's to say, the incorporation of FDCA could restrict lamellar twisting and scrolling of PES segments.
3.5 Mechanical properties
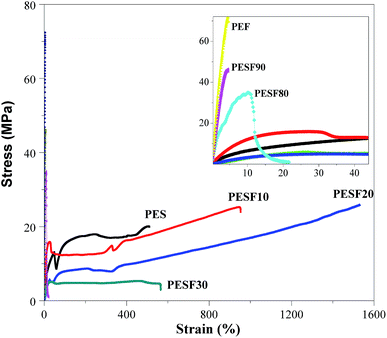
Fig. 11 shows the stress–stain curves of PES, PEF, and PESFs. The Young's modulus (E), strength (σm) and elongation at break (εb) are also summarized in Table 4. As the crystallizability of PESF40–60 is weak and glass transition temperatures (Tg) are lower than the test temperature (25 °C), they are so soft that it is very difficult to molded. Tensile properties are not obtained for them.| Sample | E (MPa) | σm (MPa) | εb (%) |
|---|---|---|---|
| PES | 110 ± 30 | 20 ± 2 | 510 ± 80 |
| PESF10 | 170 ± 50 | 25 ± 2 | 950 ± 150 |
| PESF20 | 30 ± 3 | 26 ± 3 | 1500 ± 190 |
| PESF30 | 80 ± 3 | 5 ± 1 | 280 ± 90 |
| PESF80 | 940 ± 50 | 35 ± 5 | 12 ± 3 |
| PESF90 | 1160 ± 400 | 46 ± 7 | 4 ± 3 |
| PEF | 2080 ± 100 | 72 ± 5 | 3 ± 1 |
The tensile strength of other PESFs ranges from 5 to 72 MPa, Young's modulus ranges from 30 to 2080 MPa, and elongation at break ranges from 3% to 1500%. The tensile properties of PES (E = 110 MPa, σm = 20 MPa and εb = 510%) are comparable to those of polyethylene (PE). Strain hardening phenomena appear for PES, PESF10, and PESF20 due to the strain-induced crystallization and chain alignment, which is also observed for other copolymers such as poly(butylene adipate-co-butylene furandicarboxylate) (PBAFs).23,33 Moreover, PES, PESF10 and PESF20 exhibit apparent yielding behaviors. At ΦEF from 0 mol% to 20 mol%, the elongation apparently increases as the degree of crystallinity and the size of spherulites decrease as discussed above. However, the tensile strength of PESF10 and PESF20 are a little higher than that of PES, which may be caused by the relatively high molecular weight, indicating that mechanical properties commonly depend on many factors such as chain structure, molecular weight, crystallinity, spherulitic morphology, and Tg. In contrast, at higher ΦEF (30 mol%), the tensile strength of PESF30 is the lowest (5 MPa) due to the relatively low molecular weight and degree of crystallinity. At ΦEF from 80 mol% to 100 mol%, a significant improvement in the Young's modulus and tensile strength is observed because the rigid structure increases with ΦEF. Besides, in agreement with the literature, PEF displays brittle fracture behavior without yielding (elongation at break = 3%), which is the major obstacle encountered in the applications.34
In summary, compared with PES, EF-rich copolyesters have much higher Young's modulus and strength, while ES-rich copolyesters have much higher elongation at break. Results from the above data show that PESFs are the promising biobased copolymers and may have more interesting applications.
4. Conclusions
In this study, the novel biobased copolyesters poly(ethylene sebacate-co-ethylene 2,5-furandicarboxylate) (PESFs) derived from biobased sebacic acid (SA), ethylene glycol (EG), and 2,5-furandicarboxylic acid (FDCA) were successfully prepared through a two-step melt polycondensation reaction. As confirmed by 1H NMR, PESFs are random copolyesters. With increasing the content of FDCA unit, the glass transition temperatures of PESFs increase and they have excellent thermal stability. PESFs with lower contents in FDCA are able to crystallize from the melt. Compared with PES, PESF20 shows two melting peaks due to the formation of secondary crystals (small and imperfects crystals) caused by the incorporation of FDCA during the isothermal crystallization process. POM data show that the nucleation density of PESF10 and PESF20 increase and the size of spherulites decrease due to the chain irregularity caused by randomization distribution with the introduction of FDCA. However, WAXD data show that the crystal structure remains unchanged. Ring-banded spherulites couldn't be detected for PESF20 in a wide temperature range (28–44 °C) as the incorporation of FDCA could restrict lamellar twisting and scrolling of PES segments. Compared with PES, EF-rich copolyesters have much higher Young's modulus and strength, while ES-rich copolyesters have much higher elongation at break. In summary, the thermal transition and mechanical properties are tunable with the composition.Acknowledgements
Dr G. Q. Wang thanks the financial support by the Postdoctoral Science Foundation of Jilin Province, China (2015).Notes and references
- A. Gandini, Green Chem., 2011, 13, 1061–1083 RSC.
- G. Z. Papageorgiou, V. Tsanaktsis and D. N. Bikiaris, Phys. Chem. Chem. Phys., 2014, 16, 7946–7958 RSC.
- G. Z. Papageorgiou, V. Tsanaktsis, S. Exarhopoulos, D. G. Papageorgiou and D. N. Bikiaris, Polymer, 2014, 55, 3846–3858 CrossRef CAS.
- G. Z. Papageorgiou, V. Tsanaktsis, D. G. Papageorgiou, K. Chrissafis, S. Exarhopoulos and D. N. Bikiaris, Eur. Polym. J., 2015, 67, 383–396 CrossRef CAS.
- C. Lavilla, A. Alla, A. Martinez de llarduya, E. Benito, M. G. Garcia-Martin, J. A. Galbis and S. Munoz-Guerra, Biomacromolecules, 2011, 12, 2642–2652 CrossRef CAS PubMed.
- C. Japu, A. Martinez de Ilarduya, A. Alla, G. Mart, J. Galbis and S. Munoz-Guerra, Polym. Chem., 2014, 5, 3190–3202 RSC.
- S. Thiyagarajan, W. Vogelzang, R. Knoop, A. Frissen, J. Haveren and D. Es, Green Chem., 2014, 16, 1957–1966 RSC.
- E. Zakharova, A. Alla, A. Martinez de llarduya and S. Guerra, RSC Adv., 2015, 5, 46395–46404 RSC.
- Z. Y. Wei, C. Zhou, Y. Yu and Y. Li, RSC Adv., 2015, 5, 42777–42788 RSC.
- H. D. Keith, Macromolecules, 1982, 15, 48–55 Search PubMed.
- F. W. Billmeyer, Macromolecules, 1969, 2, 103–105 CrossRef CAS.
- F. Koopman, N. Wierckx, J. Winde and H. Ruijssenaars, Bioresour. Technol., 2010, 101, 6291–6296 CrossRef CAS PubMed.
- A. Boisena, T. B. Christensena, W. Fub, Y. Y. Gorbanevc, T. S. Hansenc and J. S. Jensenb, Chem. Eng. Res. Des., 2009, 87, 1318–1327 CrossRef.
- C. Moreaua, M. N. Belgacemb and A. Gandini, Top. Catal., 2004, 27, 11–30 CrossRef.
- J. Lange, E. Heide, J. Buijtenen and R. Price, ChemSusChem, 2012, 5, 150–166 CrossRef CAS PubMed.
- A. Banerjee, G. Dick, T. Yoshino and M. Kanan, Nature, 2016, 531, 215–219 CrossRef CAS PubMed.
- S. Burgess, J. Leisen, B. Kraftschik, C. Mubarak, R. Kriegel and W. Koros, Macromolecules, 2014, 47, 1383–1391 CrossRef CAS.
- A. Gandini, A. J. D. Silvestre, C. P. Neto, A. F. Sousa and M. J. Gomes, J. Polym. Sci., Part A: Polym. Chem., 2009, 47, 295–298 CrossRef CAS.
- M. Gomes, A. Gandini, A. J. D. Silvestre and B. Reis, J. Polym. Sci., Part A: Polym. Chem., 2011, 49, 3759–3768 CrossRef CAS.
- M. Jiang, Q. Liu, Q. Zhang, C. Ye and G. Y. Zhou, J. Polym. Sci., Part A: Polym. Chem., 2012, 50, 1026–1036 CrossRef CAS.
- J. P. Ma, Y. Pang, M. Wang, J. Xu, H. Ma and X. Nie, J. Mater. Chem., 2012, 22, 3457–3461 RSC.
- O. Grosshardt, U. Fehrenbacher, K. Kowollik, B. Tubke, N. Dingenouts and M. Wilhelm, Chem. Ing. Tech., 2009, 81, 1829–1835 CrossRef.
- B. Wu, Y. Xu, Z. Bu, L. Wu, B. Li and P. Dubois, Polymer, 2014, 55, 3648–3655 CrossRef CAS.
- S. Mallakpour and M. Taghavi, Polym. J., 2009, 4, 308–318 CrossRef.
- M. Avrami, J. Chem. Phys., 1941, 9, 177–184 CrossRef CAS.
- M. C. Tobin, J. Polym. Sci., Part B: Polym. Phys., 1976, 4, 2253–2257 CrossRef.
- M. Avrami, J. Chem. Phys., 1941, 9, 177 CrossRef CAS.
- M. C. Tobin, J. Polym. Sci., Part B: Polym. Phys., 1976, 14, 2253 CrossRef CAS.
- C. Zhou, Z. Y. Wei, Y. Yu, Y. Wang and Y. Li, RSC Adv., 2015, 5, 68688–68699 RSC.
- G. Stoclet, G. Sart, B. Yeniad, S. Vos and J. Lefebvre, Polymer, 2015, 72, 165–176 CrossRef CAS.
- X. F. Lu and J. N. Hay, Polymer, 2001, 42, 9423–9431 CrossRef CAS.
- H. Wu and Z. Qiu, CrystEngComm, 2012, 14, 3586–3595 RSC.
- W. Zhou, X. Wang, B. Yang, Y. Xu, W. Zhang, Y. Zhang and J. Ji, Polym. Degrad. Stab., 2013, 98, 2177–2183 CrossRef CAS.
- J. I. Knoop, W. Vogelzang and J. Haveren, J. Polym. Sci., Part A: Polym. Chem., 2013, 51, 4191–4199 CrossRef.
| This journal is © The Royal Society of Chemistry 2017 |

