
 Open Access Article
 This Open Access Article is licensed under a Creative Commons Attribution-Non Commercial 3.0 Unported Licence
Improving gene regulatory network structure using redundancy reduction in the MRNET algorithm
Wei Liu ,
Wen Zhu,
Bo Liao*,
Haowen Chen,
Siqi Ren and
Lijun Cai
,
Wen Zhu,
Bo Liao*,
Haowen Chen,
Siqi Ren and
Lijun Cai
College of Information Science and Engineering, Hunan University, Changsha, Hunan 410082, China. E-mail: dragonbw@163.com
First published on 27th April 2017
Abstract
Inferring gene regulatory networks from expression data is a central problem in systems biology. It is critical for identifying complicated regulatory relationships among genes and understanding regulatory mechanisms in cells. Various methods based on information theory have been developed to infer networks. However, the methods introduce many redundant regulatory relationships in the process of network inference owing to noise in the data and the threshold tenability of the method. In this paper, we propose a novel network inference method using redundancy reduction in the minimum-redundancy network (MRNET) algorithm (RRMRNET) to improve regulatory network structure. The method is based on and extends the MRNET algorithm. Two redundancy reduction strategies are given in the method: one is used to obtain a candidate regulator gene set for each target gene by reducing non-regulation and weakly indirect regulation of genes; the other assigns the best-first regulator gene to each target gene to eliminate redundant regulatory relationships caused by noise in the MRNET algorithm. Eventually, the candidate regulator gene set and the best-first regulatory gene for each gene were used in the MRNET to obtain a complete network structure. The proposed method was performed on six network datasets, and its performance was also compared to that of other network inference methods based on information theory. Extensive experimental results demonstrated the effectiveness of the proposed method.
Introduction
A central problem in systems biology is to recover gene regulatory networks (GRNs), which can help biomedical scientists to identify complicated regulatory relationships among genes and to understand regulatory mechanisms in the cell.1,2 In the past, GRNs were inferred from experimental interventions in which regulatory interactions among genes were verified. Unfortunately, such experiments require considerable time and cost, and this approach based on experiments is infeasible.3 With the appearance of high-throughput technologies, expression data for tens of thousands of genes can be produced, which makes it possible for GRNs to be inferred from these expression data based on computational methods.4 In recent years, the inference of networks based on computational methods has become one of most important goals in the post-genomic era.5,6A gene regulatory network can be described by a graph in which each node corresponds to a gene and each edge represents a regulatory relationship between genes.7 Thus, network structure can be reconstructed by accurately inferring the underlying regulatory interactions among genes from the gene expression data. Unfortunately, typical gene expression data represent a special kind of data with high dimensions and small sample size, leading to a dimensionality problem.8,9 Furthermore, expression data often contain large amounts of external noise and non-linear relationships. All of these factors make it difficult to accurately identify regulatory interactions among genes. Recovering GRNs from expression data based on computational methods has become a challenging problem.6
To construct accurate GRN structures from expression data, various computational methods have been proposed based on a variety of different assumptions and different conditions.10–12 These algorithms can be divided into two main categories: model-based and similarity-based.13,14 Model-based algorithms usually infer regulatory interactions based on computational model learning. The typical models include Boolean network,15–18 Bayesian network,19–22 and differential equation models.14,23–25 The Boolean network model is the simplest network model, which is implemented through Boolean variables and abstract Boolean logic.7 Because the state of gene expression is considered to be only active or inactive, Boolean network models cannot capture complex system behaviours.26 The Bayesian network model is a popular probabilistic graphical model in which the dependency relationships among genes are described via a directed acyclic graph (DAG). The Bayesian network model outperforms other models in dealing with noise and incorporating prior knowledge, but structure learning in the model is an NP-hard problem.27,28 The differential equation model characterizes the expression level of a gene at a certain time by a function, which involves regulatory interactions with other genes. Therefore, the regulatory interactions among genes can be identified by the parameter set, which is obtained according to the expression data and the equation model.
Unlike the above model-based algorithms, similarity-based algorithms identify regulatory interactions only by measuring dependences between genes. Typical algorithms include correlation-based and information theory-based methods. In the correlation-based method, a regulatory interaction is determined by the degree of co-expression between two genes.4 To measure gene–gene co-expression, Pearson's correlation, rank correlation and Euclidean distance are typically used.29 However, the correlation-based method cannot identify complex dependencies between genes, such as non-linear dependencies.30 Furthermore, some functionally related genes might not be co-expressed, which makes it difficult to accurately identify regulatory interactions. The information theory-based method is also a representative similarity-based algorithm, in which mutual information (MI) is used to measure the dependency among genes. As MI effectively captures non-linear dependencies,31,32 the information theory-based method is widely used to identify complex regulatory interactions and to infer large-scale GRNs.
In this paper, we focus on the network inference method based on information theory. In recent years, various network inference methods based on information theory have been developed. Relevance network (RN)33 was one of the first information theory-based methods. This method calculates the MI values between genes and then infers the interactions based on a given threshold. Faith et al. extended the RN and proposed a method called Context Likelihood of Relatedness (CLR),34 which infers interactions based on a score derived from the background distribution of MI values. With RN and CLR, it is easy to introduce false edges caused by indirect interactions. To eliminate indirect interactions, Margolin et al. proposed the ARACNE method35 based on Data Processing Inequality (DPI), wherein indirect interactions in interaction triangles are considered. The minimum-redundancy network (MRNET) by Meyer36 is a network inference algorithm using a feature selection strategy, in which an iterative search process is applied to select direct interactions. Akhand37 provided a modification of the MRNET, in which MI is replaced by the Maximal Information Coefficient (MIC) to quantify the dependence between genes. Luo et al.38 presented a method called three-way MI (MI3) to detect indirect interactions, where a probabilistic metric involving cooperative activity between two regulatory genes was used. However, the method selects only the two best regulatory gene candidates for the given target gene. Villaverde et al.39 produced a network inference strategy called MIDER. This method can remove indirect interactions based on MI and entropy reduction, but it needs to calculate the conditional entropy under multiple variables. Zhao et al.40 introduced a network inference algorithm called the part mutual information-based path consistency algorithm (PCA-PMI), in which PMI is presented to measure the nonlinearly direct associations between genes. Although most of the above methods have effectively improved the accuracy of network inference, there are still some redundant regulatory relationships in the network structures. There may be three main reasons for this problem: (1) it is still not possible to distinguish some indirect interactions from direct interactions; (2) the noise from expression data makes the measure of mutual information unreliable and introduces some redundant regulation; (3) in most methods, the threshold is tuneable, and it is usually set by an empirical value. All of these factors have large influences on the inference performance of network inference methods. Therefore, our present study mainly focuses on how to eliminate redundant regulation to improve network structure accuracy.
In this paper, we propose a novel network inference method with a fixed threshold, RRMRNET, to improve regulatory network structure. The method provides two redundancy reduction strategies: one is used to reduce non-regulation and weakly indirect regulations for each target gene; the other is used to eliminate redundant regulatory relationships caused by noise in the MRNET algorithm. The main contributions of this study are described below.
1. We provide a redundancy control strategy based on information theory and clustering technology, which reduces the redundant regulatory relationships among genes. After filtering with this strategy, the remaining regulatory relationships are then used as input for the MRNET algorithm to infer network structure.
2. We propose a strategy for selecting a best-first regulator gene for each gene to avoid redundant regulatory relationships caused by noise. The selected best-first regulator genes are used by the MRNET algorithm and can improve network structure. This strategy integrates mutual information with conditional mutual information and can be generally applied to methods that involve the best-first search strategy.
3. Extensive experiments were performed, and the proposed method was compared with several existing network inference methods. The results show the superiority of our method.
Theoretical
To clearly describe the proposed method, we review the concepts of information theory and briefly introduce an existing network inference method called MRNET.Mutual information and entropy
Information theory is a scientific field involving the quantification of information that has proved useful in applied mathematics, bioinformatics and computer science. Entropy and mutual information are two key measures in information theory that are vital to measure dependencies among variables.Entropy measures the amount of uncertainty of a random variable. Let X ∼ p(x) be a discrete random variable with alphabet χ. The entropy of the variable X is defined as follows:
 | (1) |
Let X and Y be two discrete random variables; the conditional entropy of Y given X is defined as follows:
 | (2) |
MI measures the amount of information that a random variable shares with another random variable and is used to measure the relevance between the two variables. The MI between two random variables (X,Y) ∼ p(x,y) is defined as follows:
 | (3) |
Conditional mutual information (CMI) is used to measure the relevance between two variables given other variables. Given a variable Z, the CMI of variables X and Y is defined as follows:
 | (4) |
Minimum-redundancy network
MRNET36 is a popular network inference method based on information theory that attempts to reduce indirect interactions between genes and to make it impossible to recover large-scale networks. To infer the network structure accurately, the MRNET algorithm seeks regulator genes for each target gene, relying on a feature selection algorithm called maximum-relevance minimum-redundancy (MRMR).Concretely, each gene in gene set G is treated as the target gene gc in turn, and all other genes are then treated as candidate regulator genes. The MI values between the target gene and the candidate regulator genes are calculated, and then a best-first incremental search algorithm is used to identify the regulator genes. In the first step, the candidate gene with the largest MI value with the target gene is selected as the first regulator gene, and it is then moved to the regulator gene set V. In each subsequent step, a regulator gene can be inferred by eqn (5) and then can be moved to the regulator gene set V. Obviously, the selected regulator gene has the largest relevance with the target gene while having the lowest redundancy within the selected regulator gene set.
 | (5) |
| ui = I(gi,gc) | (6) |
 | (7) |
For each gene pair (gi,gj), two scores si and sj can be obtained according to eqn (5). The maximum of the two scores is chosen as the interaction score between gene gi and gene gj. When the interaction score of a gene pair is below the given threshold, the regulatory relationship of the gene pair is eliminated.
The MRNET can effectively infer the network structures to some extent, but there are still some redundant regulatory relationships in the network structures. The main focus of our study is to use some redundancy reduction strategies to improve the network structure. We can consider the following aspects for the MRNET:
Among network inference methods, the MRNET is of particular interest due to its capacity to distinguish some indirect regulation relationships. However, the MRNET still has high false positive rates, indicating there are some indirect regulation relationships. Therefore, an effective network inference method should ensure that more accurate regulatory relationships are selected.
Another consideration is the threshold problem. Many network inference methods based on mutual information, including the MRNET, tend to adjust the regulatory relationships by a tuneable threshold. As the threshold increases, the number of selected regulatory relationships also decreases. As the threshold decreases, the number of reported regulatory relationships also increases. Clearly, the performance of network inference methods is greatly affected by setting the threshold. An effective network inference method should be based upon a fixed threshold rather an empirical threshold.
Finally, MRNET is based on a best-first search algorithm to iteratively select the genes that have maximum relevance to the given target gene and have minimum redundancy with selected regulator genes. Obviously, the selection of the first regulatory gene is crucial for the subsequent selection of regulator genes. However, gene expression data have large amounts of noise, which may make the relevance between the target gene and the first regulatory gene selected by mutual information inaccurate. Therefore, we should ensure that the first selected regulatory gene of each target gene is the gene that is most relevant to the target gene.
Methods
In this study, we aim to present an effective network inference method with a fixed threshold (RRMRNET) using redundancy reduction in the MRNET algorithm. The proposed method infers network structure in three steps. First, redundant regulatory relationships among genes are eliminated using a redundancy control strategy. Second, the best-first regulator for each target gene is assigned using a strategy combining mutual information and conditional mutual information. Finally, the information obtained in the first two steps is used in the MRNET algorithm to infer the network structure. Fig. 1 shows a schematic of the method. | ||
| Fig. 1 Schematic diagram of the RRMRNET. | ||
Eliminating redundant regulation
As mentioned previously, most network inference methods cannot avoid including some redundant regulation in network inference. To improve network structure, it is advisable to eliminate some of the redundant genes for each gene before the inference methods are implemented. The MRNET algorithm effectively infers the network by eliminating indirect regulatory genes that interact with the target gene via some direct regulatory gene. However, problems with some redundant genes remain because these genes can interact with the target gene through indirect regulatory genes and other genes. From the view of the interaction between subject and object, these redundant genes can also be regarded as additional indirect regulatory genes. To distinguish between the two types of indirect regulatory genes, we call them strong indirect regulatory genes and weakly indirect regulatory genes. Note that the difference is that the strong indirect regulatory genes usually have high relevance with the target gene and direct regulatory genes of the target gene, and weakly indirect regulatory genes do not. We give the description of regulatory relationships between a given target gene GT and the other genes in Fig. 2, where the nodes represent the target or regulatory genes, and the lines represent regulations between genes. For the target gene GT, gene G1 and gene G2 are two direct regulatory genes, gene G3 is a non-regulatory gene, gene G4 is a strong indirect regulation, and gene G5 is a weak indirect regulatory gene. Obviously, the MRNET algorithm removes only the strong indirect regulatory genes for each target gene. Therefore, a key to improving the performance of the MRNET algorithm is eliminating the weakly indirect regulatory genes for each target gene. | ||
| Fig. 2 Regulatory relationships between the target gene GT and the other genes. | ||
Considering that weakly indirect regulatory genes interact with the target gene through other genes and provide little or no contribution to the information of the target gene in a module composed of all genes, weakly indirect regulatory genes can be selected according to the degree of importance of a gene for the target gene. A quantitative measure, called importance degree score (IDS), is defined for evaluating the importance degree of a gene for the given target gene.
Let G = {g1,…gn} denote the set of n genes of a given microarray dataset, and Gc = {g1,…,gc−1,gc+1,…,gn} represents the candidate gene set containing all genes in G except for target gene gc. For a target gene gc, the IDS of gene gi has the following form:
 | (8) |
The above score function combines an entropy reduction term and a mutual information term. Basically, the entropy reduction term is based on information gained to describe the degree of importance of gene gi for the target gene gc, and the mutual information term describes the network structure-preserving power of gene gc.
Clearly, weakly indirect regulatory genes are more likely to be genes with smaller IDSs to the target gene. Considering that the relevance between the weakly indirect regulatory genes and the target gene should be small, genes with small relevance and IDSs to a target gene can be selected as the weakly indirect regulatory genes. To avoid the use of a threshold, clustering technology is employed for selecting the weakly indirect regulatory genes. To be specific, a clustering algorithm clusters for the two-dimensional vector, which is made up of the relevance and the IDS between the target gene gc and each gene in G. As the number of genes in G is not large, it is feasible to use k-means as the clustering algorithm. Because the relevance and IDS of the weakly indirect regulatory gene to target gene are both small, the value of parameter k in the k-means algorithm is set as 4. For clustering results, we selected the genes with same cluster number as gene gc as the weakly indirect regulatory genes and removed these genes from the gene set Gc.
The full procedure for eliminating redundant regulation is described as follows:
(1) Calculate the MI value between the target gc and each candidate regulatory gene according to eqn (3).
(2) For the target gene gc, calculate the IDS of each candidate regulatory gene gi according to eqn (8).
(3) For the target gene gc, cluster for MI values in step 1 and the IDS values in step 2 using the k-means algorithm.
(4) Select the genes whose clusters are the same as gene gc, and remove these genes from Gc.
Assigning the best-first regulator gene
In MRNET, the best-first incremental search algorithm is used to find the near-optimal regulator genes defined in eqn (5). The first step of the algorithm is selecting the gene with the highest MI value to a target gene as the first regulator gene of the target gene. Clearly, the selection of subsequent regulator genes is greatly affected by the selection of the first regulator gene. When the selected gene is not the true first regulator of the target gene, redundant regulator genes are present in the inferred network structure. In practice, the noise inherited from the expression data makes the measurement of mutual information unreliable. Therefore, it is likely that the regulator gene selected with the highest MI value to the target gene is not the true first regulator gene. To address this problem, we need to design a strategy to assign the best-first regulator for each target gene in MRNET to avoid introducing redundant regulator genes.To specify the best-first regulator for target gene, we use a score function called BFS to determine which gene is more relevant to the target gene. For the target gene gc, the BFS of gene gi has the following form:
 | (9) |
![[thin space (1/6-em)]](https://www.rsc.org/images/entities/char_2009.gif) n, where n is the number genes in the network.39
n, where n is the number genes in the network.39
The BFS in eqn (9), combining MI and condition MI, makes the selection of the best-first regulator gene for the target gene in the MRNET involve two measures. Obviously, the higher the value of BFS, the greater the likelihood that the gene is the best-first regulator gene of the target gene. It is notable that eqn (9) does not replace eqn (6) in MRNET; it is simply for selecting the best-first regulator from possible first regulatory genes. For simplicity, the two genes with the highest MI to the target gene are chosen as possible first regulatory genes.
Based on BFS in eqn (9), the complete procedure of the best-first regulator gene search is summarized as follows:
(1) Initialize gene set S = ∅ and S* = ∅.
(2) Calculate the MI value between target gene gc and each gene in G according to eqn (3).
(3) Rank the regulatory genes in G according to the MI values in descending order, select the top log2n genes as gene set S, and then select the top two genes of this set as the possible first regulatory gene set S*.
(4) Calculate the BFS for each gene in set S* according to eqn (9) and select the gene with highest score as the best-first regulator gene of target gene g′c.
Inferring network structure
Once the candidate regulator gene set and the best-first regulator gene for each gene are obtained using the above two steps, the MRNET algorithm is run using these input parameters to infer the network structure. In more detail, the score of each pair (gi,gj) is obtained according to eqn (5), and then the minimum of gMRMRi and gMRMRj is applied as the regulatory strength of the pair (gi,gj). Finally, a threshold is used to decide the final regulatory strength between genes and to obtain a specific network structure.In the original version of MRNET, the threshold is tuneable. To avoid redundant genes included due to an incorrect threshold selection, we considered giving a fixed threshold to decide the final regulatory strength. As mentioned previously, the MRNET can effectively eliminate strong indirect regulatory genes. The basic principle is that the score of a direct regulatory gene should be positive and rank well, whereas the scores of strong indirect regulatory genes should be negative and rank poorly according to eqn (5). Considering that the score in eqn (5) of certain redundant genes, such as weakly indirect regulatory genes, may be not negative, the MRNET algorithm needs to provide a tuneable threshold to avoid redundant regulatory relationships. However, because weakly indirect regulatory genes and non-regulation genes have been filtered in the first two steps of RRMRNET, it is feasible that the numerical value 0 can be set as a fixed threshold.
To fully describe the proposed method, the complete RRMRNET is summarized as follows:
Algorithm: (RRMRNET)
Input: Microarray data G = {g1,…gn}
Output: A gene network
1: Initialize gene sets V ← ∅, and lists GL ← ∅, BFL = ← ∅;
2: Construct a MI matrix M according to eqn (3);
3: for each gene gc c ← 1 to n do
4: Gc ← {g1,…,gc−1,gc+1,…gn}
5: Calculate IDS(gi,gc) for each candidate regulatory gene gi(gi ∈ Gc) using eqn (8);
6: Cluster all pairs {IDS(gi,gc), MIi,c} using the k-means algorithm;
7: Select the genes whose clusters are the same as gene gc, and remove these genes from Gc.
8: GL ← Gc
9: end for
10: for each gene gc c ← 1 to n do
11: Rank the regulatory genes gi(gi ∈ Gc) in G according to MIi,c in descending order to form ranking list MIL;
12: Select the top log2n and two genes from MIL to form the gene sets S and S*;
13: Calculate the BFS score for each gene in S* using eqn (9);
14: Obtain the best-first regulator gene g′c that has the highest BFS score, and BFL ← {g′c};
15: end for
16: for each gene gc c ← 1 to n do
17: V ← BFLc and GLc ← GLc\BFLc;
18: while length (GLc) >0 do
19: Select gene gj from the remaining genes of GLc that satisfy eqn (5) and V ← S∪{gj}, GLc ← GLc\{gj};
20: Obtain the score sj using eqn (5)
21: end while
22: end for
23: Obtain the score of each gene pair {gi,gj} according si and sj;
24: Return the network according to the fixed threshold.
Experimental
In this section, we describe extensive experiments evaluating the performance of the proposed method. Six regulatory network datasets were used in the experiments. Our proposed method was compared with six popular network inference algorithms based on information theory: CLR, ARACNE, MRNET, MI3, MIDER and PCA-PMI. Among these methods, only MI3 and MIDER can infer the interaction direction. To compare these methods effectively, we do not consider the interaction direction when these methods are used to infer the network structure. Moreover, all the algorithms need to provide a threshold to infer network structure, except MI3. Note that MIDER provides a function that automatically calculates the threshold. To reflect the prediction performance concretely, we provided the thresholds for the other methods. ARACNE was executed with the default threshold (eps = 0.0).4 For ARACNE and MRNET, an optimum threshold setting method was adopted: calculate the true positive rate (TPR) and the false positive rate (FPR) with different thresholds, and then select an optimum threshold, which maximizes the value of (TPR − FPR + 1).41 For the PCA-PMI, the threshold with the maximum accuracy is select in the case of no isolated gene.In these experiments, CLR, ARACNE, MRNET were implemented in the R package MINET, and MI3 was performed in the R package mi3. MIDER, PCA-PMI and our method were implemented in the MATLAB language. All of the experiments were run on a personal computer with an Intel core i7 (2.2 GHz) and 16 GB of RAM.
Datasets
All of the experiments were performed on six network datasets, including simulated data and real data. The datasets can be obtained from previous studies.42–45 Table 1 gives detailed descriptions of the datasets.| Datasets | Variables | Samples | Type | Network nodes | Network edges |
|---|---|---|---|---|---|
| Reaction chain with 4 species | 4 | 100 | Simulated | 4 | 3 |
| Reaction chain with 8 species | 8 | 250 | Simulated | 8 | 7 |
| DREAM3 10 genes | 10 | 10 | Simulated | 10 | 10 |
| DREAM3 50 genes | 50 | 50 | Simulated | 50 | 77 |
| DREAM3 100 genes | 100 | 100 | Simulated | 100 | 166 |
| S0S | 9 | 9 | Real | 9 | 24 |
Reaction chain with 4 species,42 containing 100 samples with 4 variables. It is a small reaction pathway. The true network has 4 nodes and 3 edges.
Reaction chain with 8 species,43 containing 250 samples with 8 variables. It is a small reaction pathway. The true network has 8 nodes and 7 edges.
DREAM3-10 gene dataset,44 containing 10 samples for 10 genes. It is from the DREAM (“Dialogue for Reverse Engineering Assessments and Methods”) project and represents a yeast gene network. The true network is composed of 10 nodes and 10 edges.
DREAM3-50 gene dataset,44 containing 50 samples for 50 genes. It also belongs to the DREAM project and represents a yeast gene network. The true network is composed of 50 nodes and 77 edges.
DREAM3-100 gene dataset,44 containing 100 samples for 100 genes. It also belongs to the DREAM project and represents a yeast gene network. The true network is composed of 100 nodes and 166 edges.
SOS,45 containing 9 samples for 9 genes. It is an SOS DNA repair network in Escherichia coli. The true network is composed of 9 nodes and 24 edges.
Evaluation metrics
To fairly assess the performance of our approach, four evaluation metrics were used in all experiments, including the true positive rate (TPR), false positive rate (FPR), positive predictive value (PPV), and accuracy (ACC). Let true positives (TP), true negatives (TN), false positives (FP), and false negatives (FN) denote the numbers of true positives, true negatives, false positives, and false negatives, respectively. These measures are defined as follows:
 | (10) |
 | (11) |
 | (12) |
 | (13) |
Since the performance of network inference should be evaluated from the two aspects of TPR and FPR, we can plot the receiver operating characteristic curve (ROC) or calculate the area under the ROC curve (AUROC) to quantify the performance.
Results
Results for chain structure network
To verify the effectiveness of our method for inferring special networks, such as linear chain structure networks, we performed some tests on chain structure network datasets. Considering the scale of the network, we choose the chain structure expression data with sizes of 4 and 8 as the test datasets.First, the proposed method was tested on the reaction chain with 4 species. In the experiment, RRMRNET was run several times, resulting in unique network structures. Fig. 3 shows the network structures of the RRMRNET and the six other algorithms for the reaction chain with 4 species dataset. From the figure, we can see that CLR, ARACNE, MIDER and RRMRNET inferred the same structure as the true network, indicating that these methods could identify all of the correct edges, with no redundant edges. For MRNET, MI3 and PCA-PMI, there were some redundant edges and some missing edges. To further assess the performance of our method, the comparison results of different methods are given in Table 2. Because CLR, ARACNE and MIDER yielded the same results as the RRMRNET, we needed to compare only the RRMRNET with the MRNET, MI3 and PCA-PMI. From Table 2, we can see that the MRNET and PCA-PMI selected all of the correct edges (TP = 3) with 1 redundant edge (FP = 1), and the MI3 missed an edge (TP = 2, FN = 1) with redundant edges (FP = 3). Among all of the methods, the RRMRNET achieved the highest true positive rate (TPR = 1) with the lowest false positive rate (FPR = 0), indicating that the RRMRNET had good prediction performance for regulation relationships. Furthermore, the PPV values of the MRNET, MI and PCA-PMI were between 0.400 and 0.75, which are less than the PPV values of the RRMRNET (PPV = 1). The ACC values of the MRNET, MI and PCA-PMI were 0.833, 0.333 and 0.833, respectively, which are less than the ACC values of the RRMRNET (ACC = 1). All of the results indicate that our method is better than the MRNET, MI3 and PCA-PMI.
 | ||
| Fig. 3 Comparison of the different methods on the reaction chain with 4 species dataset. | ||
| TP | FP | TN | FN | TPR | FPR | PPV | ACC | |
|---|---|---|---|---|---|---|---|---|
| CLR | 3 | 0 | 3 | 0 | 1 | 0 | 1 | 1 |
| ARACNE | 3 | 0 | 3 | 0 | 1 | 0 | 1 | 1 |
| MRNET | 3 | 1 | 2 | 0 | 1 | 0.333 | 0.750 | 0.833 |
| MI3 | 2 | 3 | 0 | 1 | 0.667 | 1 | 0.400 | 0.333 |
| MIDER | 3 | 0 | 3 | 0 | 1 | 0 | 1 | 1 |
| PCA-PMI | 3 | 1 | 2 | 0 | 1 | 0.333 | 0.750 | 0.833 |
| RRMRNET | 3 | 0 | 3 | 0 | 1 | 0 | 1 | 1 |
Second, we tested the proposed method on the reaction chain with 8 species. Like the above process, we ran RRMRNET several times, and the results showed it could infer unique network structures. For a more detailed description of the regulation relationships in the network, the network structure of the different methods is shown in Fig. 4. Compared to the true network, our method missed 1 true edge (TP = 6, FN = 1) and introduced 2 redundant edges (FP = 2). To further evaluate the effectiveness of our method, we compared the RRMRNET with the other algorithms (see Table 3). The table shows that the CLR and ARACNE performed the best of all the methods (PPV = 0.857, ACC = 0.929), whereas the MI3 performed the worst (PPV = 0.154, ACC = 0.429). The MRNET and PCA-CMI identified most of the true edges (TPR = 0.857) but also produced many redundant edges. Obviously, the performance of our method was better than that of the MRNET and PCA-PMI, particularly regarding false positives (FPR = 0.095). This shows that eliminating redundancy can improve the accuracy of network prediction. Compared to the two methods with the best performance, RRMRNET performed poorly in avoiding redundant edges, but the performance difference was very small. Note that the excellent performance of CLR and ARACNE depends on the threshold selection. If the threshold were adjusted, the performance of these methods might be reduced. Therefore, RRMRNET has high stability and is an effective choice for inferring a chain structure network.
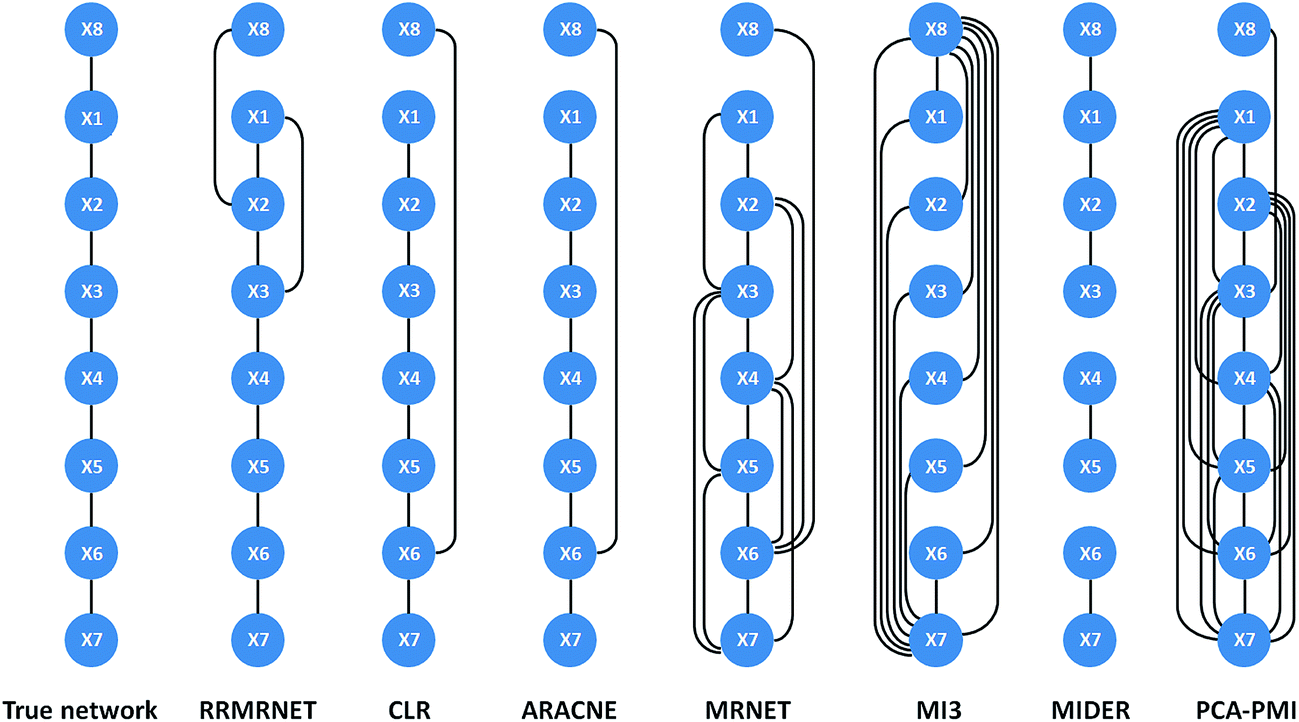 | ||
| Fig. 4 Comparison of the different methods on the reaction chain with 8 species dataset. | ||
| TP | FP | TN | FN | TPR | FPR | PPV | ACC | |
|---|---|---|---|---|---|---|---|---|
| CLR | 6 | 1 | 20 | 1 | 0.857 | 0.048 | 0.857 | 0.929 |
| ARACNE | 6 | 1 | 20 | 1 | 0.857 | 0.048 | 0.857 | 0.929 |
| MRNET | 6 | 9 | 12 | 1 | 0.857 | 0.429 | 0.400 | 0.643 |
| MI3 | 2 | 11 | 10 | 5 | 0.286 | 0.524 | 0.154 | 0.429 |
| MIDER | 5 | 0 | 21 | 2 | 0.714 | 0 | 0.625 | 0.929 |
| PCA-PMI | 6 | 16 | 5 | 1 | 0.857 | 0.762 | 0.273 | 0.393 |
| RRMRNET | 6 | 2 | 19 | 1 | 0.857 | 0.095 | 0.750 | 0.893 |
Results for the DREAM3 challenge network
To demonstrate and verify that the proposed method can be used to infer an accurate regulatory network from simulated data, we performed tests on DREAM3. The DREAM3 challenge network is an edition of the DREAM project that provides some gene expression datasets and their corresponding golden network to assess the performance of inferred models. We used yeast gene expression data with network sizes of 10, 50 and 100.First, we tested the proposed method on the yeast gene expression dataset with 10 genes. To ensure the validity of the test, we ran the program several times, and the results indicated that the same and unique network structure could be obtained from each test. Fig. 5 shows the network structures inferred by RRMRNET and the other six algorithms. As can be observed from the figure, RRMRNET could infer all of the correct edges and had no redundant edges, indicating that the network structure inferred by RRMRNET had same network topology as the real network. For the networks inferred by other algorithms, there were some redundant and missing edges. Clearly, the proposed method had good predictive performance. To further validate the performance of our method from a quantitative perspective, comparative analyses of different methods are summarized in Table 4. From the table, we can see our method could select 10 correct edges (TP = 10) with 0 redundant edges (FP = 0), and achieved the highest true positive rate (TPR = 1) with the lowest false positive rate (FPR = 0). Furthermore, the positive predictive value and the accuracy were quite high (PPV = 1, ACC = 1). Compared to RRMRNET, MRNET identified only 6 correct edges and introduced 10 redundant edges. The positive predictive value and accuracy of MRNET were only 0.333 and 0.644, respectively. Therefore, the performance of RRMRNET was obviously superior to MRNET. In this dataset, the PCA-PMI demonstrated excellent performance in most of metrics, but it did not perform better than the RRMRNET. For the other four methods, the numbers of correct edges ranged between 6 and 8, and the numbers of redundant edges ranged between 6 and 12. Furthermore, the best positive predictive value and the accuracy among the methods were 0.571 and 0.822, while our method achieved values of 1 for the two metrics. These findings show that our method can indeed eliminate most of the redundant regulatory relationships through the redundancy reduction strategy. It is worthwhile to note that RRMRNET removed the redundant edge G2–G9 and identified the true edge G4–G9, which was not possible using the other methods. This difference is because our method can accurately find the regulatory gene that has maximum relevance for the target gene. Taken together, these data show that the redundancy reduction technique helps to improve the performance of regulatory network inference.
 | ||
| Fig. 5 Comparison of the different methods on the DREAM3-10 gene dataset. | ||
| TP | FP | TN | FN | TPR | FPR | PPV | ACC | |
|---|---|---|---|---|---|---|---|---|
| CLR | 6 | 10 | 25 | 4 | 0.600 | 0.286 | 0.375 | 0.689 |
| ARACNE | 6 | 6 | 29 | 4 | 0.600 | 0.171 | 0.500 | 0.778 |
| MRNET | 6 | 12 | 23 | 4 | 0.600 | 0.343 | 0.333 | 0.644 |
| MI3 | 8 | 6 | 29 | 2 | 0.800 | 0.171 | 0.571 | 0.822 |
| MIDER | — | — | — | — | — | — | — | — |
| PCA-PMI | 9 | 1 | 34 | 1 | 0.900 | 0.029 | 0.900 | 0.956 |
| RRMRNET | 10 | 0 | 35 | 0 | 1 | 0 | 1 | 1 |
We then tested the proposed method on the yeast gene expression dataset with 50 genes. In the experiment, we observed that RRMRNET could not obtain a unique result when the program was run several times, principally because the clustering results in the process of reducing redundancy became unstable with the increase in gene number. It is notable that the difference between the results was not significant. To ensure the fairness of the test, we performed this process 20 times and obtained the mean results. Table 5 shows the experimental results using RRMRNET. On average, RRMRNET was capable of selecting 38 correct edges from 77 edges and introduced 56 redundant edges. In the tests, we observed the best results of TP and FP to be 40 and 49, respectively. These findings indicate that our method is able to identify most of the regulatory relationships. To further evaluate the performance of RRMRNET, we compared it with other methods. As seen in Table 5, the TPR of our method was 0.491, whereas the TPR of the other six methods was between 0.052 and 0.675. The PCA-PMI was the only method to exceed the RRMRNET in TPR. On the other hand, the FPR of our method was only 0.049, whereas the minimum FPR of the other six methods was 0.054. Our method could clearly identify more correct edges and avoid the redundant edges. Furthermore, our method also exceeded the other methods in other metrics, especially accuracy, which was 0.922. Our method clearly performed better than the other tested methods.
| TP | FP | TN | FN | TPR | FPR | PPV | ACC | |
|---|---|---|---|---|---|---|---|---|
| CLR | 19 | 165 | 983 | 58 | 0.247 | 0.144 | 0.103 | 0.818 |
| ARACNE | 13 | 125 | 1023 | 64 | 0.170 | 0.109 | 0.094 | 0.846 |
| MRNET | 21 | 215 | 933 | 56 | 0.273 | 0.187 | 0.089 | 0.779 |
| MI3 | 21 | 68 | 1080 | 56 | 0.273 | 0.059 | 0.236 | 0.899 |
| MIDER | 4 | 79 | 1069 | 73 | 0.052 | 0.069 | 0.048 | 0.876 |
| PCA-PMI | 52 | 133 | 1015 | 25 | 0.675 | 0.116 | 0.281 | 0.871 |
| RRMRNET | 38 | 56 | 1092 | 39 | 0.491 | 0.049 | 0.402 | 0.922 |
Finally, we tested the proposed method on the yeast gene expression dataset with 100 genes. We also performed this process 20 times and obtained the mean results, which are shown in Table 6. On average, the RRMRNET can select approximately 92 correct edges and introduce 238 redundant edges. We note that the TPR value of the RRMRNET was 0.555, whereas the FPR value was only 0.050. Clearly, it can infer most of the correct edges. We also compared the RRMRNET with the other methods. As shown in Table 6, we can observe that the RRMRNET outperforms the CLR, ARACNE and MRNET in all metrics. Compared to the MIDER and MI3, the ACC value of the RRMRNET is slightly lower, but the RRMRNET significantly outperformed the two methods in TPR and PPV. This shows that the RRMRNET is more suitable for the inference of network structure. Among these methods, the PCA-PMI showed superior performance in most metrics, better than the RRMRNET in FPR, PPV and ACC. However, there is no significant difference between the two methods in these metrics. These findings show that the proposed method has good generalization and can be a reliable option for inferring the network structure.
| TP | FP | TN | FN | TPR | FPR | PPV | ACC | |
|---|---|---|---|---|---|---|---|---|
| CLR | 39 | 713 | 4071 | 127 | 0.235 | 0.149 | 0.052 | 0.830 |
| ARACNE | 20 | 417 | 4367 | 146 | 0.121 | 0.087 | 0.046 | 0.886 |
| MRNET | 49 | 984 | 3800 | 117 | 0.295 | 0.206 | 0.047 | 0.778 |
| MI3 | 27 | 165 | 4619 | 139 | 0.163 | 0.035 | 0.141 | 0.939 |
| MIDER | 13 | 80 | 4704 | 153 | 0.078 | 0.017 | 0.140 | 0.952 |
| PCA-PMI | 90 | 151 | 4633 | 76 | 0.542 | 0.032 | 0.373 | 0.954 |
| RRMRNET | 92 | 238 | 4546 | 74 | 0.555 | 0.050 | 0.280 | 0.937 |
Results for SOS network in E. coli
The SOS network is a sign pathway in the SOS DNA repair system. The expression data in E. coli are real gene expression data derived from interference experiments. To verify that RRMRNET can also be used to infer an accurate regulatory network from real expression data, RRMRNET was tested on the SOS network dataset from E. coli.Similar to the above experiments, we performed RRMRNET on the dataset from E. coli several times and obtained the same and unique network structures. A comparative analysis of the RRMRNET and the other six algorithms is presented in Table 7. Our method could select 10 correct edges (TP = 10) with 2 redundant edges (FP = 2). The TPR value and FPR value achieved 0.417 and 0.167, respectively. Although fewer correct edges were selected by our method than by the CLR, MRNET and PCA-PMI, the number of redundant edges in our method was the least of all methods. It is notable that the MIDER could not be used with the E. coli dataset. Furthermore, the ACC of our method was better than all of the other methods except the MRNET and PCA-PMI, but the PPV of our method was superior to all of the other methods except the PCA-PMI. In the experiment, we noted that our method's performance was not as good as in previous experiments in some metrics, which may be related to the complexity of the network structure (the nodes had large numbers of edges) and the noise.
| TP | FP | TN | FN | TPR | FPR | PPV | ACC | |
|---|---|---|---|---|---|---|---|---|
| CLR | 12 | 5 | 7 | 12 | 0.500 | 0.417 | 0.706 | 0.528 |
| ARACNE | 7 | 3 | 9 | 17 | 0.292 | 0.250 | 0.700 | 0.444 |
| MRNET | 17 | 6 | 6 | 7 | 0.708 | 0.500 | 0.739 | 0.639 |
| MI3 | 9 | 5 | 7 | 15 | 0.375 | 0.417 | 0.643 | 0.444 |
| MIDER | — | — | — | — | — | — | — | — |
| PCA-PMI | 19 | 3 | 9 | 5 | 0.792 | 0.250 | 0.864 | 0.778 |
| RRMRNET | 10 | 2 | 10 | 14 | 0.417 | 0.167 | 0.833 | 0.556 |
Comparison of AUROC performance
In the above experiments, the threshold of RRMRNET was fixed for all datasets, but for other methods, the optimal threshold or default settings were chosen. To ensure the reliability of the experiments, Table 8 gives the AUROC scores of all of the methods except the MI3 on the six datasets. From the table, we can observe that the AUROC scores of the CLR ARACNE, MIDER and our method were all 1 in a dataset with a reaction chain with 4 species, which were better than the MRNET and PCA-PMI. For the DREAM3-10 gene dataset, the AUROC score of the RRMRNET and PCA-PMI all reached 0.994, but the AUROC scores of the other methods were between 0.629 and 0.704, indicating that our method significantly outperformed the other methods. Apparently, the RRMRNET can achieve the highest AUC score of the two dataset. For an 8-species reaction chain dataset, although the AUROC score of the RRMRNET was less than the AUROC score of the ARACNE, it still reached 0.953, which was better than the other methods. As for the other three datasets, the AUROC scores of the RRMRNET were superior to the other methods except the PCA-PMI. Taken together, all of the data indicate that the proposed method is highly reliable and efficient.| Datasets | CLR | ARACNE | MRNET | MIDER | PCA-PMI | RRMRNET |
|---|---|---|---|---|---|---|
| Reaction chain with 4 species | 1 | 1 | 0.889 | 1 | 0.889 | 1 |
| Reaction chain with 8 species | 0.945 | 0.961 | 0.939 | 0.851 | 0.640 | 0.953 |
| DREAM3 10 genes | 0.654 | 0.709 | 0.629 | — | 0.994 | 0.994 |
| DREAM3 50 genes | 0.542 | 0.531 | 0.530 | 0.509 | 0.828 | 0.786 |
| DREAM3 100 genes | 0.534 | 0.517 | 0.531 | 0.548 | 0.834 | 0.807 |
| S0S | 0.559 | 0.519 | 0.559 | — | 0.771 | 0.674 |
Discussion
In this paper, we emphasized that the redundancy reduction technique can be used to improve the accuracy of regulator network structure. Our method first used a redundancy control strategy based on information theory and clustering technology to remove redundant regulation relationships (non-regulation relationships and weakly indirect regulation relationships) between genes, and the remaining regulatory relationships were reserved as input to MRNET. To avoid redundant regulation caused by noise, an effective method combined mutual information with conditional mutual information to assign the best-first regulatory gene for each gene, which was used in the best-first incremental search algorithm in MRNET. Finally, the reserved regulation relationships and the best-first regulatory gene of each gene were used in the MRNET to infer the regulatory network. Thus, in theory, our method (RRMRNET) could eliminate redundant regulation relationships and improve regulatory network structure.RRMRNET was tested in simulation and with real data. For the simulation data, the method had excellent performance results. For the 4-species reaction chain dataset and the DREAM3-10 gene dataset, RRMRNET generated exactly the same network structure as the true network. Note that with the DREAM3-10 gene dataset, the method could simultaneously identify the true regulation relationship edge G4–G9 and the redundant regulation relationship edge G4–G2, which was not possible with the other methods we tested. The results indicate that the two redundancy reduction strategies proposed in the method could effectively remove redundant regulation relationships. For the real data, the performance of our method was satisfactory. Although our approach did not identify the most regulatory relationships for the SOS network in E. coli among the methods tested, it avoided most of the redundant regulatory relationships, which may be related to the complexity of network structure and the amount of noise in the data.
Our method was run several times for each dataset. From the results, we noted that the method could generate a unique network structure on all of the datasets except for the DREAM3-50 gene dataset and the DREAM3-100 gene dataset, possibly due to clustering technology used in the procedure for eliminating redundant regulation. In more detail, the clustering results for small-sized networks are often relatively stable, which means that the same redundant regulation is removed each time; therefore, the inferred network structure is unique. In contrast, the clustering results for networks with large sizes may not be unique, which may in turn mean that the redundant regulation is not different and that the network structure is not unique. Although the network structure inferred in the repeated tests may not be unique with some datasets, the difference between the results was not significant. For example, for the DREAM3-50 gene dataset, the PPV was between 0.380 and 0.430, and the ACC was between 0.919 and 0.927, demonstrating the stability of our method for network inference.
The RRMRNET was compared with six network inference methods with different evaluation metrics. The performance of the RRMRNET was superior to those of the other six inference methods for most datasets. For certain datasets, although the performance of RRMRNET was not the best in some metrics, the excellent performance of the method was achieved by use of a fixed threshold. Notably, the RRMRNET achieved excellent performance on the comparison of the AUROC scores for the six datasets using the different methods. These results confirmed that the performance of RRMRNET was superior.
Conclusions
In this paper, we developed a novel fixed-threshold network inference method, RRMRNET, to improve regulatory network structure using redundancy reduction in the MRNET algorithm. In our method, a strategy based on information theory and clustering technology is used to eliminate redundant regulation relationships between genes, and then the reserved regulation relationships are fed to MRNET for inferring the gene network. Moreover, our method presents an effective way to combine MI with conditional mutual information to assign the best-first regulator gene to each target gene, which is used to improve the performance of the best-first incremental search algorithm in MRNET. In the procedure of inferring network structure, a fixed threshold is used to adjust regulation relationships. Our method was validated on six standard datasets, and also compared with six existing network inference methods. The results confirmed that the performance of the RRMRNET was superior.Acknowledgements
This study is supported by the National Natural Science Foundation of China (Grant No. 11171369, 61272395, 61370171, 61300128, 61472127, 61572178 and 61672214), National Natural Science Foundation of Hunan Province (Grant No. 12JJ2041) and the Planned Science and Technology Project of Hunan Province (Grant No. 2014FJ3079).References
- G. Altay and F. Emmertstreib, Inferring the conservative causal core of gene regulatory networks, BMC Syst. Biol., 2010, 4(1), 132 CrossRef PubMed.
- K. Basso, A. A. Margolin and G. Stolovitzky, et al. Reverse engineering of regulatory networks in human B cells, Nat. Genet., 2005, 37(4), 382 CrossRef CAS PubMed.
- L. Elnitski, V. X. Jin and P. J. Farnham, et al. Locating mammalian transcription factor binding sites: a survey of computational and experimental techniques, Genome Res., 2006, 16(12), 1455 CrossRef CAS PubMed.
- S. R. Maetschke, P. B. Madhamshettiwar and M. J. Davis, et al. Supervised, semi-supervised and unsupervised inference of gene regulatory networks, Briefings Bioinf., 2014, 15(2), 195 CrossRef PubMed.
- G. Altay and F. Emmertstreib, Inferring the conservative causal core of gene regulatory networks, BMC Syst. Biol., 2010, 4(1), 132 CrossRef PubMed.
- A. A. Margolin, W. Kai and K. L. Wei, et al. Reverse engineering cellular networks, Nat. Protoc., 2006, 1(2), 662–671 CrossRef CAS PubMed.
- V. A. Huynh-Thu, A. Irrthum and L. Wehenkel, et al. Inferring regulatory networks from expression data using tree-based methods, PLoS One, 2010, 5(9), 4439–4451 Search PubMed.
- Y. Wang, T. Joshi and X. S. Zhang, et al. Inferring gene regulatory networks from multiple microarray datasets, Bioinformatics, 2006, 22(19), 2413–2420 CrossRef CAS PubMed.
- B. Liao, Y. Jiang and G. Yuan, et al. Learning a Weighted Meta-Sample Based Parameter Free Sparse Representation Classification for Microarray Data, PLoS One, 2014, 9(8), e104314 Search PubMed.
- W. J. R. Longabaugh, E. H. Davidson and H. Bolouri, Computational representation of developmental genetic regulatory networks, Dev. Biol., 2005, 283(1), 1–16 CrossRef CAS PubMed.
- K. Guy and S. Ron, Modelling and analysis of gene regulatory networks, Nat. Rev. Mol. Cell Biol., 2008, 9(10), 770–780 CrossRef PubMed.
- A. Ocone, A. J. Millar and G. Sanguinetti, Hybrid regulatory models: a statistically tractable approach to model regulatory network dynamics, Bioinformatics, 2013, 29(7), 910 CrossRef CAS PubMed.
- M. Bansal, V. Belcastro and A. Ambesi-Impiombato, et al. How to infer gene networks from expression profiles, Mol. Syst. Biol., 2007, 3(1), 78 Search PubMed.
- Z. Li, P. Li and A. Krishnan, et al. Large-scale dynamic gene regulatory network inference combining differential equation models with local dynamic Bayesian network, analysis, Bioinformatics, 2011, 27(19), 2686–2691 CrossRef CAS PubMed.
- H. Kim, J. K. Lee and T. Park, Boolean networks using the chi-square test for inferring large-scale gene regulatory networks, BMC Bioinf., 2007, 8(1), 37 CrossRef PubMed.
- C. C. Chen and S. Zhong, Inferring gene regulatory networks by thermodynamic modeling, BMC Genomics, 2008, 9(2), 1–7 Search PubMed.
- E. Keedwell and A. Narayanan, Discovering gene networks with a neural-genetic hybrid, IEEE/ACM Trans. Comput. Biol. Bioinf., 2005, 2(3), 231–242 CrossRef CAS PubMed.
- J. X. Zhou, A. Samal and A. F. d’Hérouël, et al. Relative stability of network states in Boolean network models of gene regulation in development, BioSystems, 2016, 142, 15–24 CrossRef PubMed.
- J. Yu, V. A. Smith and P. P. Wang, et al. Advances to Bayesian network inference for generating causal networks from observational biological data, Bioinformatics, 2004, 20(18), 3594–3603 CrossRef CAS PubMed.
- X. W. Chen, G. Anantha and X. Wang, An effective structure learning method for constructing gene networks, Bioinformatics, 2006, 22(11), 1367–1374 CrossRef CAS PubMed.
- Y. Watanabe, S. Seno and Y. Takenaka, et al. An estimation method for inference of gene regulatory network using Bayesian network with uniting of partial problems, BMC Genomics, 2012, 13(1), S12 CrossRef PubMed.
- L. Y. Lo, M. L. Wong and K. H. Lee, et al. High-order dynamic Bayesian Network learning with hidden common causes for causal gene regulatory network, BMC Bioinf., 2015, 16(1), 395 CrossRef PubMed.
- T. Chen, H. L. He and G. M. Church, Modeling gene expression with differential equations, Pacific Symposium on Biocomputing, 2001, vol. 4, p. 29 Search PubMed.
- B. D. Di, T. S. Gardner and J. J. Collins, Robust identification of large genetic networks, Pacific Symposium on Biocomputing, 2004, pp. 486–497 Search PubMed.
- M. Zheng, G. Liu and D. Wang, et al. Gene regulatory network reconstruction with multiple dataset fusion and differential equation, 2010 Fifth International Conference on Frontier of Computer Science and Technology (FCST), IEEE, 2010, pp. 454–458 Search PubMed.
- W. P. Lee and W. S. Tzou, Computational methods for discovering gene networks from expression data, Briefings Bioinf., 2009, 10(4), 408–423 CAS.
- M. Tan, M. Alshalalfa and R. Alhajj, et al. Influence of Prior Knowledge in Constraint-Based Learning of Gene Regulatory Networks, IEEE/ACM Trans. Comput. Biol. Bioinf., 2009, 8(1), 130–142 CrossRef PubMed.
- D. M. Chickering, D. Heckerman and C. Meek, Large-Sample Learning of Bayesian Networks is NP-Hard, J. Mach. Learn. Res., 2012, 5(4), 1287–1330 Search PubMed.
- Y. X. Wang and H. Huang, Review on statistical methods for gene network reconstruction using expression data, J. Theor. Biol., 2014, 362, 53 CrossRef PubMed.
- J. Ruyssinck, V. A. Huynhthu and P. Geurts, et al. NIMEFI: Gene Regulatory Network Inference using Multiple Ensemble Feature Importance Algorithms, PLoS One, 2014, 9(3), e92709 Search PubMed.
- H. Brunel, J. J. Gallardo-Chacon and A. Buil, et al. MISS: a non-linear methodology based on mutual information for genetic association studies in both population and sib-pairs analysis, Bioinformatics, 2010, 26(15), 1811–1818 CrossRef CAS PubMed.
- X. Zhang, X. M. Zhao and K. He, et al. Inferring gene regulatory networks from gene expression data by path consistency algorithm based on conditional mutual information, Bioinformatics, 2012, 28(1), 98–104 CrossRef CAS PubMed.
- A. J. Butte and I. S. Kohane, Mutual information relevance networks: functional genomic clustering using pairwise entropy measurements, Pacific Symposium on Biocomputing, 2000, vol. 5, p. 418 Search PubMed.
- J. J. Faith, H. Boris and J. T. Thaden, et al. Large-scale mapping and validation of Escherichia coli transcriptional regulation from a compendium of expression profiles, PLoS Biol., 2007, 5(1), e8 Search PubMed.
- A. A. Margolin, I. Nemenman and K. Basso, et al. ARACNE: an algorithm for the reconstruction of gene regulatory networks in a mammalian cellular context, BMC Bioinf., 2006, 7(1), S7 CrossRef PubMed.
- P. E. Meyer, K. Kontos and F. Lafitte, et al. Information-theoretic inference of large transcriptional regulatory networks, EURASIP J. Bioinf. Syst. Biol., 2007, 2007(1), 79879 Search PubMed.
- M. A. H. Akhand, R. N. Nandi and S. M. Amran, et al., Gene Regulatory Network Inference Using Maximal Information Coefficient, Bulletin of the American Mathematical Society, 2015, vol. 38(10), pp. 723–724 Search PubMed.
- W. Luo, K. D. Hankenson and P. J. Woolf, Learning transcriptional regulatory networks from high throughput gene expression data using continuous three-way mutual information, BMC Bioinf., 2008, 9(1), 467 CrossRef PubMed.
- A. F. Villaverde, J. Ross and F. Morán, et al. MIDER: network inference with mutual information distance and entropy reduction, PLoS One, 2014, 9(5), e96732 Search PubMed.
- J. Zhao, Y. Zhou and X. Zhang, et al. Part mutual information for quantifying direct associations in networks, Proc. Natl. Acad. Sci. U. S. A., 2016, 113(18), 201522586 Search PubMed.
- W. Liu, W. Zhu and B. Liao, et al. Gene Regulatory Network Inferences Using a Maximum-Relevance and Maximum-Significance Strategy, PLoS One, 2016, 11(11), e0166115 Search PubMed.
- M. S. Samoilov, Reconstruction and functional analysis of general chemical reactions and reaction networks, Ph.D. thesis, Stanford University, 1997.
- M. Samoilov, A. Arkin and J. Ross, On the deduction of chemical reaction pathways from measurements of time series of concentrations, Chaos, 2001, 11(1), 108–114 CrossRef CAS PubMed.
- D. Marbach, R. J. Prill and T. Schaffter, et al. Revealing strengths and weaknesses of methods for gene network inference, Proc. Natl. Acad. Sci. U. S. A., 2010, 107(14), 6286–6291 CrossRef CAS PubMed.
- M. Ronen, R. Rosenberg and B. I. Shraiman, et al. Assigning numbers to the arrows: parameterizing a gene regulation network by using accurate expression kinetics, Proc. Natl. Acad. Sci. U. S. A., 2002, 99(16), 10555–10560 CrossRef CAS PubMed.
| This journal is © The Royal Society of Chemistry 2017 |