 Open Access Article
Creative Commons Attribution 3.0 Unported Licence
Influence of releasing graphene oxide into a clayey sand: physical and mechanical properties
Guo-Xiang Zhouabc,
Jing Zhong*ab,
Heng Zhangc,
Xinhua Huc,
Jianlin Wuc,
Nikhil Koratkard and
Xianming Shi *ce
*ce
aKey Lab of Structure Dynamic Behavior and Control (Harbin Institute of Technology), Ministry of Education, Harbin 150090, Heilongjiang, China. E-mail: zhongjing@hit.edu.cn
bSchool of Civil Engineering, Harbin Institute of Technology, Harbin 150090, China
cSchool of Civil Engineering and Architecture, Wuhan Polytechnic University, Wuhan 430023, China
dDepartment of Mechanical, Aerospace and Nuclear Engineering, Rensselaer Polytechnic Institute, 110 8th Street, Troy, New York 12180, USA
eLaboratory of Corrosion Science & Electrochemical Engineering, Department of Civil & Environmental Engineering, Washington State University, P.O. Box 642910, Pullman, WA 99164-2910, USA. E-mail: xianming.shi@wsu.edu
First published on 24th March 2017
Abstract
Graphene oxide (GO) is increasingly used in various applications, and the implications of this nano-sized material entering the natural environment are of great interest. GO is highly soluble in water, and its accumulation in soil could significantly alter the physical and mechanical properties of the soil. In this laboratory study, we mixed GO with a soil (clayey sand, SC) to systematically study the engineering properties and microstructure of the modified soil. The experimental results reveal that the physical and mechanical properties and microstructure of clayey sand can be significantly changed by the addition of a minute quantity of GO. The liquid limit and plasticity index of the soil steadily increased (up to a GO concentration of 0.08 wt%), whereas the plastic limit did not change significantly. The addition of GO (up to 0.08 wt%) into the soil generally decreased the soil's void ratio under a given hydrostatic consolidation pressure, while increasing its undrained shear strength. Such remarkable modifications of soil by minute amounts of GO can be attributed to the extremely high specific surface area of GO and its stable dispersion in water.
1. Introduction
Graphene, with its in-plane sp2 carbon lattice, possesses the most outstanding set of comprehensive properties, such as high mechanical strength, electrical/thermal conductivity and chemical stability.1–3 Recent years have witnessed its wide application, ranging from semiconductors, biotechnology, energy storage and conversion, to nanocomposites with high performance.4–6 Among all graphene derivatives, graphene oxide (GO) has been studied more extensively than others, mainly due to its relatively facile synthesis and hydrophilic characteristics, which enable highly stable dispersion in water.7,8From the perspective of ecological cycle, all graphene derivatives will eventually enter the natural environment and potentially accumulate, and thus their impact on water, microorganisms and the soil are all critically important. Indeed, research has uncovered that GO exhibits some toxicity to microorganisms by the mechanism of oxidative stress and penetration by the sharp edge of graphene.9–11 The transport patterns of GO in aqueous media, as well as its stability (in terms of physical agglomeration in aqueous systems and chemical reduction under sunlight radiation) has been investigated.12–14 Soils are one of the most important constituents of ecological system, where underground water is stored, fruits, vegetables and crops grow and a variety of microorganisms use as the principal habitat.15 Soil contamination places high risk on human populations, and the USA Environmental Protection Agency (EPA) estimates that over 10% of the land mass on the planet has been seriously polluted.16 Repair of contaminated soil is difficult and costly, due to the complex physicochemical characteristics of soil and its variation from place to place.17 The traditional soil contaminants (e.g. petroleum hydrocarbons, polynuclear aromatic hydrocarbons, pesticides and heavy metals) are mainly in the forms of molecules or ions. In contrast, nanomaterials are much larger (1–100 nm) and could result in unforeseen soil pollution problems.18–20 Therefore the study of nanomaterial/soil interactions is both timely and warranted.
With abundant hydrophilic functional groups on its surface, GO is likely to exhibit strong interaction with some of the constituents in a soil and thus pose great an impact on the physical and chemical behaviors of the soil. It is thus necessary to systematically investigate the effects of GO on the engineering properties of soils, charge distribution in soils, water retention properties of soils, and oxygen availability in soils, all of which are important for the activities of microorganisms. In this work, we report for the first time the impact of GO on the physical and mechanical properties and microstructure of a clayey sand. As detailed later, even a trace amount of GO has a significant impact on such properties of the soil, which results from the high specific surface area of GO and stable dispersion in water. We also report that GO intercalated between soil particles enhances the water absorption capability of this soil. The results suggest that a GO coating on soil particle surfaces could significantly alter the physicochemical environment in the soil.
2. Experimental
2.1 Materials
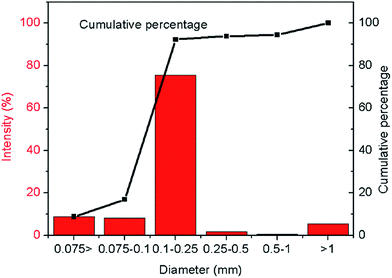
The soil employed in this study was purchased from NanFan Industrial Co. (Shanghai, China), the physical and chemical properties of which are listed in Table 1. The soil was classified as a Clayey Sand, SC, and its gradation curve is shown in Fig. 1. Since the stability and behaviors of GO in aqueous solution are sensitive to organic impurities that could be present in the soil, we used X-ray fluorescence (XRF) to examine the chemical composition of the soil. As revealed in Table 2, the soil mainly consists of mineral oxides (SiO2, Al2O3, Fe2O3, K2O, CaO, etc.). The carbon content in the soil, if any, is negligible, and so are possible effects of organic impurities. This was also confirmed by the examination of the soil sample with an Energy-Dispersive X-ray Spectrometer (data not reported here).| Property | Value |
|---|---|
| Specific gravity | 2.04 |
| Liquid limit | 26.2% |
| Plastic limit | 16.1% |
| Plasticity index | 10.1 |
| Average particle size | ∼0.2 mm |
| Granularity | ≤3 mm |
| Compound | Concentration (%) |
|---|---|
| SiO2 | 49.083 |
| Al2O3 | 17.669 |
| Fe2O3 | 4.098 |
| K2O | 2.524 |
| CaO | 1.228 |
| MgO | 0.718 |
| TiO2 | 0.521 |
| P2O5 | 0.105 |
| MnO | 0.089 |
| Na2O | 0.061 |
| BaO | 0.049 |
| SO3 | 0.044 |
| ZrO2 | 0.025 |
| CeO2 | 0.020 |
| ZnO | 0.011 |
| Rb2O | 0.009 |
| Cr2O3 | 0.007 |
| SrO | 0.005 |
| CuO | 0.004 |
| NiO | 0.003 |
| Ga2O3 | 0.002 |
The GO was synthesized from natural graphite powder (325 mesh) by the modified Hummer method.21 The specific process is as follows: graphite powder (∼2 grams) was mixed with concentrated sulfuric acid and sodium nitrate (∼1 grams) in a 250 ml reaction flask at 0 °C. Then ∼6 grams of potassium permanganate was gradually added with the temperature controlled to not exceed 20 °C, so as to avoid any defect to the plane of GO by overheat. After being stirred for ∼10 min, the mixture was heated to ∼35 °C and kept for ∼30 min. Next, one liter of deionized water was slowly added in ∼20 min, followed by addition of ∼30 ml of hydrogen peroxide (35 wt%) to reduce residual oxidants. The solid particles were collected via filtration, and washed thoroughly with 5 wt% HCl and deionized water. In the final step, the obtained yellowish GO powder was dried in a vacuum oven at ∼50 °C.
2.2 Preparation of GO–soil mixtures
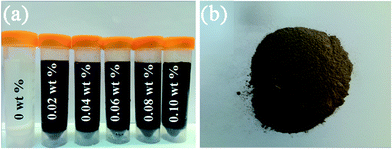
The water content in the soil was controlled at ∼25 wt%. Aqueous solutions with various GO concentrations were prepared via tip-sonication (Fig. 2), before being mixed well with water and the soil to obtain GO modified soil samples with the desired GO weight percentage. To prepare the GO/soil mixtures, soil particles were dropped into the GO solution gradually under stirring. Since the average size of soil particles was approximately 0.2 mm, which is orders of magnitude higher than that of GO, they were readily dispersed in the GO solution. In addition, the metal salts in each soil particle can help the soil particle attract GO nanosheets onto its surface. Subsequently, the mixtures were sealed in plastic bags and allowed to hydrate for at least 24 h, prior to the preparation of test samples. T0 denotes the soil without GO, while T1, T2, T3, T4 and T5 denote the soil with GO concentrations of 0.02, 0.04, 0.06, 0.08, and 0.1% by the total dry weight of the soil, respectively.2.3 Test procedures
Both tri-axial tests and oedometer tests22–25 were performed in accordance with GBJ123-88 (testing methods of soil and its standards, China).In addition, the microstructure of the GO modified soil was examined by an FEI HELIOS NanoLab 600i scanning electron microscope (SEM). A typical 20 kV accelerating voltage was used with a scan time of 60 seconds per sampling area.
3. Results and discussion
3.1 Physical properties of GO
As the most studied graphene derivative, GO has a plethora of functional groups, such as hydroxyl, carboxyl, and epoxy groups, grafted on the surface. These functional groups render GO highly hydrophilic, thus greatly facilitating the processing of graphene-based materials in water. The typical lateral size and thickness of the GO sheets are ∼1 μm, and 1 nm, respectively, as characterized in our previous report.293.2 Effect of GO on the plastic and liquid limits and plasticity index of soil
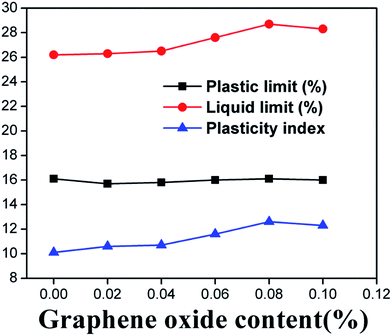
Fig. 3 shows that the plasticity index and liquid limit of the clayey sand steadily increased with the addition of GO (up to GO concentration of 0.08 wt%), whereas the plastic limit of the soil seemed non-sensitive to the addition of GO. The plasticity of soil is mainly controlled by the properties of water that is bound to the soil particles.30,31 Unlike free water, the bound water layer has greater viscosity, elasticity and shear strength.32 GO nanosheets have a considerable amount of functional groups on the surface, which endows GO with highly hydrophilic properties at near-neutral pH, attracting significant amount of water.33 The coating of the soil particles by GO is thus expected to increase the amount of the bound water, leading to an increase in the liquid limit of the soil. We hypothesize that this mechanism was responsible for the observed influence of GO on the plastic index and liquid limit of the clayey sand. Apparently this mechanism was not significant when the moisture content in the soil was relatively low (below 26%) or when the GO content was relatively low (below 0.04%).The plastic limit can be understood as the minimum moisture content for the soil to remain in the plastic state. Under the investigated conditions, the addition of GO in the clayey sand exhibited negligible effect on the soil's plastic limit, as shown in Fig. 3. The mechanisms underlying this observation warrant in-depth investigations.
The thickness of the bound water layer is largely determined by the interfacial charge of the soil, which can be characterized by the zeta potential.34–36 As shown in Fig. 4, the zeta potential of the soil was increased from −17.2 to −19.2 mV with ∼0.08 wt% of GO addition. The increased zeta potential indicated the enhancement of the capability for soil particles to “capture” the water molecules.37 High effectiveness in GO's modification of the soil properties is attributable to the high specific surface area (∼2600 m2 g−1) of GO nanosheets and their stable dispersion in aqueous media.1 Consider 0.08 grams of GO mixed with 100 grams of dry soil particles with a density of 2.04 g cm−3 (corresponding to the sample T4 in this study). Assuming a spherical shape with an average diameter of 0.2 mm, the specific surface area of soil particles is estimated to be approximately 0.0147 m2 g−1. The surface area of GO (2600 m2 g−1 × 0.08 g = 208 m2) is much large than that of soil particles (0.0147 m2 g−1 × 100 g = 1.47 m2). This estimation illustrates that although the concentration or weight fraction of GO sheets is very low, their surface area is sufficient to encapsulate each soil particle with an average number of GO layers of more than 100. It should also be noted that if the soil particles are wrapped tightly by GO nanosheets, the minerals inside of the soil particles would be difficult leach out.38 This might be detrimental to the community of microorganisms, since the interaction of soil minerals and microorganisms is critical to their survival. Further, once the soil particles are coated with GO nanosheets, any contaminants present in the soil may not be easily extracted out from the soil, thus hindering the recovery of polluted soil. All these potential effects of GO on the biological environment in soil are important and merit further investigations.
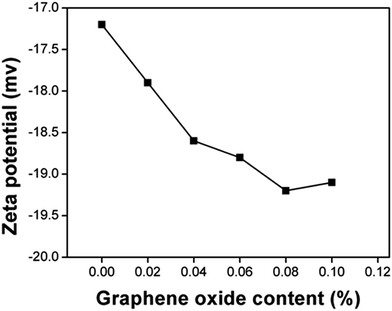 | ||
| Fig. 4 Zeta potential of the soil as a function of GO content (by weight). The zeta potential of GO in aqueous solution with pH value of 7 is ∼30. | ||
3.3 Effect of GO on the compressibility of soil
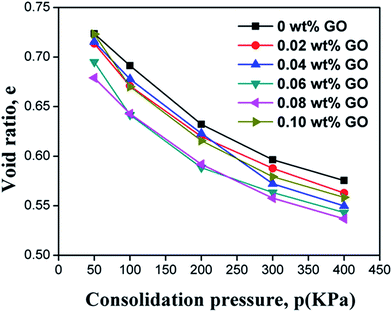
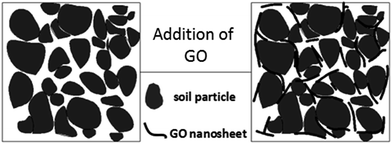
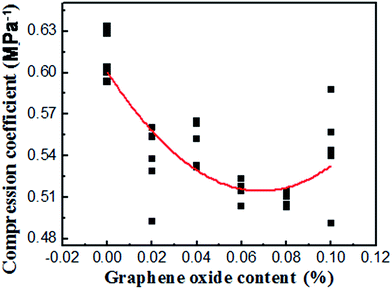
The relationship between the void ratio (e) and the logarithmic consolidation pressure (p) is presented in Fig. 5. It can be seen that the void ratio of the soil consistently decreased with the consolidation pressure. Adding GO into the soil generally decreased the void ratio of the soil under a given consolidation pressure, until the GO content exceeded 0.08 wt%. The decreased void ratio after the addition of GO provides compelling evidence that the “free” space between the soil particles, which can be easily compressed by an external force, is reduced.39 The GO sheets can physically fill the pores in the soil, as illustrated in Fig. 6. As evidenced by the results in Fig. 5, this filler effect was not the dominant one, due to the low concentration of GO in the soil. Instead, we hypothesize that the presence of GO nanosheets in the soil modifies the structure of the bound water layers, resulting in larger bound water phase which decreases the free space. This is consistent with the observed changes of plasticity and liquid index of the soil by GO. The water confined in the gaps between the soil particles and GO nanosheets is difficult to expel out of the soil samples, thus reducing the void ratio obtained from the compression tests. Once the GO content exceeded 0.08 wt%, however, this “bound water layer” effect became less significant. This is related to the dependency of GO's dispersion with its concentration. In other words, a high GO content in soil (e.g., 0.10 wt%) leads to the agglomeration of GO nanosheets, thus decreasing the effectiveness of soil modification by GO. This explanation is indirectly validated by the compression coefficient results shown in Fig. 7. Despite the noise in the experimental results, the average trend in Fig. 7 implies a minima in the compression coefficient (i.e., lowest compressibility) at around 0.08% GO content in the GO/soil composite.3.4 Effect of GO on the shear strength of soil
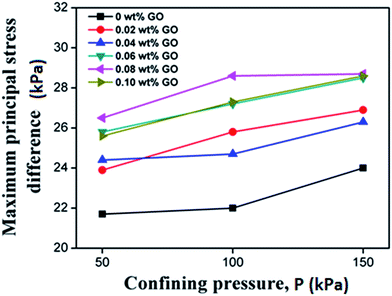
To evaluate the effect of GO on the undrained shear strength of the soil, soil samples were tested with the surrounding pressure of 50, 100, and 150 kPa, respectively. The maximum principal stress difference is indicative of shear strength according to the theory of solid mechanics, and its dependency on the confining pressure is shown in Fig. 8. The shear strength of all the clayey sand samples increased with the surrounding or confining pressure. Furthermore, Fig. 8 reveals that the shear strength of the soil increased with the GO content until it peaked at the GO content of 0.08% by weight of the soil. This suggests that the inter-connection between soil particles was enhanced by the presence of well-dispersed GO. This observation is consistent with the results of the e–p relationship in Fig. 5. The shear strength of soil mainly comes from the soil inter-particle interaction, such as the friction force.40 Due to the superior mechanical properties of graphene, it has been employed as reinforcement to improve the mechanical properties of various matrixes, such as polymers, metals and ceramics.41 Different from these conventional matrices, soil is more like a hydrogel with loose structure,20 and the soil skeleton is formed by the interconnected network of soil particles. When GO nanosheets are added, they intercalate between adjacent soil particles, and reinforce the inter-particle connections (Fig. 6). The binding of GO nanosheets to the soil could be further enhanced by the release of metal ions from the soil particles. In addition, the GO can also induce modification of the bound water structure and the double layer on soil particles, thus improving the integrity of the soil network.According to the Mohr–Coulomb strength theory, the shear strength of soil largely depends on two aspects: the cohesion C and internal friction angle φ, and both of which can be obtained from the experimental data of soil compression. The relationship is depicted as follows.
τf = C + σ![[thin space (1/6-em)]](https://www.rsc.org/images/entities/char_2009.gif) tan tan![[thin space (1/6-em)]](https://www.rsc.org/images/entities/char_2009.gif) φ φ
| (1) |
Table 3 lists the changes of cohesion and internal friction angle of soil with the GO content in the clayey sand. The experimental results reveal that the cohesion increased initially with the GO content until it reached the peak value at the GO content of 0.08% by weight of the soil. This trend clearly coincides with the increase of undrained shear strength by the presence of well-dispersed GO (as shown in Fig. 8). In contrast, the change of internal friction angle showed no clear trend with the increase in the GO content, implying more than one mechanism at work, which needs to be explored in future studies.
| Content (%) | 0 | 0.02 | 0.04 | 0.06 | 0.08 | 0.1 |
| Cohesion, C (kPa) | 10.02 | 11.13 | 11.5 | 12.69 | 12.72 | 11.91 |
| φ (°) | 0.65 | 0.84 | 0.54 | 0.4 | 0.63 | 0.85 |
The microstructure of the soil before and after the addition of GO can be seen in Fig. 9. Clearly, the presence of GO very effectively decreases the pores both in terms of number and size, creating a more well-integrated network of soil particles.
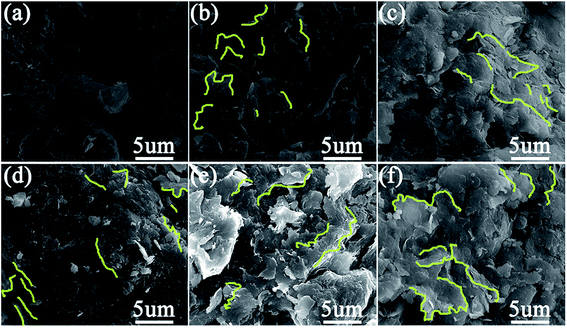 | ||
| Fig. 9 SEM images of soil samples reinforced by various content of GO: (a) 0 wt%; (b) 0.02 wt%; (c) 0.04 wt%; (d) 0.06 wt%; (e) 0.08 wt%; (f) 0.10 wt%. | ||
3.5 GO/soil interaction
As analyzed above, the GO/soil interaction is the key to understand the behaviors of soil mixed with GO. In light of the very low GO concentration in the soil and high roughness of the pristine soil particles, it is difficult to obtain direct observation of GO coated on the soil particles. As such, the following experiment was designed to shed light on the GO/soil interaction implied in Fig. 9. A two-layer immiscible liquid, with the 0.08% GO aqueous solution at its top and dichloromethane at its bottom, was prepared. Since GO nanosheets are super-hydrophilic, they would rather stay in water. Then, soil particles were gradually dropped into the beaker, and they transported sequentially through the two liquid layers, and eventually settled down on the bottom of the beaker.Note that GO nanosheets are super-hydrophilic, and it is thermodynamically unfavorable for them to diffuse into dichloromethane. When soil particles transport across the GO solution due to gravitational force, they should absorb a layer of GO film on their surface, if the GO/soil interaction is strong enough. On the other hand, if the GO/soil interaction is weak, the physically absorbed GO would be peeled off once in contact with dichloromethane. As implied by Fig. 10, after the soil sedimentation test, the color of GO solution was lighter, indicating the sorption of significantly amount of GO nanosheets onto soil particles which then settled down on the bottom of beaker. Based on the SEM images (Fig. 11), indeed, a thick layer of GO film can be observed that tightly and uniformly coated on soil particles, suggesting strong GO/soil interaction.
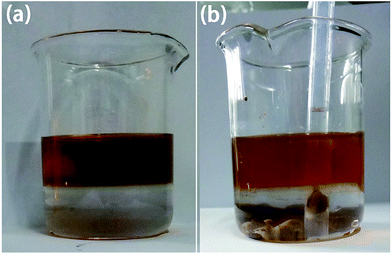 | ||
| Fig. 10 Images for the two layers of immiscible liquid (GO solution/dichloromethane), before (a) and after (b) the sedimentation test of soil particles. | ||
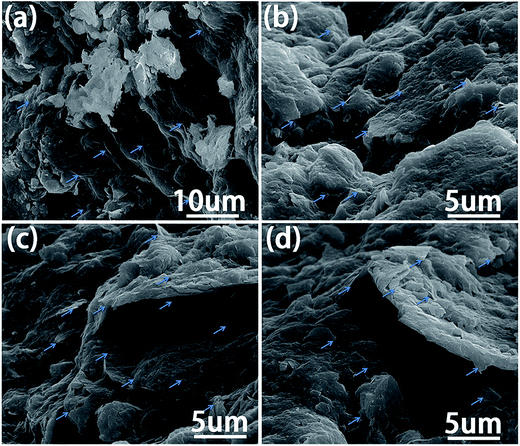 | ||
| Fig. 11 SEM images of the soil particles after the sedimentation test illustrated in Fig. 10. The arrows indicate their coating by GO. | ||
4. Conclusions
We have investigated for the first time the effects of GO on the physical and mechanical properties of a soil (Clayey Sand, SC). With only a small amount of GO (no more than 0.08% by weight), the properties of the clayey sand can be modified significantly, in terms of liquid limit, plasticity index, compressibility, and undrained shear strength. The effectiveness of GO as a soil modifier stems from its extremely high specific surface area (∼2600 m2 g−1) and very stable dispersion in water. The hydrophilic GO sheets intercalate into the spaces between the soil particles and help to increase the bound water content, leading to less compressibility of the clayey sand. The binding of GO nanosheets to the soil could be further enhanced by the release of metal ions from the soil particles. Such GO coating of soil particles might have detrimental effects for the microorganisms present in soil, and could have long-standing effects on the eco-system of soil, which should be the subject of future investigations.Acknowledgements
The authors gratefully acknowledge financial support by the ChuTian Scholar Visiting Professorship Fund provided by the Hubei Department of Education, China, as well as financial support by the National Natural Science Foundation of China (No. 51278390, WPU).References
- Y. Zhu, S. Murali and W. Cai, et al., Graphene and Graphene Oxide: Synthesis, Properties, and Applications, Adv. Mater., 2010, 22, 3906–3924 CrossRef CAS PubMed.
- A. K. Geim and K. S. Novoselov, The rise of grapheme, Nat. Mater., 2007, 6, 183–191 CrossRef CAS PubMed.
- D. Zheng, G. Tang and H. Zhang, et al., In situ thermal reduction of graphene oxide for high electrical conductivity and low percolation threshold in polyamide 6 nanocomposites, Compos. Sci. Technol., 2012, 72, 284–289 CrossRef CAS.
- A. A. Balandin, S. Ghosh and W. Bao, et al., Superior Thermal Conductivity of Single-Layer Graphene, Nano Lett., 2008, 8, 902–907 CrossRef CAS PubMed.
- W. Cai, Y. Zhu and X. Li, et al., Large area few-layer graphene/graphite films as transparent thin conducting electrodes, Appl. Phys. Lett., 2009, 95, 123115 CrossRef.
- X. Li, Y. Zhu and W. Cai, et al., Transfer of large-area graphene films for high-performance transparent conductive electrodes, Nano Lett., 2009, 9, 4359–4363 CrossRef CAS PubMed.
- Y. Hernandez, V. Nicolosi and M. Lotya, et al., High yield production of graphene by liquid phase exfoliation of graphite, Nat. Nanotechnol., 2008, 3, 563–568 CrossRef CAS PubMed.
- J. N. Coleman, et al., Two-dimensional nanosheets produced by liquid exfoliation of layered materials, Science, 2011, 331, 568–571 CrossRef CAS PubMed.
- W. Hu, C. Peng and W. Luo, et al., Graphene-based antibacterial paper, ACS Nano, 2010, 4, 4317–4323 CrossRef CAS PubMed.
- J. Chen, X. Wang and H. Han, A new function of graphene oxide emerges: inactivating phytopathogenic bacterium Xanthomonas oryzae pv. oryzae, J. Nanopart. Res., 2013, 15, 1–14 Search PubMed.
- O. Akhavan and E. Ghaderi, Toxicity of graphene and graphene oxide nanowalls against bacteria, ACS Nano, 2010, 4, 5731–5736 CrossRef CAS PubMed.
- J. Zhao, F. Liu and Z. Wang, et al., Heteroaggregation of graphene oxide with minerals in aqueous phase, Environ. Sci. Technol., 2015, 49, 2849–2857 CrossRef CAS PubMed.
- W. C. Hou, I. Chowdhury and D. G. Goodwin Jr, et al., Photochemical transformation of graphene oxide in sunlight, Environ. Sci. Technol., 2015, 49, 3435–3443 CrossRef CAS PubMed.
- Y. Shen and B. Chen, Sulfonated graphene nanosheets as a superb adsorbent for various environmental pollutants in water, Environ. Sci. Technol., 2015, 49, 7364–7372 CrossRef CAS PubMed.
- J. K. Jansson, FORUM: Microbiology the life beneath our feet, Nature, 2013, 494, 40–41 CrossRef CAS PubMed.
- L. Q. Ma, K. M. Komar and C. Tu, et al., A fern that hyperaccumulates arsenic, Shijie Huanjing, 2001, 409, 579 CrossRef CAS PubMed.
- V. M. Fridland, Structure of the soil mantle, Geoderma, 1974, 12, 35–41 CrossRef.
- M. Wang, S. B. Chen and N. Li, et al., Application of nanoscale amendments in remediation of polluted soils and waters: a review, Chin. J. Eco-Agric., 2010, 18, 434–439 CrossRef CAS.
- S. Patni and A. L. Bhatia, Nanotechnology: A double edged sword, Asian J. Exp. Sci., 2008, 22, 153–166 CAS.
- M. A. Albrecht, C. W. Evans and C. L. Raston, Green chemistry and the health implications of nanoparticles, Green Chem., 2006, 8, 417–432 RSC.
- W. S. Hummers and R. E. Offeman, Preparation of Graphitic Oxide, J. Am. Chem. Soc., 1958, 80, 1339 CrossRef CAS.
- L. C. Miao, Z. Z. Yin and S. Y. Liu, Empirical function representing the shear strength of unsaturated soils, Geotech. Test. J., 2001, 24(2), 220–223 CrossRef.
- O. M. Vilar, A simplified procedure to estimate the shear strength envelope of unsaturated soils, Can. Geotech. J., 2006, 43(10), 1088–1095 CrossRef.
- M. A. Hossain and J. H. Yin, Shear strength and dilative characteristics of an unsaturated compacted completely decomposed granite soil, Can. Geotech. J., 2010, 47(10), 1112–1126 CrossRef.
- H. Matsuoka, D. A. Sun and A. Kogane, et al., Stress–strain behavior of unsaturated soil in true triaxial tests, Can. Geotech. J., 2002, 39(3), 608–619 CrossRef.
- A. O. Landva, E. O. Korpijaakko and P. E. Pheeney, Geotechnical Classification of Peats and Organic Soils, Testing of Peats and Organic Soils, ASTM International, 1983 Search PubMed.
- P. P. Raj, Soil Mechanics & Foundation Engineering, Pearson Education India, 2008 Search PubMed.
- P. C. Hiemenz and R. Rajagopalan, Principles of Colloid and Surface Chemistry, Marcel Dekker Inc, 3rd edn, revised and expanded, 1997 Search PubMed.
- F. Xiang, R. Mukherjee, J. Zhong, Y. Xia, N. Gu, Z. Yang and N. Koratkar, Scalable and Rapid Far Infrared Reduction of Graphene Oxide for High Performance Lithium Ion Batteries, Energy Storage Mater., 2015, 1, 9–16 CrossRef.
- K. Tone, M. Kamori and Y. Shibasaki, Adsorbed Cations and Water Film Thickness on the Kaolinitic Clay Surface, J. Ceram. Soc. Jpn., 1993, 101, 1395–1399 CrossRef CAS.
- M. E. Grismer, Water vapor adsorption kinetics and isothermal infiltration, Soil Sci., 1988, 146, 297–302 CrossRef.
- M. E. Grismer, Water Vapor Adsorption and Specific Surface, Soil Sci., 1987, 144 Search PubMed.
- P. Poulin, R. Jalili, W. Neri, F. Nallet, T. Divoux and A. Colin, et al., Superflexibility of graphene oxide, Proc. Natl. Acad. Sci. U. S. A., 2016, 113, 11088–11093 CrossRef CAS PubMed.
- C. Y. Ou, S. C. Chien and Y. G. Wang, On the enhancement of electroosmotic soil improvement by the injection of saline solutions, Appl. Clay Sci., 2009, 44, 130–136 CrossRef CAS.
- G. P. Sheng, H. Q. Yu and X. Y. Li, Extracellular polymeric substances (EPS) of microbial aggregates in biological waste water treatment systems: A review, Biotechnol. Adv., 2010, 28, 882–894 CrossRef CAS PubMed.
- E. Mohamedelhassan and J. Q. Shang, Electrokinetics-generated pore fluid and ionic transport in an offshore calcareous soil, Can. Geotech. J., 2003, 40, 1185–1199 CrossRef CAS.
- I. L. Casagrande, Electro-Osmosis in Soils, Geotechnique, 1949, 1, 159–177 CrossRef.
- H. K. Chae, D. Y. Siberio-Pérez, J. Kim and Y. Go, et al., A route to high surface area, porosity and inclusion of large molecules in crystals, Nature, 2004, 427, 523–527 CrossRef CAS PubMed.
- M. R. Jones, L. Zheng and M. D. Newlands, Comparison of particle packing models for proportioning concrete constituents for minimum voids ratio, Mater. Struct., 2002, 35, 301–309 CAS.
- S. C. Chien, F. C. Teng and C. Y. Ou, Soil improvement of electroosmosis with the chemical treatment using the suitable operation process, Acta Geotech., 2014, 10, 1–8 Search PubMed.
- R. Verdejo, M. M. Bernal and L. J. Romasanta, et al., Graphene filled polymer nanocomposites, J. Mater. Chem., 2010, 21, 3301–3310 RSC.
| This journal is © The Royal Society of Chemistry 2017 |

