
 Open Access Article
 This Open Access Article is licensed under a
 Creative Commons Attribution 3.0 Unported Licence
High rate performance SnO2 based three-dimensional graphene composite electrode for lithium-ion battery applications†
Shi-yong Zuoa,
Zhi-guo Wu *ab,
Shuan-kui Lia,
De Yana,
Yan-hua Liuc,
Feng-yi Wanga,
Ren-fu Zhuoa,
Bai-song Genga,
Jun Wanga and
Peng-xun Yanb
*ab,
Shuan-kui Lia,
De Yana,
Yan-hua Liuc,
Feng-yi Wanga,
Ren-fu Zhuoa,
Bai-song Genga,
Jun Wanga and
Peng-xun Yanb
aSchool of Physical Science and Technology, Lanzhou University, Lanzhou, 730000, People’s Republic of China. E-mail: zgwu@lzu.edu.cn; Fax: +86 931 8913554; Tel: +86 0931 8912719
bInstitute of Nanomaterials Application Technology, Gansu Academy of Science, Lanzhou, 730000, People’s Republic of China
cSchool of Mechatronic Engineering, Lanzhou Jiaotong University, Lanzhou, 730000, People’s Republic of China
First published on 24th March 2017
Abstract
In order to improve the rate performance and cycling stability at high current densities of lithium-ion batteries (LIBs), a sample composite of SnO2 and three-dimensional graphene (SnO2/3DG) was fabricated using a hydrothermal method, with polystyrene balls (PS) as templates. The reversible capacity is 720.8 mA h g−1 at a current density of 100 mA g−1, after 100 cycles. The rate performance is also excellent, with a reversible capacity of about 800 mA h g−1 at 1000 mA g−1. The excellent electrochemical performance is attributed to its 3D structure, which possesses a large specific surface area and abundant reaction active positions, leading to fast kinetics and short pathways for both Li-ions and electrons.
1 Introduction
With the increasing environmental concerns and demands for energy, energy storage technologies are being rapidly developed. Lithium-ion batteries (LIBs), one of the most important energy storage devices, have been widely used in portable electronic equipment because of their superior properties such as high work voltage, high energy density, no memory effect, and environmental friendliness.1–5 But there are still some problems in their application, such as the lower power density, insufficient safety performance, and low cycling stability.3 Above all, improving the power density of LIBs, namely improving the cycling stability of LIBs at a higher charge–discharge current, is one of the most urgent problems.The slow solid-state diffusion of Li-ions within the electrode materials is the major limitation in improving the rate performance of LIBs.6 According to Fick’s law of diffusion, the relationship between Li-ion diffusion time (τ) and diffusion length (L) is given by τ = L2D−1.7–9 The diffusion time (τ) is directly proportional to the second power of the diffusion length (L), so the diffusion time can be effectively shortened by decreasing the diffusion length. Increasing the specific surface area of electrode materials is the major method used to decrease the diffusion length. Shuankui Li et al. obtained 3D-hierarchical SnS nanostructures, which exhibited a hollow structure of SnS nanoflowers assembled from nanosheets (about 14 nm thick) by the citric acid or salt-assisted ethylene glycol solvent-thermal method.10 The hollow structure and ultrathin sheets greatly facilitate Li-ion diffusion in electrode materials. Xiaolin Li et al. synthesized a large mesoporous Si sponge using an electrochemical etching method and, for its porosity, it demonstrated very good rate performance with specific capacities of 790 mA h g−1 at 0.1 A g−1, 630 mA h g−1 at 1 A g−1, 530 mA h g−1 at 2 A g−1, and 410 mA h g−1 at 4 A g−1.11 Linqi Zong et al. produced porous Si particles by combing modified ball-milling, annealing, and acid treating, and the porous Si particles showed an excellent rate performance of 880 mA h g−1 at a rate of 5C.12
Here, we used PS as templates to prepare a kind of porous material, which combined SnO2 with three-dimensional graphene (SnO2/3DG) by a hydrothermal method. In this kind of porous material, 3DG acts as the framework while the SnO2 nanoparticles were grown on the surface of the framework. The 3DG framework can supply the channels for electron transfer. SnO2 nanoparticles act as active materials for storing Li-ions. In addition, this kind of 3D porous structure with a huge specific surface area can increase the contact between the electrolyte and SnO2 nanoparticles. These properties play important roles in improving the rate performance of LIBs.
2 Experimental
2.1 Materials and methods
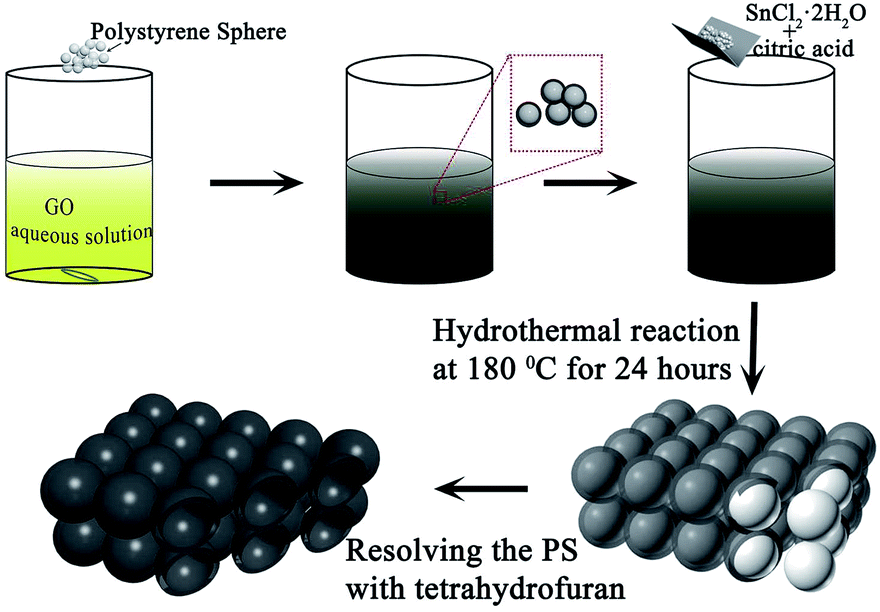 | ||
| Fig. 1 A schematic representation of the synthesis process. | ||
| Sample number | Quantity of PS (mg) | Quantity of GO (mg) | Ratio |
|---|---|---|---|
| Sample 1 | 0 | 50 | |
| Sample 2 | 25 | 50 | 0.5![[thin space (1/6-em)]](https://www.rsc.org/images/entities/char_2009.gif) :1 :1 |
| Sample 3 | 100 | 50 | 2:1 |
2.2 Electrochemical measurements
CR2016 type half cells were assembled using SnO2/3DG as the anode material in a high-purity argon-filled glovebox. The anodes were prepared by mixing the active materials carbon black and polyvinylidene (PVDF) at a weight ratio of 80:10:10 in a 1-methyl-2-pyrrolidinone (NMP) solvent to form a slurry. The mixture was coated on to Cu foil (the current collector) and dried at 80 °C for 24 hours. The typical loading density on the Cu foil was about 1.5 mg cm−2. Li foil was used as the counter electrode. LiPF6 (1 M) in ethylene carbonate (EC)/diethyl carbonate (DEC) (1:1 w/w) was used as the electrolyte. The charge/discharge tests were performed using a multi-channel battery workstation (LAND CT2001A model, Wuhan Jinnuo Electronics. Ltd., China) in a voltage window of 0.01–3.0 V at different current densities. The electrochemical tests were performed using an electrochemical workstation (Metrohm Autolab B.V.). Cyclic voltammetry (CV) was carried out between 3 V and 0.001 V at a scan rate of 0.1 mV s−1, electrochemical impedance spectroscopy was performed at frequencies ranging from 100 kHz to 0.001 Hz, and the amplitude of the signal was 5 mV.
3 Characterization
Following the materials synthesis, a wide range of characterization approaches were employed. The crystal structures were characterized using X-ray diffraction (XRD) on a Philips X’Pert Pro Diffractometer. Morphologies, microstructures, and compositions of the as-synthesized products were characterized using field-emission scanning electron microscopy (SEM, Hitachi S4800) with an acceleration voltage of 5 kV, and transmission electron microscopy (TEM, FEI Tecnai F30 (USA)) operated at 300 kV, both using Cuα1 radiation with λ = 1.54056 Å. Elemental mapping was completed using scanning electron microscopy (SEM, MIR A3, TESCAN). The Raman spectra and the X-ray photoelectron spectroscopy (XPS) data were determined on a laser Raman spectroscopy system (HORIBA Jobin Yvon LabRAM HR800) with a 532 nm line Ar ion laser as the excitation source and XPS spectrometers (XPS, Kartos AXIS Ultra DLD). A thermogravimetric analyzer (NETZSCH STA 449 C) was employed to investigate the loading of SnO2, with a heating rate of 10 °C min−1 from 25 to 800 °C in air.4 Results and discussion
FE-SEM and TEM characterization was carried out in order to investigate the morphology and microstructure of those samples. Fig. 2(1a and b) show the SEM images of sample 1, which illustrate that the GO nanosheets are reunited at hydrothermal conditions. Fig. 2(1c), the TEM image, clearly proves that the nanoparticles are grown homogeneously on the surfaces of the GO sheets. However, it is also shown that the GO nanosheets are much thicker than monolayer graphene. The reassociation can decrease the surface area of the composite and weaken the connection between the electrolyte and active material. It is also disadvantageous to the diffusion of Li-ions in the active material. In order to increase the surface area of the composite, a certain quantity of PS used as templates was added. After dissolving the PS with tetrahydrofuran, the other two samples (sample 2 and sample 3) with different amounts (refer to Table 1) of PS and GO were obtained. The morphologies and structures of sample 2 and sample 3 are shown in Fig. 2(2a–2c) and Fig. 2(3a–3e), respectively. Comparing with Fig. 2(1a), there are a mass of pores in samples 2 and 3, as shown in Fig. 2(2a) and (3a), that are not observed in sample 1. All pores are generated from the dissolved PS balls. With the dosage of PS increasing, the quantity of pores is increased, as seen by comparing Fig. 2(2a) with Fig. 2(3a). Fig. 2(3d) shows a high resolution TEM image of sample 3, which demonstrates that the SnO2 nanoparticles were homogeneously grown on the surface of the graphene nanosheets. And the open structure, which can facilitate the permeation of electrolyte, can also be confirmed in Fig. 2(3d). Fig. 2(3e) shows the selected area electron diffraction (SAED) pattern of sample 3. The diffraction rings indicate that sample 3 is multi-crystalline. There are five diffraction rings corresponding to the five crystal planes of the rutile structure of SnO2 (space group: P42/mnm (136), JCPDS no. 41-1445), namely the (110), (101), (210), (211), and (112) planes.15 To verify that the nanoparticles grew on the GO surface homogeneously, elemental mapping images (Fig. 2(3f–3h)) of sample 3 were obtained. The results clearly indicate that there is a uniform dispersion of the elements C, Sn, and O in the sample. The carbon content of different samples, as determined by thermogravimetric analysis (TGA) (Fig. S3†), is 18.35%, 32.7%, and 54%, respectively, indicating that sample 1 has a higher loading ratio of SnO2 on the GO surface. This result corresponds to the dosage of PS applied. With the dosage increasing, more surface area would be occupied before the hydrothermal reaction. In Fig. S3,† mass loss in two parts is observed in the three curves. In part one, from room temperature to 300 °C, the mass lost from GO corresponds to CO, CO2, and steam release from the labile functional group.16 In the other part, between 300 and 800 °C, the mass lost from GO arises from the removal of the stable oxygen functional group and carbon atoms.17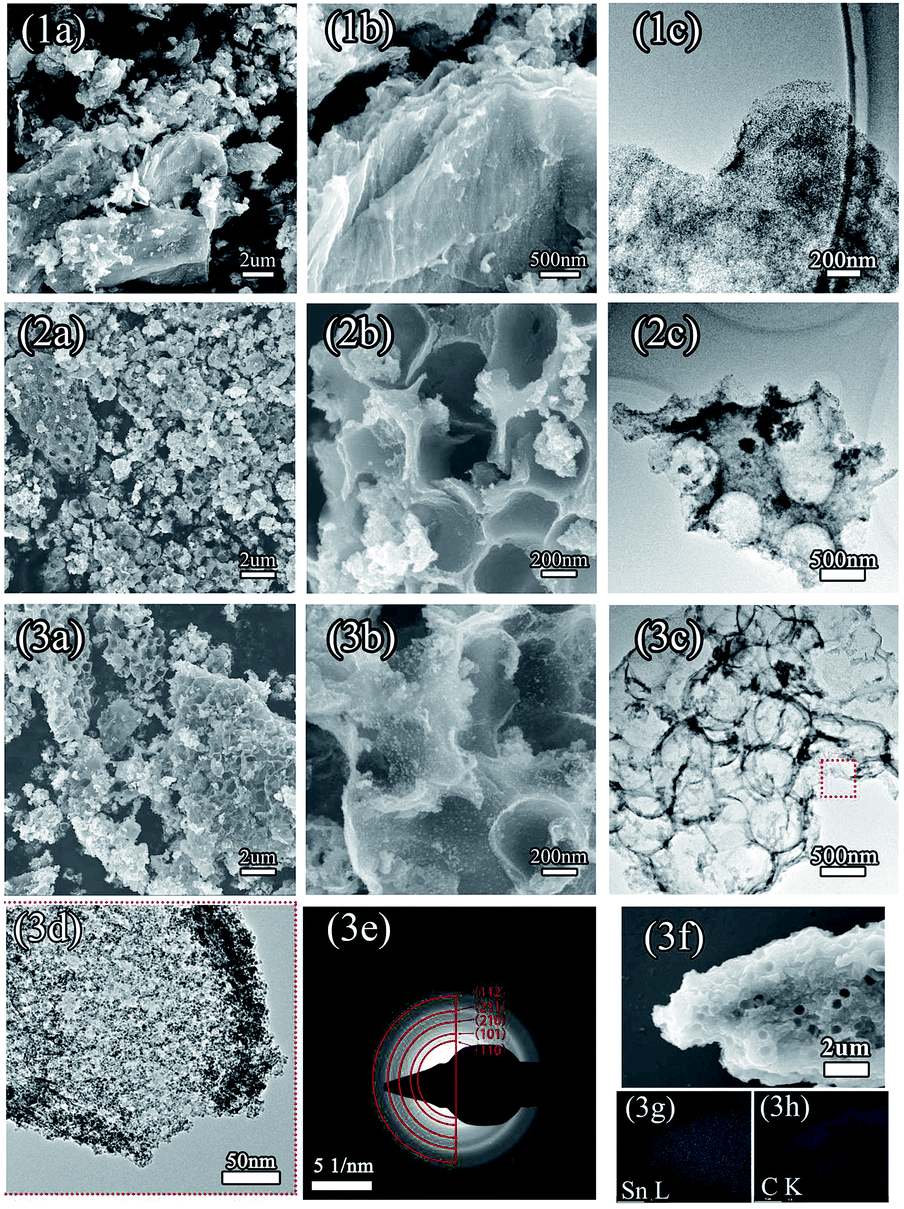 | ||
| Fig. 2 SEM images, TEM images and the selected area electron diffraction patterns of the three samples with different quantities of PS. The SEM images (1a and 1b) and the TEM image (1c) of sample 1; the SEM images (2a and 2b) and TEM image (2c) of sample 2; the SEM images (3a and 3b) and TEM image (3c and 3d) of sample 3 and the SAED pattern (3e) of sample 3; (3f–3h) are the elemental mapping images of elements Sn and C. | ||
With a larger quantity of PS, there are more holes in sample 3 than in the other two samples. So sample 3 may have the largest specific surface area. To confirm this, the surface area of these three samples was investigated using N2 adsorption measurements. The isotherm curves (Fig. 3(a)) of the three samples belong to the same type and a distinct hysteresis loop in the P/P0 range from 0.4 to 1.0 is observed. According to Brunauer–Emmett–Teller (BET) theory, the specific surface areas of the samples are 23.22, 248.89, and 360 m2 g−1, respectively. The crystalline phases of the samples can be evaluated using X-ray diffraction spectra (XRD) (Fig. 3(b)). It can be seen that all of the diffraction peaks of these three spectra can be very well indexed to the rutile structure of SnO2 (space group: P42/mnm (136), JCPDS no. 41-1445), without the other crystalline phase. The three major XRD peaks at 2θ = 26.61°, 33.89°, and 51.78° correspond to the (110), (101), and (211) planes, respectively, which also can be confirmed using the SAED pattern (Fig. 2(3e)). The Raman spectra of PS, PS coated with GO (PS + GO), and sample 3 are shown in Fig. 3(c) and (d). Both PS + GO and sample 3 exhibit a D peak at 1356 cm−1 and G peak at 1598 cm−1. The D peak was related to the disordered structure and defects in the carbon materials, which were created by some groups, such as hydroxyl and epoxide groups. The G peak was characteristic of the E2g vibration mode of sp2-bonded carbon atoms in a 2D hexagonal lattice (E2g mode).18 The weak peak at 1002 cm−1 in the Raman spectrum of PS + GO, which belongs to the Raman spectrum of PS, vanishes in that of sample 3 and this proves that the PS template is removed completely in sample 3. As shown in Fig. 3(d), there is a frequency shift downward from 1356 cm−1 to 1342 cm−1, which is attributed to the distortion of the bonds and a heating effect by the laser radiation.19 The intensity ratios of the D peak to the G peak (ID/IG) are 2.19 (sample 3) and 1.23 (PS + GO), respectively. The higher ratio of sample 3 can be attributed to the increase of disorder in the GO resulting from the aggressive hydrothermal reaction and the loading of SnO2 nanoparticles.
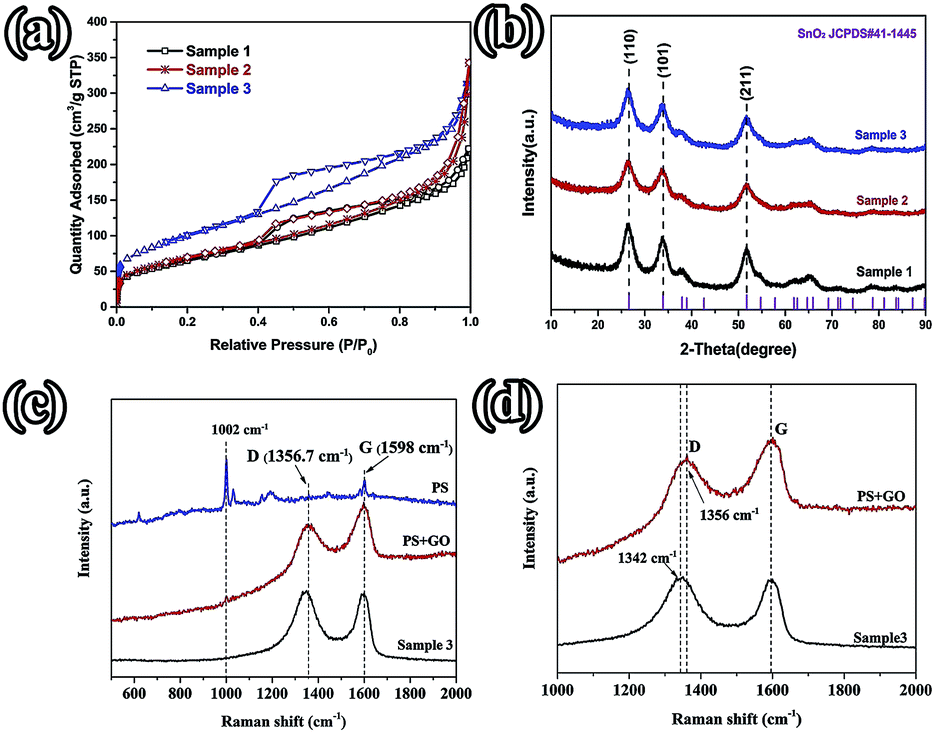 | ||
| Fig. 3 (a) Nitrogen adsorption–desorption isotherms; (b) XRD patterns of the different samples; (c) the Raman spectra of PS, PS + GO, and sample 3; (d) the Raman spectra of PS + GO and sample 3. | ||
XPS measurements were performed to investigate the element composition and valence states of the SnO2/3DG nanocomposite. Fig. S2† presents the XPS spectra of the SnO2/3DG nanocomposite. The two obvious peaks at about 487 and 496 eV, which can be attributed to Sn 3d5/2 and Sn 3d3/2 respectively, imply that the tin species in SnO2/3DG is SnO2.20–22 The C 1s peak is at around 284.6 eV (Fig. S2(b)†) and it can be deconvoluted into three peaks. The sharp peak located at 284.7 eV is attributed to the C–C bonds.21 Another two weak peaks observed at 286.2 eV and 288.8 eV correspond to C–O and C![[double bond, length as m-dash]](https://www.rsc.org/images/entities/char_e001.gif) O bonds, respectively. The existence of the two weak peaks suggests that the oxygen-containing (C–O and CO) functional groups on the surface of the GO chemically bonded with the Sn atom of SnO2 to generate interfacial bonding (–C–O–Sn–). Under the hydrothermal condition, the increased temperature and autogenous pressure led to the reduction of the graphene oxide into reduced graphene oxide (RGO), but the C–O or CO of the interfacial bonding (–C–O–Sn–) was still left after the reduction.
O bonds, respectively. The existence of the two weak peaks suggests that the oxygen-containing (C–O and CO) functional groups on the surface of the GO chemically bonded with the Sn atom of SnO2 to generate interfacial bonding (–C–O–Sn–). Under the hydrothermal condition, the increased temperature and autogenous pressure led to the reduction of the graphene oxide into reduced graphene oxide (RGO), but the C–O or CO of the interfacial bonding (–C–O–Sn–) was still left after the reduction.
Stable cycling performance is one of the most important performance indicators used to evaluate an electrode material. As shown in Fig. 4(a), the cycling performance was characterized at an operating current density of 100 mA g−1 with a potential ranging from 0.01–3.0 V. The initial discharge (charge) capacities of sample 1, sample 2, and sample 3 are 1656 (1048.8), 1875.1 (1097.8), and 1889.1 (1053.2) mA h g−1, with coulombic efficiencies of 63.3%, 58.5%, and 55.8%, respectively. This irreversible capacity loss frequently occurs in many other metal oxide anodes and results in the formation of a solid electrolyte interface (SEI).10,23–25 Comparing these three samples, the irreversible capacities are increasing from sample 1 to sample 3, which is attributed to the increasing specific surface area. With the specific surface increasing, more active material can be exposed to the electrolyte and a large area SEI can be formed. In the subsequent second cycle, the coulombic efficiencies increase to 90.1%, 90.7%, and 90.2%, respectively. After 100 cycles, the reversible capacity of sample 3 is maintained at 720.8 mA h g−1, with a coulombic efficiency of above 97%. Relatively, sample 3 possesses more advantageous cycling performance than sample 2 and sample 3. The rate performance was characterized at current densities of 100, 200, 500, 1000, and 100 mA g−1 (Fig. 4(b)). As shown in Fig. 4(b), the rate performance of sample 3 is noticeably higher than that of sample 2 and sample 1, which agrees with the cycling performance. As the current density rises to 1000 mA g−1, the reversible capacity of sample 3 (about 800 mA h g−1) is larger than that of sample 2 (about 700 mA g−1). The reversible capacity of sample 1 is the lowest. When the current density returns to 100 mA g−1, the capacities of these three samples can recover to a relatively high level. In order to characterize the remarkable electrochemical performance of sample 3, the 35th (solid line) and 40th (dotted line) charge–discharge curves of these three samples at a higher current density of 1000 mA g−1 are shown in Fig. 4(c). It is clear that the reversible capacity and cycling stability of sample 3 are better than those of the other two samples. The major reason is the largest specific surface area of sample 3. A large surface area is helpful for the diffusion of Li-ions, according to Fick’s law of diffusion.26 And then, a large surface area can provide a large contact area between the active material and the electrolyte, and more of the material could be active in Li-ion storage. The porous structure can also provide more space for the volume expansion of the SnO2 nanoparticles.
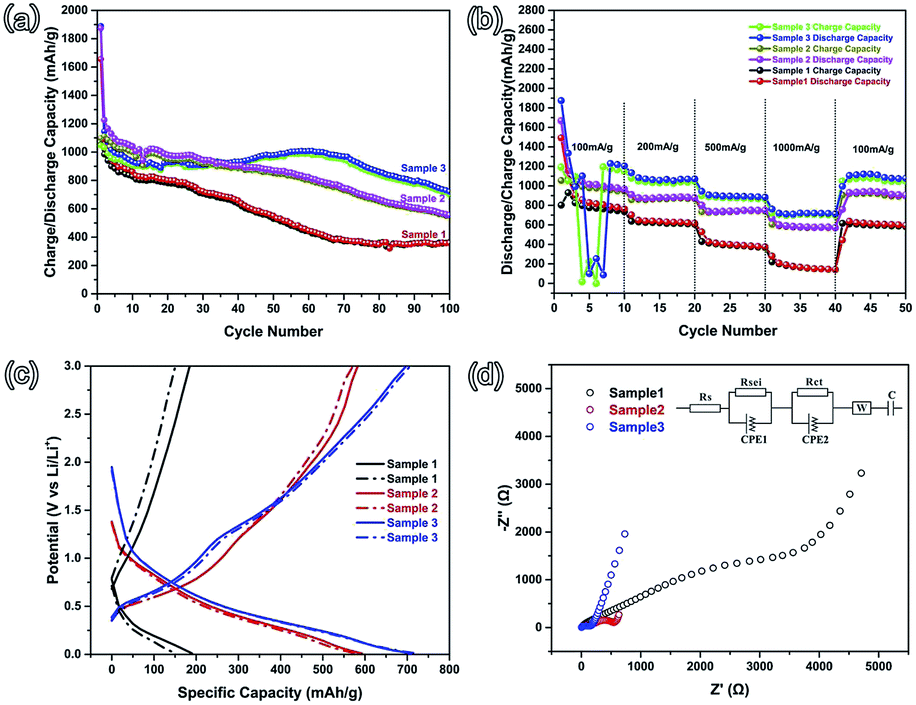 | ||
| Fig. 4 (a) Cycling performance of sample 1, sample 2, and sample 3 at 100 mA g−1; (b) the rate performance of those three samples at current densities of 100, 200, 500, 1000, and 100 mA g−1; (c) charge–discharge curves of those three samples at 1000 mA g−1 in the rate performance test; (d) Nyquist plots of those three samples (inset shows the Randles equivalent circuit). | ||
In order to get the diffusion information of Li-ions in different samples, electrochemical impedance spectroscopy (EIS) was performed using an Autolab (Metrohm Autolab B.V.), with the frequency ranging from 100 kHz to 0.01 Hz.27–30 The Nyquist plots of the three samples are shown in Fig. 4(d) and the inset is the Randles circuit. The Nyquist plots are composed of three parts, namely two partially overlapped semicircles at high and medium frequencies and one straight sloping line at the low frequency end.27,31 Such Nyquist plots can be fitted by an equivalent circuit, as shown in the inset of Fig. 4(d). In the Fig. 4(d) inset, Rs is the total resistance of the cell, including the electrolyte, separator, and electrodes; RSEI and CPE1 (the semicircle in the high frequency region) correspond to the solid electrolyte interface (SEI) formed on the surface of the electrodes; Rct and CPE2 (the semicircle in the medium frequency region) correspond to the charge-transfer resistance and double layer capacitance; W is the Warburg impedance, related to a combination of the diffusional effects of Li-ions on the interface between the active material and the electrolyte.27,32 The values of Rs, RSEI, and Rct are reported in Table 2. The RSEI value and Rct value of sample 3 are 27.7 and 85.54 Ω, which are much smaller than the others. This indicates that there is less resistance in the charge-transfer process. The reduced charge-transfer resistance might be induced by the easy accessibility and transportation of the electrolyte in the porous structure. This is due to the fact that the larger specific surface area can shorten the Li-ion diffusion length and buffer the volume changes when compared to sample 1 (without PS), which can lead to better electrochemical performance, as observed in Fig. 4(a) and (b).
| Sample | Rs (Ω) | RSEI (Ω) | CPE1 | Rct (Ω) | CPE2 |
|---|---|---|---|---|---|
| Sample 1 | 3.84 | 295.9 | 3.26 × 10⁻⁵ | 3555 | 2.17 × 10⁻⁴ |
| Sample 2 | 3.83 | 138.43 | 3.99 × 10⁻⁵ | 484.54 | 9.11 × 10⁻⁴ |
| Sample 3 | 3.83 | 27.7 | 3.66 × 10⁻⁶ | 85.54 | 2.06 × 10⁻⁵ |
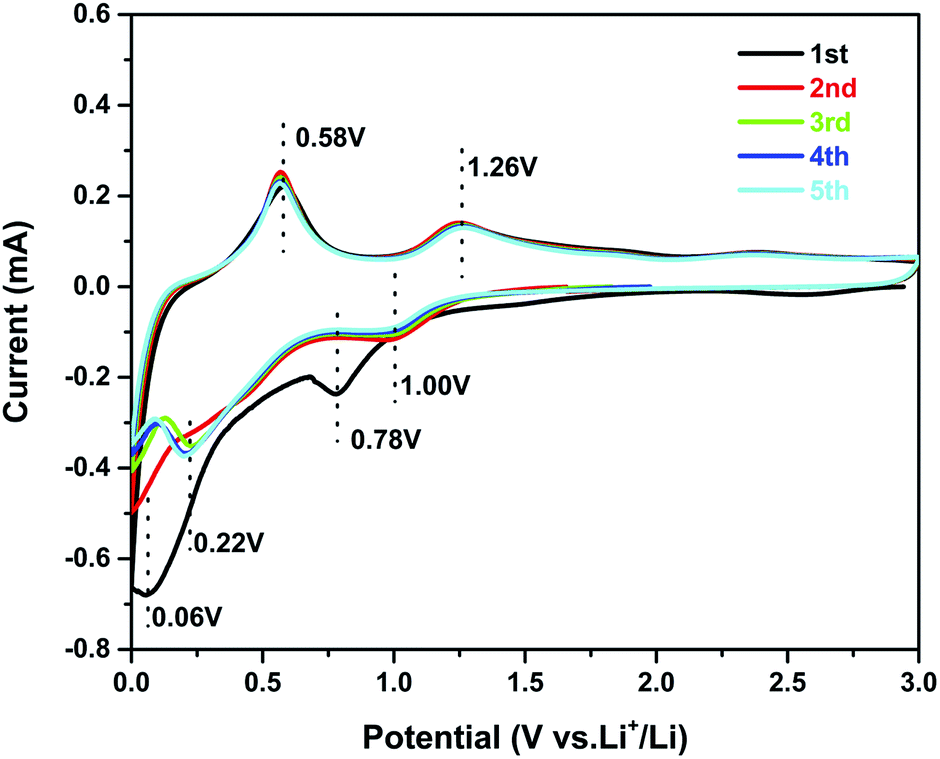
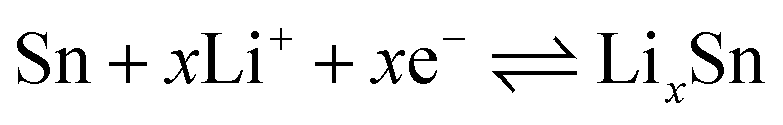
Cyclic voltammetry (CV) experiments were carried out to investigate the electrochemical reaction process of the active material in the potential range from 0.01 to 3.0 V for five cycles at a scan rate of 0.1 mV s−1. The CV curves of sample 3 are shown in Fig. 5. In the first curve, two obvious cathodic peaks are observed at 0.78 V and 0.06 V. The peak at 0.78 V could be ascribed to the formation of the SEI layer on the surface of the active material, reduction of SnO2 to Sn, and the synchronous formation of Li2O as described in eqn (1):33,34
| SnO2 + 4Li+ → 2Li2O + Sn | (1) |
 | ||
| Fig. 5 Cyclic voltammograms of the sample 3 electrode at a scan rate of 0.1 mV s−1. | ||
The peak at 0.06 V corresponds to the multi-step reaction of the Li–Sn alloy. In this voltage area, Li-ions insert into the alloy continuously and different Li–Sn alloys (Li2Sn5, LiSn, Li7Sn3, Li5Sn2, and Li22Sn5) are formed. The multi-step reactions are described in eqn (2):35
 | (2) |
Meanwhile, in the anodic polarization process, two peaks were recorded at about 0.58 V and 1.26 V. The peak at 0.58 V represents the de-alloying process of the Li–Sn alloy as described in eqn (2).36 The following peak at 1.26 V could be ascribed to the partly reversible reaction described in eqn (1).37 In the following curves, the intensity of the 0.78 V and 0.006 V peaks is decreased and there are no obvious peaks. However, peaks at 0.22 V and 1.0 V are observed and always present in the following scans. The curves of the third, the fourth, and the fifth scans are similar to the second, implying good cycling stability. The potential of alloying is about 0.22 V, which can prevent the formation of branched crystals and effectively improve the safety performance.
It is well known that the intrinsic crystalline texture and the structure play very significant roles in the electrochemical performance. In this work, sample 3 and sample 2 exhibit excellent lithium storage performance, with high reversible capacities and remarkable capacity retention at different current rates. Such a porous structure is likely to benefit from a large specific surface area, as well as decreased polarization. Firstly, the large surface area of the porous structure leads to more reactive sites and a large contact area between the electrode material and the electrolyte, which endows the composite with a high specific capacity. Secondly, the local empty space in the porous structure can effectively accommodate the large volume change during the Li-ion insertion/deinsertion process. Thirdly, the highly conductive and flexible graphene can provide a three-dimensional (3D) electronic network to facilitate the charge transfer.
5 Conclusions
In summary, we have successfully prepared a porous composite of SnO2/3DG, using PS as a template. This composite exhibits excellent cycling performance and the reversible capacity is 720.8 mA h g−1 at a current density of 100 mA g−1. The rate performance is also superior and the reversible capacity remains at 800 mA h g−1 at a current density of 1000 mA g−1. This advanced performance as an anode material can be attributed to a number of factors.(1) The vast holes can provide a large number of channels for the electrolyte, which can greatly enlarge the contact area between SnO2/3DG and the electrolyte.
(2) The three-dimensional graphene can not only collect electrons, but also play the important role of the carrier of the active material. As the carrier, the active material (the SnO2 nanoparticles) can be firmly anchored to the surface of graphene, preventing falling off during charging and discharging.
(3) The structure with a mass of holes can shorten the Li-ion diffusion length effectively.
Acknowledgements
The research was financially supported by the Fundamental Research Funds for the Central Universities (Grant No. lzujbky-2016-116), the National Natural Science Foundation of China (Grant No. 51665003 and No. 11204114), the Natural Science Foundation for Young Scientists of Gansu Province, China (Grant No. 1506RJYA220), the Basic Scientific Research Business Expenses of the Central University (2022016zr0114), and Lanzhou Chengguan District Scientific Research Foundation (cgkj2015-5-1).References
- J. Zhao, W.-H. Li, H.-Z. Xu, L.-S. Sun, C.-Q. Li and F.-Q. Liu, RSC Adv., 2016, 6, 70972–70977 RSC.
- P. Antitomaso, B. Fraisse, M. Sougrati, F. Morato-Lallemand, S. Biscaglia, D. Aymé-Perrot, P. Girard and L. Monconduit, J. Power Sources, 2016, 325, 346–350 CrossRef CAS.
- M. Armand and J.-M. Tarascon, Nature, 2008, 451, 652–657 CrossRef CAS PubMed.
- P. V. Braun, J. Cho, J. H. Pikul, W. P. King and H. Zhang, Curr. Opin. Solid State Mater. Sci., 2012, 16, 186–198 CrossRef CAS.
- O. Cevher, M. O. Guler, U. Tocoglu and H. Akbulut, Int. J. Energy Res., 2014, 38, 499–508 CrossRef CAS.
- M. Wachtler, M. Winter and J. O. Besenhard, J. Power Sources, 2002, 105, 151–160 CrossRef CAS.
- L. Cai and R. E. White, J. Power Sources, 2011, 196, 5985–5989 CrossRef CAS.
- S. Santhanagopalan, Q. Guo, P. Ramadass and R. E. White, J. Power Sources, 2006, 156, 620–628 CrossRef CAS.
- Q. Wang, H. Li, X. Huang and L. Chen, J. Electrochem. Soc., 2001, 148, A737–A741 CrossRef CAS.
- S. Li, J. Zheng, Z. Hu, S. Zuo, Z. Wu, P. Yan and F. Pan, RSC Adv., 2015, 5, 72857–72862 RSC.
- X. Li, M. Gu, S. Hu, R. Kennard, P. Yan, X. Chen, C. Wang, M. J. Sailor, J.-G. Zhang and J. Liu, Nat. Commun., 2014, 5, 4105 CAS.
- L. Zong, Y. Jin, C. Liu, B. Zhu, X. Hu, Z. Lu and J. Zhu, Nano Lett., 2016, 7210 CrossRef CAS PubMed.
- A. Goodall, M. Wilkinson and J. Hearn, J. Polym. Sci., Polym. Chem. Ed., 1977, 15, 2193–2218 CrossRef CAS.
- A. M. Dimiev and J. M. Tour, ACS Nano, 2014, 8, 3060–3068 CrossRef CAS PubMed.
- Y. N. Ko, S. B. Park and Y. C. Kang, Small, 2014, 10, 3240–3245 CrossRef CAS PubMed.
- Y. Wang, H. Yuan, P. Ma, H. Bai, M. Chen, W. Dong, Y. Xie and Y. S. Deshmukh, ACS Appl. Mater. Interfaces, 2017, 9, 4215–4222 CAS.
- D. C. Marcano, D. V. Kosynkin, J. M. Berlin, A. Sinitskii, Z. Sun, A. Slesarev, L. B. Alemany, W. Lu and J. M. Tour, ACS Nano, 2010, 4, 4806–4814 CrossRef CAS PubMed.
- J. Shi, Y. Wang, W. Du and Z. Hou, Carbon, 2016, 99, 330–337 CrossRef CAS.
- F. Tuinstra and J. L. Koenig, J. Chem. Phys., 1970, 53, 1126–1130 CrossRef CAS.
- X. Wang, Z. Li, Z. Zhang, Q. Li, E. Guo, C. Wang and L. Yin, Nanoscale, 2015, 7, 3604–3613 RSC.
- D. Zhou, X. Li, L.-Z. Fan and Y. Deng, Electrochim. Acta, 2017, 230, 212–221 CrossRef CAS.
- S.-H. Yu, D. J. Lee, M. Park, S. G. Kwon, H. S. Lee, A. Jin, K.-S. Lee, J. E. Lee, M. H. Oh and K. Kang, et al., J. Am. Chem. Soc., 2015, 137, 11954–11961 CrossRef CAS PubMed.
- S. Li, S. Zuo, Z. Wu, Y. Liu, R. Zhuo, J. Feng, D. Yan, J. Wang and P. Yan, Electrochim. Acta, 2014, 136, 355–362 CrossRef CAS.
- K. M. Nam, Y. C. Choi, S. C. Jung, Y.-I. Kim, M. R. Jo, S. H. Park, Y.-M. Kang, Y.-K. Han and J. T. Park, Nanoscale, 2012, 4, 473–477 RSC.
- A. Rong, X. Gao, G. Li, T. Yan, H. Zhu, J. Qu and D. Song, J. Phys. Chem. B, 2006, 110, 14754–14760 CrossRef CAS PubMed.
- F. Lantelme, H. Groult and N. Kumagai, Electrochim. Acta, 2000, 45, 3171–3180 CrossRef CAS.
- A. Barai, G. H. Chouchelamane, Y. Guo, A. McGordon and P. Jennings, J. Power Sources, 2015, 280, 74–80 CrossRef CAS.
- S. Zhang, K. Xu and T. Jow, Electrochim. Acta, 2004, 49, 1057–1061 CrossRef CAS.
- D. D. Macdonald, Electrochim. Acta, 2006, 51, 1376–1388 CrossRef CAS.
- K. Tang, X. Yu, J. Sun, H. Li and X. Huang, Electrochim. Acta, 2011, 56, 4869–4875 CrossRef CAS.
- K. Zhang, P. Han, L. Gu, L. Zhang, Z. Liu, Q. Kong, C. Zhang, S. Dong, Z. Zhang and J. Yao, et al., ACS Appl. Mater. Interfaces, 2012, 4, 658–664 CAS.
- M. O. Guler, O. Cevher, T. Cetinkaya, U. Tocoglu and H. Akbulut, Int. J. Energy Res., 2014, 38, 487–498 CrossRef CAS.
- N. Yesibolati, M. Shahid, W. Chen, M. N. Hedhili, M. C. Reuter, F. M. Ross and H. N. Alshareef, Small, 2014, 10, 2849–2858 CrossRef CAS PubMed.
- L. Chen, X. Yin, L. Mei, C. Li, D. Lei, M. Zhang, Q. Li, Z. Xu, C. Xu and T. Wang, Nanotechnology, 2011, 23, 035402 CrossRef PubMed.
- C. Wang, G. Du, K. Ståhl, H. Huang, Y. Zhong and J. Jiang, J. Phys. Chem. C, 2012, 116, 4000–4011 CAS.
- D. Wang, X. Li, J. Wang, J. Yang, D. Geng, R. Li, M. Cai, T.-K. Sham and X. Sun, J. Phys. Chem. C, 2012, 116, 22149–22156 CAS.
- X. Zhong, Y. Jiang, X. Chen, L. Wang, G.-l. Zhuang, X. Li and J.-g. Wang, J. Mater. Chem. A, 2016, 4, 10575–10584 CAS.
Footnote |
| † Electronic supplementary information (ESI) available. See DOI: 10.1039/c6ra28258j |
| This journal is © The Royal Society of Chemistry 2017 |