
 Open Access Article
 This Open Access Article is licensed under a Creative Commons Attribution-Non Commercial 3.0 Unported Licence
Solvothermal synthesis of LiFe1/3Mn1/3Co1/3PO4 solid solution as lithium storage cathode materials
Yanming Wangab,
Yajing Wanga,
Xiaoyu Liua,
Bo Zhua and
Fei Wang *ab
*ab
aAnhui Key Laboratory of Energetic Materials, School of Chemistry and Materials Science, Huaibei Normal University, Huaibei, Anhui 235000, China. E-mail: wangfeichem@126.com; Fax: +86 561 3806281; Tel: +86 561 3802235
bInformation College, Huaibei Normal University, Huaibei, Anhui 235000, China
First published on 3rd March 2017
Abstract
Well-dispersed LiFe1/3Mn1/3Co1/3PO4 nanoparticles with dimensions of ca. 90–180 nm are synthesized by a solvothermal technique using water–ethylene glycol mixture as reaction media. The as-prepared LiFe1/3Mn1/3Co1/3PO4 nanoparticles are well crystallized in the orthorhombic olivine structure and exist in the form of a single-phase solid solution. In LiFe1/3Mn1/3Co1/3PO4 solid solution, the Fe3+/Fe2+and Co3+/Co2+ redox couples exhibit superior electrochemical activity and reversibility compared to the Mn3+/Mn2+ redox couple. Benefiting from the integrated carbon coating and contiguous carbon network, the LiFe1/3Mn1/3Co1/3PO4/C composite delivers a high discharge capacity of 165 mA h g−1 at 0.05C, 148 mA h g−1 at 0.5C, and 120 mA h g−1 at 5C. Meanwhile, it shows considerable cycling stability after 100 cycles at both 25 °C (80% capacity retention at 0.1C) and 50 °C (79% capacity retention at 1C).
1. Introduction
Since first proposed by Goodenough et al. in 1997,1 olivine-type LiFePO4 has been intensively studied as a competitive cathode material for lithium ion batteries and successfully commercialized for electric vehicle (EV) applications due to its superior electrochemical reversibility as well as thermal stability. Other olivine-structured LiMnPO4 and LiCoPO4 materials have almost the same theoretical specific capacity (∼170 mA h g−1) as LiFePO4. The specific energy densities of LiMnPO4 and LiCoPO4 (684 W h kg−1 and 800 W h kg−1, respectively) far exceed LiFePO4 (580 W h kg−1) induced by the much higher redox potentials of Mn3+/Mn2+ (4.1 V vs. Li/Li+) and Co3+/Co2+ (4.8 V vs. Li/Li+) than Fe3+/Fe2+ (3.4 V vs. Li/Li+).2–5 However, poor rate capabilities of LiMnPO4 and LiCoPO4 generated from low electrical conductivity and Li+ ions diffusivity cannot meet the requirements of practical use.6–11Recently, the multicomponent olivine solid solutions such as LiFe1−xMnxPO4,12–23 LiCo1−xMnxPO4 (ref. 24–27) and LiFe1/3Mn1/3Co1/3PO4 (ref. 28–31) have attracted much interest on account of their increased energy density and improved rate performance in comparison to their single component phosphate. Wu et al.32 synthesized LiCo1/3Fe2/3PO4/C cathode material using CoFe2O4 as raw material, showing a discharge capacity of 152.9 mA h g−1 at 0.1C. Xiong et al.33 prepared LiMn1/3Fe1/3Co1/3PO4/C composite through a sol–gel technique, which exhibited a reversible capacity of 142.6 mA h g−1 at 0.1C. The in situ XRD analysis illustrated that LiCo1/3Mn1/3Fe1/3PO4 retains the stable olivine structure during the charge/discharge between 2.0 and 5.0 V because the metal antibonding state can be stabilized by the strong P–O covalent bonds.34 Li et al.35 reported the fast synthesis of LiFe1/3Mn1/3Co1/3PO4/C via a microwave heating process, and the discharge capacity reaches 143 mA h g−1 at 0.1C after 30 cycles. However, reports concerning LiFe1/3Mn1/3Co1/3PO4 solid solution with high cycling stability are still scarce and the electrochemical behaviors desire further investigation.
Herein, we report a controllable synthesis of monodisperse LiFe1/3Mn1/3Co1/3PO4 (LFMCP) nanoparticles via a facile solvothermal reaction in water–ethylene glycol media. Sucrose acts as carbon source to fabricate carbon coating on the particles surface and carbon network among the particles. The electrochemical Li+ insertion/extraction behavior of LiFe1/3Mn1/3Co1/3PO4/C (LFMCP/C) is discussed in detail.
2. Experimental
In a typical procedure, 27 mmol LiOH·H2O and 9.9 mmol H3PO4 were dissolved in 40 mL ethylene glycol under continuous stirring at 80 °C. Meanwhile, 3 mmol FeSO4·7H2O, 3 mmol MnSO4·H2O and 3 mmol CoSO4·7H2O were dissolved in 3.5 mL deionized water and 30 mL ethylene glycol to form a transparent solution. Then FeSO4–MnSO4–CoSO4 solution was added into LiOH–H3PO4 solution in gradually under vigorous stirring. The above mixture was transferred into a 100 mL Teflon-lined stainless steel autoclave, and kept at 180 °C for 10 h in a drying oven. The resulting precipitate was rinsed with deionized water and ethanol, and then dried at 80 °C. For carbon coating, the LFMCP powder and adequate sucrose were blended in water followed by ultrasonic treatment for 0.5 h. After drying, the powder was calcined at 650 °C for 4 h in flowing argon to obtain LFMCP/C composite.The X-ray diffraction (XRD) patterns were conducted on an X-ray diffractometer (Rigaku, D/max-2550VL/PC) operating at 40 kV and 200 mA with Cu Kα radiation. Scanning electron microscope (SEM, FEI Nova NanoSEM 450) and transmission electron microscope (TEM, JEOL 2100F) equipped with an energy dispersive X-ray spectroscopy (EDS) instrument were used to investigate the particle morphology, microstructure and elemental distribution. The carbon content was determined by elemental analyzer (Elementar, Vario EL Cube). The chemical composition of the samples is measured by inductively coupled plasma atomic emission spectroscopy (ICP, iCAP 7600).
Electrochemical tests were performed using CR2016 coin cells. The LFMCP/C composite was blended homogeneously with Super P carbon and polyvinylidene difluoride binder in N-methylpyrrolidone solution in a weight ratio of 75![[thin space (1/6-em)]](https://www.rsc.org/images/entities/char_2009.gif) :15:10. The slurry was casted onto aluminum foil, dried at 120 °C in a vacuum oven and cut into rounds in diameter of 12 mm to obtain the cathode sheets with an active material loading of ca. 1.5 mg cm−2. Coin cells were assembled with lithium-foil as anode, 1 M LiPF6 in ethylene carbonate/dimethyl carbonate (1:1, v/v) as electrolyte, and Entek ET20-26 membrane as separator. Charge/discharge cycles were conducted on a LANHE CT2001 battery tester (Land Wuhan) between 2.0 and 5.0 V at 25 °C and 50 °C. Cyclic voltammetry (CV) was measured on a CHI 650D electrochemical workstation (Chenhua Shanghai). The specific capacity and current rate were calculated based on the mass of pure LiFe1/3Mn1/3Co1/3PO4 (1C = 169 mA g−1).
:15:10. The slurry was casted onto aluminum foil, dried at 120 °C in a vacuum oven and cut into rounds in diameter of 12 mm to obtain the cathode sheets with an active material loading of ca. 1.5 mg cm−2. Coin cells were assembled with lithium-foil as anode, 1 M LiPF6 in ethylene carbonate/dimethyl carbonate (1:1, v/v) as electrolyte, and Entek ET20-26 membrane as separator. Charge/discharge cycles were conducted on a LANHE CT2001 battery tester (Land Wuhan) between 2.0 and 5.0 V at 25 °C and 50 °C. Cyclic voltammetry (CV) was measured on a CHI 650D electrochemical workstation (Chenhua Shanghai). The specific capacity and current rate were calculated based on the mass of pure LiFe1/3Mn1/3Co1/3PO4 (1C = 169 mA g−1).
3. Results and discussion
Fig. 1 presents the XRD patterns of the as-prepared LFMCP and LFMCP/C samples. The diffraction peaks of LFMCP/C are stronger than that of LFMCP, indicating higher crystallinity after heating at 650 °C. Two ternary samples are well crystallized in single phase as orthorhombic olivine structure with a Pnmb space group. Analyzing from the standard card illustrated in Fig. 1, the diffraction peaks of LiFePO4 and LiCoPO4 are slightly shifted in turn to higher 2θ angles relative to those of LiMnPO4 due to the smaller ionic radius of Fe2+ (0.78 Å) and Co2+ (0.75 Å) than that of Mn2+ (0.83 Å). All the diffraction peeks of two samples basically accord with the standard olivine-type LiFePO4 (JCPDS no. 40-1499). The refined lattice parameters are given in Table 1, and the values are similar to the reported data.28–30,35 Therefore, the as-prepared LFMCP is a complete solid solution of ternary transition-metal phosphates instead of a nano-composite. | ||
| Fig. 1 XRD patterns of as-prepared LFMCP and LFMCP/C. | ||
| Sample | a (Å) | b (Å) | c (Å) | V (Å3) |
|---|---|---|---|---|
| LiFe1/3Mn1/3Co1/3PO4 (this work) | 10.330 | 6.012 | 4.712 | 292.634 |
| LiFe1/3Mn1/3Co1/3PO4/C (this work) | 10.326 | 6.014 | 4.713 | 292.680 |
| LiCo1/3Mn1/3Fe1/3PO4 (ref. 28) | 10.327 | 6.012 | 4.713 | 292.611 |
| LiFe1/3Mn1/3Co1/3PO4 (ref. 29) | 10.328 | 6.012 | 4.711 | 292.536 |
| LiFe1/3Mn1/3Co1/3PO4 (ref. 30) | 10.339 | 6.009 | 4.713 | 292.804 |
| LiFe1/3Mn1/3Co1/3PO4 (ref. 35) | 10.330 | 6.009 | 4.715 | 292.674 |
| LiFePO4 (JCPDS no. 40-1499) | 10.347 | 6.019 | 4.704 | 292.959 |
| LiMnPO4 (JCPDS no. 33-0804) | 10.454 | 6.106 | 4.749 | 303.139 |
| LiCoPO4 (JCPDS no. 32-0552) | 10.206 | 5.922 | 4.701 | 284.128 |
Fig. 2 shows the SEM images of LFMCP and LFMCP/C powders (inset). The LFMCP sample illustrates monodisperse nanoparticles morphology with dimension of ca. 90–180 nm. The volume ratio of ethylene glycol/water (20:1) and the pH of reaction system (5–6) have a significant effect on the morphology modulation of LFMCP. Ethylene glycol has high viscosity and special coordination effect, which may control the velocity of crystallization and crystal morphology.5,15 After carbon coating, a continuous carbon network is formed among LFMCP particles, which is beneficial for the fast electronic transmission and electrode kinetics. The carbon content in LFMCP/C composite evaluated by elemental analysis is 5.6 wt%.
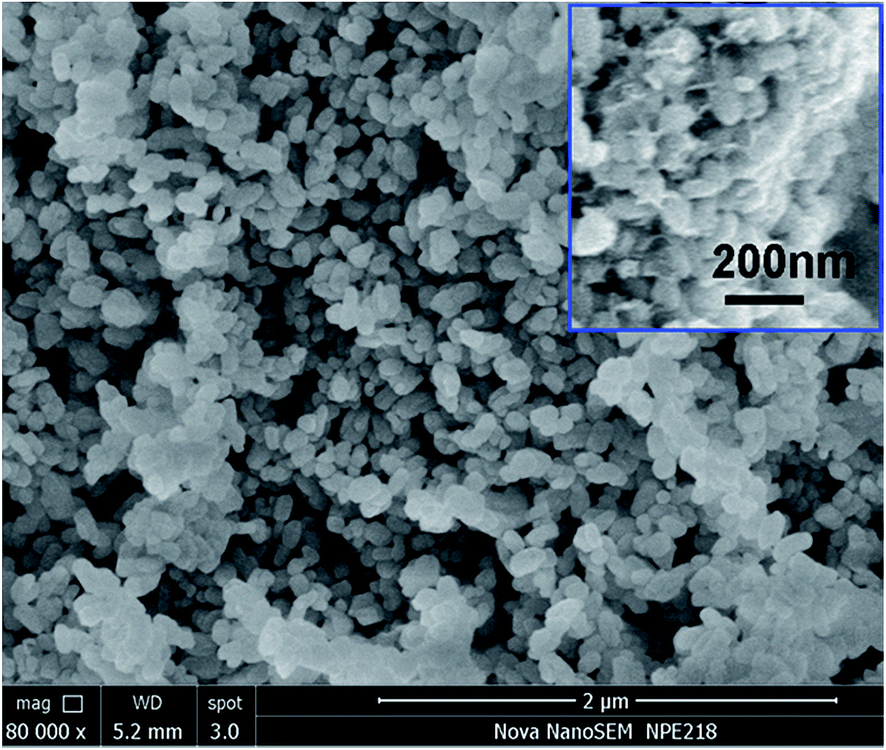 | ||
| Fig. 2 SEM images of LFMCP and LFMCP/C (inset). | ||
Fig. 3a–d exhibit the EDS mappings of LFMCP/C. The elements of Fe, Mn and Co are homogeneously dispersed in the LFMCP nanoparticles. The TEM image of LFMCP/C (Fig. 3e) illustrates that an amorphous carbon layer with a thickness of ca. 2.5 nm is tightly coated on the particle surface. The distinct lattice fringes and corresponding selected area electron diffraction pattern confirm the single-phase nature of the LFMCP nanoparticles. The EDS pattern of LFMCP/C (Fig. 3f) displays the characteristic peaks of Mn, Fe and Co and gives the Mn/Fe/Co ratio of 7.01:8.24:9.38. The chemical composition of LFMCP and LFMCP/C is further measured by ICP and listed in Table 2. The above characterization results reveal that the LFMCP nanoparticles with a uniform chemical composition can be obtained by the reported solvothermal synthesis.
 | ||
| Fig. 3 EDS mappings (a–d); TEM image (e) and EDS pattern (f) of LFMCP/C. | ||
| Element | Molar ratio | ||
|---|---|---|---|
| Theoretical | LFMCP | LFMCP/C | |
| Fe | 1 | 1 | 1 |
| Mn | 1 | 1.024 | 1.010 |
| Co | 1 | 1.066 | 1.035 |
| Li | 3 | 3.216 | 3.090 |
| P | 3 | 2.746 | 2.682 |
Fig. 4a shows the first and 50th charge–discharge curves of LFMCP/C at 0.1C rate. The multiple voltage plateaus relating to Fe, Mn and Co are clearly observed. Their average charge/discharge voltage plateaus in the first cycle at 3.51/3.50 V, 4.20/4.11 V and 4.73/4.72 V correspond to the redox reaction of Fe3+/Fe2+, Mn3+/Mn2+, Co3+/Co2+, respectively. More importantly, the voltage difference between the charge and discharge plateaus for Fe3+/Fe2+, Mn3+/Mn2+ and Co3+/Co2+ in LFMCP decrease greatly in comparison with that in pure LiFePO4, LiMnPO4 and LiCoPO4.10,11,36 Three pairs of distinct voltage plateaus are still retained after 50 cycles, which means that the as-prepared LFMCP nanoparticles have excellent electrochemical activity and reversibility. The LFMCP/C composite delivers a large discharge capacity of 158 mA h g−1 at 0.1C rate and maintains its 85% after 50 cycles. According to the first discharging profile, the reversible capacities contributed by the Co3+/Co2+ (5.0–4.2 V) and Mn3+/Mn2+ (4.2–3.6 V) redox couples are 40 and 47 mA h g−1, respectively. Thus, the ratio of the reversible capacity to the capacity of LFMCP/C (158 mA h g−1) is 25% for Co3+/Co2+ couple and 30% for Mn3+/Mn2+ couple. As for the 50th discharging profile, the ratio decreases to 21% for Co3+/Co2+ couple and 27% for Mn3+/Mn2+ couple. Therefore, the Co3+/Co2+ and Mn3+/Mn2+ redox couples express less cycling stability than the Fe3+/Fe2+ redox couple.
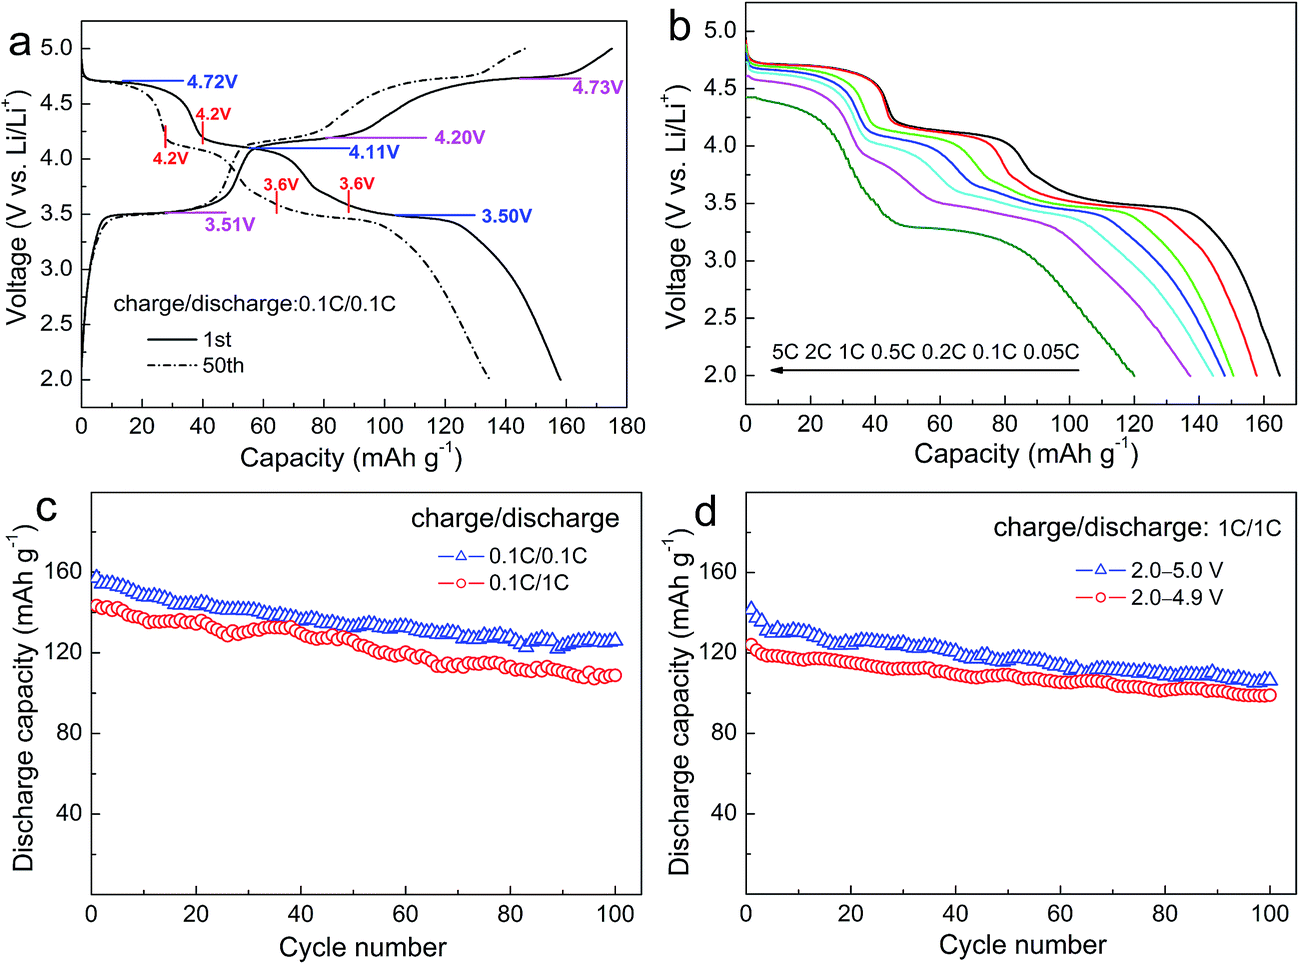 | ||
| Fig. 4 Charge–discharge curves (a); rate discharge curves (b) and cycling performances (c and d) of LFMCP/C. | ||
Fig. 4b describes the discharge curves of LFMCP/C at various rates ranging from 0.05C to 5C. The charge rate keeps constant at 0.1C rate for each discharge. The LFMCP/C delivers discharge capacities of 165, 158, 151, 148, 144 and 137 mA h g−1 at 0.05, 0.1, 0.2, 0.5, 1 and 2C rates, respectively. A large discharge capacity of 120 mA h g−1 is still achieved even at 5C rate, as far as we know, which is the best result at such a high rate in recent literature.28–35 The outstanding rate capability can be mainly attributed to the following two factors. Firstly, the nanometer dimension of LFMCP/C particles shortens the solid diffusion pathway of the Li ions. Secondly, the thinner carbon-coating layer not only enhances the electronic conductivity but also makes the Li ions cross quickly. Moreover, three clear voltage plateaus exist in the discharge curves up to 2C rate, implying lower electrode polarization of LFMCP/C. When discharging at 5C rate, the discharge plateaus for Fe3+/Fe2+ and Co3+/Co2+ still retain well at about 4.4 V and 3.3 V. Whereas the plateau for Mn3+/Mn2+ is not obvious owing to its sluggish kinetics resulting from Jahn–Teller effect of Mn3+ ions.9,34
The cycling stabilities of LFMCP/C at different C-rates are characterized in Fig. 4c. It gives a reversible capacity of 126 mA h g−1 at 0.1C rate over 100 cycles, with corresponding capacity retention of 80%. When discharging at 1C rate, the capacity retention can also reach 76%. It is unusual to see so long cycle life of LFMCP in previous reports. Furthermore, the cycling performances of LFMCP/C charged to different cutoff voltage are compared in Fig. 4d. It shows initial discharge capacities of 141 and 124 mA h g−1 at 1C rate when charging to 5.0 and 4.9 V, respectively. The corresponding capacity retentions are 75% and 80% after 100 cycles, respectively. The increased capacity fading when charging to 5.0 V can be ascribed to the electrolyte decomposition and other subsidiary reactions under high voltage, leading to the deterioration of electrode/electrolyte interface.
To evaluate the cycling performance at elevated temperature, the LFMCP/C composite is cycled at 1C rate and 50 °C after three activation cycles at room temperature and 0.1C rate. As shown in Fig. 5a, it brings an initial charge capacity of 183 mA h g−1 and a discharge capacity of 147 mA h g−1, corresponding to a coulombic efficiency of 80%. The coulombic efficiency rapidly increases to 88% at the third cycle and then remains about 90% in the subsequent cycles (Fig. 5b). The discharge capacity reaches 116 mA h g−1 at the end of 100 cycles at 1C rate, illustrating considerable high-temperature stability. More importantly, the voltage plateaus exist distinctly in the 100th charge/discharge curves, suggesting that the well-ordered olivine structure can be maintained upon cycling. The integral carbon coating layer can avert the direct electrode/electrolyte contact, which effectively alleviates the subsidiary reactions occurring at the electrode/electrolyte interface.
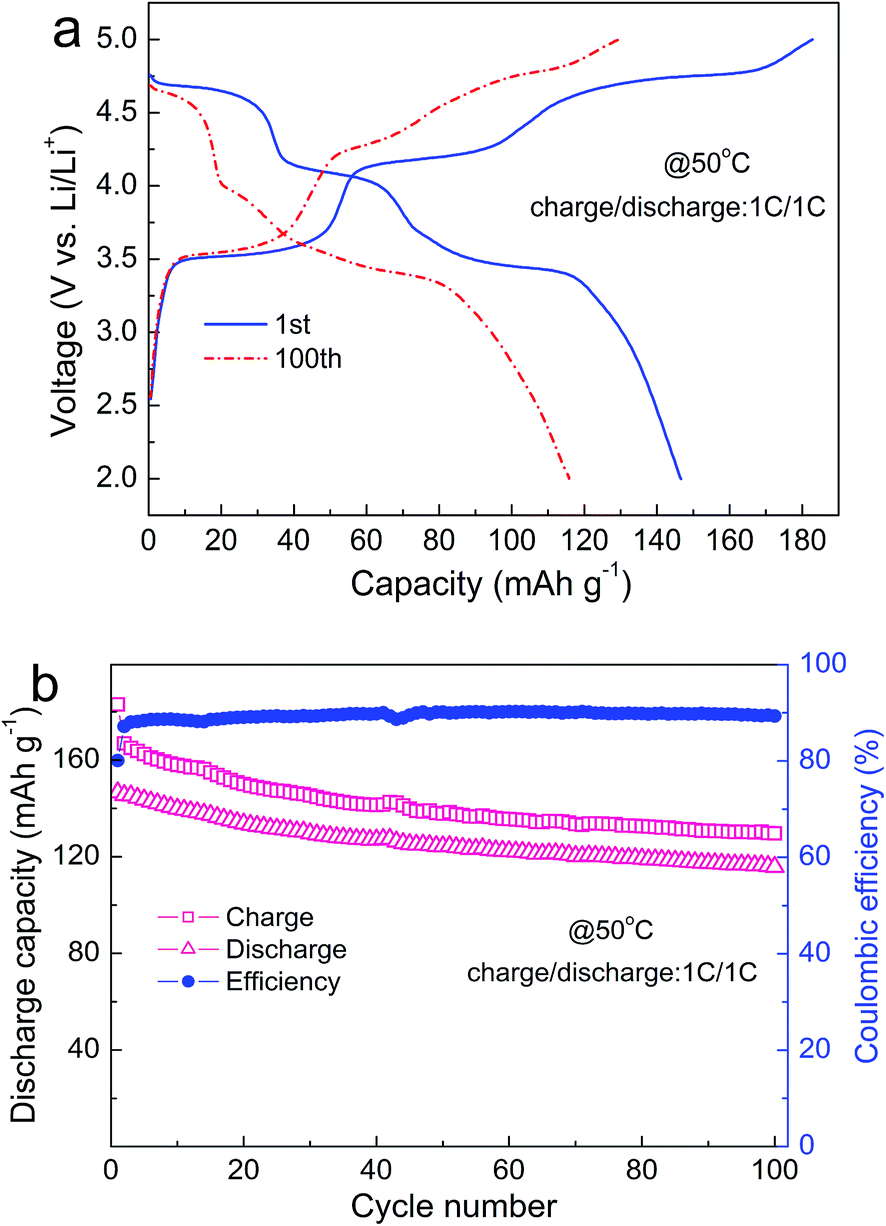 | ||
| Fig. 5 Charge–discharge curves (a) and cycle life (b) of LFMCP/C at 50 °C. | ||
The lithium extraction and insertion behaviors of the LFMCP/C electrode are analyzed by CV tests at different scan rates from 0.1 to 0.5 mV s−1. As shown in Fig. 6a, there are three couple peaks between 2.4 and 5.0 V due to the redox reaction of Fe3+/Fe2+, Mn3+/Mn2+ and Co3+/Co2+, which are in accordance with the three-plateau charge/discharge curves (Fig. 4a). Note that an additional oxidation peak at 4.6 V occurs in the CV at high scan rates (≥0.3 mV s−1), which is associated with the phase transition of LiCoPO4 → Li2/3CoPO4.9,37 More recently, a two-step reaction mechanism for the delithiation/lithiation process of LiCoPO4 is proposed due to the evidence of an intermediate phase Li2/3CoPO4.38,39 Different from the one-step reaction of LiFePO4 and LiMnPO4 (i.e. LiMPO4 ↔ MPO4, M = Fe and Mn), LiCoPO4 occurs two consecutive two-phase reactions (LiCoPO4 ↔ Li2/3CoPO4 ↔ CoPO4) during the charge/discharge process. However, only one reduction peak around 4.6 V is observed in CV (Fig. 6a), which may be ascribed to the solid solution effect and electrochemical polarization. Similar phenomenon is also observed in previous reports.40,41 Furthermore, the potential differences between anodic and cathodic current peaks for Fe3+/Fe2+ and Co3+/Co2+ couples are smaller than that for Mn3+/Mn2+ couple at all scan rates. For example, the potential differences for Fe3+/Fe2+, Mn3+/Mn2+ and Co3+/Co2+ scanned at 0.4 mV s−1 are 0.25, 0.36 and 0.26 V, respectively, demonstrating the poorer electrochemical reversibility of Mn3+/Mn2+ couple than that of Fe3+/Fe2+ and Co3+/Co2+ couples.
 | ||
| Fig. 6 CV curves (a) and the linear relationship of Ip vs. ν1/2 (b) of LFMCP/C. | ||
Fig. 6b displays the plots of Ip vs. ν1/2 for the LFMCP/C electrode. The well linear relationship between the peak current (Ip) and the square root of the scan rate (ν1/2) demonstrates a diffusion-controlled process for the lithium extraction and insertion. The apparent Li ions diffusion coefficient (DLi+, cm2 s−1) can be estimated form the Randles–Sevcik equation:23
| Ip = 2.69 × 10⁵n3/2ADLi+1/2Cν1/2 |
| State | Peaks | DLi+ (cm2 s−1) |
|---|---|---|
| Charge | AFe | 9.18 × 10⁻¹² |
| AMn | 1.89 × 10⁻¹² | |
| ACo | 6.29 × 10⁻¹² | |
| Discharge | CFe | 5.63 × 10⁻¹² |
| CMn | 1.18 × 10⁻¹² | |
| CCo | 5.43 × 10⁻¹² |
4. Conclusions
Monodisperse LFMCP nanoparticles are successfully prepared through a facile solvothermal route in water–ethylene mixed media. The results of XRD and TEM characterizations confirm that the LFMCP particle is a single-phase solid solution. The LFMCP/C composite exhibits relatively outstanding rate capability as well as cycling stability at room and elevated temperatures. The discharge capacity reaches 158 mA h g−1 at 0.1C rate and remains its 80% after 100 cycles. The capacity fading could be mainly attributed to the incomplete reversibility of Mn3+/Mn2+ redox reaction and the electrolyte decomposition at high voltage.Acknowledgements
This study was supported by the National Natural Science Foundation of China (No. 21401061), Provincial Natural Science Research Foundation of Anhui Universities, China (No. KJ2015A332), Key project of Anhui Universities support program for Outstanding Youth, China (No. gxyqZD2016111), Innovation Team of Design and Application of Advanced Energetic Materials and Natural Science Foundation of Anhui Province, China (No. 1308085QB41).References
- A. Padhi, K. Nanjundaswamy and J. B. Goodenough, J. Electrochem. Soc., 1997, 144, 1188–1194 CrossRef CAS.
- F. Wang, J. Yang, Y. NuLi and J. Wang, J. Power Sources, 2011, 196, 4806–4810 CrossRef CAS.
- F. Yu, L. Zhang, M. Zhu, Y. An, L. Xia, X. Wang and B. Dai, Nano Energy, 2014, 3, 64–79 CrossRef CAS.
- S. Wi, J. Kim, K. Park, S. Lee, J. Kang, K. H. Kim, S. Nam, C. Kim and B. Park, RSC Adv., 2016, 6, 105081–105086 RSC.
- H. Guo, C. Wu, J. Xie, S. Zhang, G. Cao and X. Zhao, J. Mater. Chem. A, 2014, 2, 10581–10588 CAS.
- W. Zhang, Z. Shan, K. Zhu, S. Liu, X. Liu and J. Tian, Electrochim. Acta, 2015, 153, 385–392 CrossRef CAS.
- L. Wu, S. Shi, X. Zhang, J. Liu, D. Chen, H. Ding and S. Zhong, Mater. Lett., 2015, 152, 228–231 CrossRef CAS.
- J. L. Allen, T. Thompson, J. Sakamoto, C. R. Becker, T. R. Jow and J. Wolfenstine, J. Power Sources, 2014, 254, 204–208 CrossRef CAS.
- B. Wu, H. Xu, D. Mu, L. Shi, B. Jiang, L. Gai, L. Wang, Q. Liu, L. Ben and F. Wu, J. Power Sources, 2016, 304, 181–188 CrossRef CAS.
- J. Ni, L. Gao and L. Lu, J. Power Sources, 2013, 221, 35–41 CrossRef CAS.
- J. Zheng, L. Ni, Y. Lu, C. Qin, P. Liu, T. Wu, Y. Tang and Y. Chen, J. Power Sources, 2015, 282, 444–451 CrossRef CAS.
- Y.-J. Zhong, J.-T. Li, Z.-G. Wu, X.-D. Guo, B.-H. Zhong and S.-G. Sun, J. Power Sources, 2013, 234, 217–222 CrossRef CAS.
- T. Liu, J. Xu, B. Wu, Q. Xia and X. Wu, RSC Adv., 2013, 3, 13337–13341 RSC.
- J. Xiong, Y. Wang, Y. Wang and J. Zhang, Ceram. Int., 2016, 42, 9018–9024 CrossRef CAS.
- K. Wang, M. Hou, S. Yuan, H. Yu, Y. Wang, C. Wang and Y. Xia, Electrochem. Commun., 2015, 55, 6–9 CrossRef CAS.
- S.-Y. Yan, C.-Y. Wang, R.-M. Gu, S. Sun and M.-W. Li, J. Alloys Compd., 2015, 628, 471–479 CrossRef CAS.
- C. Xu, L. Li, F. Qiu, C. An, Y. Xu, Y. Wang, Y. Wang, L. Jiao and H. Yuan, J. Energy Chem., 2014, 23, 397–402 CrossRef CAS.
- B. Ding, P. Xiao, G. Ji, Y. Ma, L. Lu and J. Y. Lee, ACS Appl. Mater. Interfaces, 2013, 5, 12120–12126 CAS.
- J. Liu, W. Liao and A. Yu, J. Alloys Compd., 2014, 587, 133–137 CrossRef CAS.
- L. Yang, Y. Xia, L. Qin, G. Yuan, B. Qiu, J. Shi and Z. Liu, J. Power Sources, 2016, 304, 293–300 CrossRef CAS.
- Z.-X. Chi, W. Zhang, X.-S. Wang, F.-Q. Cheng, J.-T. Chen, A.-M. Cao and L.-J. Wan, J. Mater. Chem. A, 2014, 2, 17359–17365 CAS.
- W. Liu, P. Gao, Y. Mi, J. Chen, H. Zhou and X. Zhang, J. Mater. Chem. A, 2013, 1, 2411–2417 CAS.
- X. Zhou, Y. Xie, Y. Deng, X. Qin and G. Chen, J. Mater. Chem. A, 2015, 3, 996–1004 CAS.
- I. Taniguchi, T. N. L. Doan and B. Shao, Electrochim. Acta, 2011, 22, 7680–7685 CrossRef.
- C. Nithya, R. Thirunakaran, A. Sivashanmugam and S. Gopukumar, Chem.–Asian J., 2012, 7, 163–168 CrossRef CAS PubMed.
- J. F. Ni, Y. Han, J. Liu, H. Wang and L. Gao, ECS Electrochem. Lett., 2013, 2, A3–A5 CrossRef CAS.
- J. Ni, Y. Han, L. Gao and L. Lu, Electrochem. Commun., 2013, 31, 84–87 CrossRef CAS.
- S. Akimoto and I. Taniguchi, J. Power Sources, 2013, 242, 627–630 CrossRef CAS.
- Y. Zhang, C. S. Sun and Z. Zhou, Electrochem. Commun., 2009, 11, 1183–1186 CrossRef CAS.
- H. Li, Y. Li, L. Chen, H. Jiang, J. Wei, H. Wang and Y. Wang, J. Alloys Compd., 2014, 617, 154–159 CrossRef CAS.
- K. Wang, A. Ottmann, J. Zhang, H.-P. Meyer and R. Klingeler, J. Mater. Res., 2015, 30, 914–923 CrossRef CAS.
- K. Wu, G. Hu, K. Du, Z. Peng and Y. Cao, J. Alloys Compd., 2015, 650, 718–723 CrossRef CAS.
- Y. Xiong, Y. Chen, D. Zeng, Q. Xiao, Z. Li and G. Lei, J. Nanosci. Nanotechnol., 2016, 16, 465–470 CrossRef PubMed.
- Y.-C. Chen, J.-M. Chen, C.-H. Hsu, J.-J. Lee, T.-C. Lin, J.-W. Yeh and H. C. Shih, J. Power Sources, 2010, 195, 6867–6872 CrossRef CAS.
- H. Li, Y. Chen, L. Chen, H. Jiang, Y. Wang, H. Wang, G. Li, Y. Li and Y. Yuan, Electrochim. Acta, 2014, 143, 407–414 CrossRef CAS.
- Y. Wang, B. Zhu, Y. Wang and F. Wang, Ceram. Int., 2016, 42, 10297–10303 CrossRef CAS.
- J. Manzi, F. M. Vitucci, A. Paolone, F. Trequattrini, D. Di Lecce, S. Panero and S. Brutti, Electrochim. Acta, 2015, 179, 604–610 CrossRef CAS.
- M. G. Palmer, J. T. Frith, A. L. Hector, A. W. Lodge, J. R. Owen, C. Nicklin and J. Rawle, Chem. Commun., 2016, 52, 14169–14172 RSC.
- M. Kaus, I. Issac, R. Heinzmann, S. Doyle, S. Mangold, H. Hahn, V. S. K. Chakravadhanula, C. Kübel, H. Ehrenberg and S. Indris, J. Phys. Chem. C, 2014, 118, 17279–17290 CAS.
- T. N. L. Doan and I. Taniguchi, J. Power Sources, 2011, 196, 5679–5684 CrossRef CAS.
- H. Chen, M. Chen, C. Du, Y. Cui, P. Zuo, X. Cheng and G. Yin, Mater. Chem. Phys., 2016, 171, 6–10 CrossRef CAS.
| This journal is © The Royal Society of Chemistry 2017 |