
 Open Access Article
 This Open Access Article is licensed under a
 Creative Commons Attribution 3.0 Unported Licence
Investigation of effects of design parameters on the internal short-circuit in cylindrical lithium-ion batteries
Jun Xuabc,
Yijing Wuab and
Sha Yin *abc
*abc
aDepartment of Automotive Engineering, School of Transportation Science and Engineering, Beihang University, Beijing, China 100191. E-mail: shayin@buaa.edu.cn; Fax: +86-10-82339921; Tel: +86-10-82339921
bAdvanced Vehicle Research Center (AVRC), Beihang University, Beijing, China 100191
cBeijing Key Laboratory for High-efficient Power Transmission and System Control of New Energy Resource Vehicle, Beihang University, Beijing 100191, PR China
First published on 3rd March 2017
Abstract
Cylindrical lithium-ion batteries are now widely applied in electric vehicles as power sources, but they still have an inevitable risk of internal short-circuit accompanied by catastrophic consequences. First, an electrochemical-thermal coupling model was established to predict the short-circuit behavior in a cylindrical battery cell with experimental validation. Second, the governing engineering design parameters such as porosity and thickness of both electrodes and separator have been parametrically discussed. In addition, the influence of the position, short-circuit area, and quantity of the short-circuit points was studied. Results show that the abovementioned governing engineering design parameters make a non-trivial difference to the cell's electrochemical behavior after a short-circuit. This may provide crucial engineering guidance for lithium-ion battery safety design.
1. Introduction
Recently, lithium-ion batteries (LIBs) have been widely used as power sources in vehicles due to their high energy density, excellent cycle stability, and no memory effects.1,2 It has been reported several times that electric vehicles experienced fires and explosions in the cases of collision and spontaneous firing due to battery failure.3,4 The specific gravimetric power density of commercial LIBs could be as high as 240 W h kg−1.5 Therefore, the safety of LIBs still remains an open public concern.6 The most common safety failure mode of lithium-ion batteries is an internal short-circuit, which is a major triggering factor of thermal runaway, fire, and explosion.7,8There are four types of probable internal short-circuit: An–Ca short-circuit (short-circuit between both the electrodes), An–Al short-circuit (short-circuit between the aluminum current collector and anode), Ca–Cu short-circuit (short-circuit between the copper current collector and cathode), and Al–Cu short-circuit (short-circuit between the two current collectors).3,4,9,10 An–Ca short-circuit is one of the most common types of short-circuit.9 Mechanical abuse, such as nail penetration and crushing, may be the major cause of an internal short-circuit.11–13 Numerous electrochemical models and experimental investigations have been carried out to study the mechanisms and characteristics of an internal short-circuit.7,9,10,14,15 The original electrochemical model of the lithium-ion battery was established by the pioneering work of Newman16 and his co-workers, and this model has been validated by many researchers under normal charging/discharging conditions.15,17–19 Furthermore, some other mathematical models describing an internal short-circuit in LIB were suggested,14,20 but most of them are rough and simple, quantitatively describing the internal short-circuit via equivalent empirical circuits and equations.20
A typical battery is composed of a cathode, an anode, a separator, and current collectors in both electrodes, and these major components play an important role in the battery's safety performance.21,22 Cathodes, anodes, and separators are all porous materials, and the porosity of these materials is dependent on the volume fraction of the electrolyte phase.23,24 Ye et al.19 performed calibrations of Newman's electrochemical model for the Li-ion battery at different rates and operation temperatures, revealing the potential thermal hazards of a Li-ion battery under inappropriate operating conditions. Fang et al.10,25 previously used an electrochemical-thermal coupled model for lithium-ion batteries to predict the electrode voltage with experimental validation and then developed a 3D model to study the internal short-circuit on the basis of their former study. Santhanagopalan et al.9 investigated the impact of some parameters, such as short-circuit area, cell capacity, SOC, and initial temperature, on an internal short-circuit. Zhao et al.5 also conducted a parametric study of short-circuit and found that the short-circuit resistance and the number of short layers greatly influenced the short-circuit behavior.
For a better understanding of the features of short-circuit, a more accurate numerical model should be proposed to connect local short-circuit with the electrochemical reactions occurring in the rest of the battery. In the present study, an electrochemical-thermal lithium-ion battery model was suggested and validated via experiments to predict the behavior of LIBs during an internal short-circuit. In this model, the governing parameters focused on were the engineering design parameters of thickness and porosity, which were controlled to investigate their effects in terms of voltage drop and temperature rise behaviors. In addition, the short-circuit area and the number of failure separator layers for a typical short-circuit type were investigated for their influences on the internal short-circuit behavior. Furthermore, one-point short-circuit and multi-point short-circuit of the cell have also been discussed to find out the impact of multi-point internal short-circuit on the LIB safety failures.
2. Modeling and validation
2.1 1D electrochemical LIB model
The electrochemical model for the LIB was based on Newman's pioneering work,16 considering the transport of mass in the electrolyte and solid phase through the porous electrode and electrolyte, current conduction, and electrochemical reactions in the porous electrode. Porous electrode and concentrated solution theories25 were adopted to describe the electrochemical kinetics and transport phenomena in the LIB on the basis of mass and current balance. This model was verified via experiments under normal charging/discharging and short-circuit conditions, which have been discussed in hereinafter. The cell voltage and temperature can both be well predicted via this electrochemical LIB model. As shown in Fig. 1, the model was constructed as a one-dimensional model, consisting of a positive electrode, a separator, and a negative electrode where the three components were all treated as porous materials immersed in the electrolyte. According to porous-electrode theory, both positive and negative electrodes are considered as finite spherical solid particles that are in contact with the electrolyte. The governing equations are listed in Table 1. Four essential dependent variables were solved in the model: the electric/electrolyte potential (ϕs/ϕl), lithium concentration in the electrode particles (cs), and lithium ion concentration in the electrolyte (cl).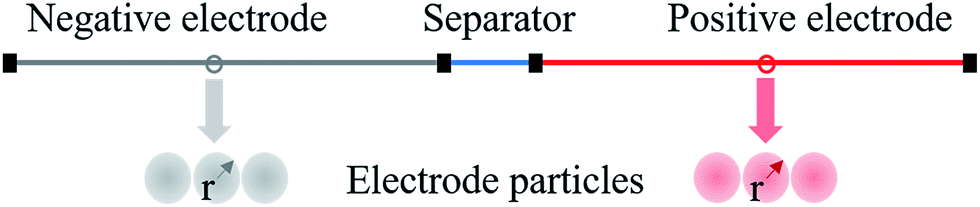 | ||
| Fig. 1 Schematic of the 1D electrochemical LIB model. | ||
| Electrochemical mechanism | Governing equation description15,25 | |
|---|---|---|
| Solid phase, electrode, mass balance | 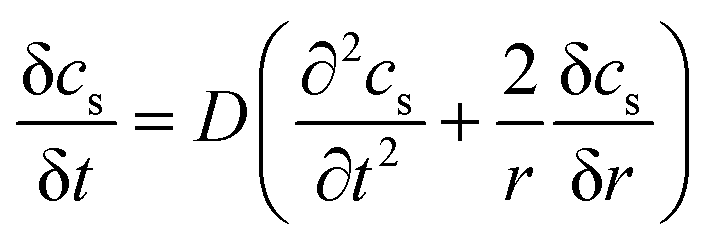 |
(1) |
| Solid phase, electrode, current balance | 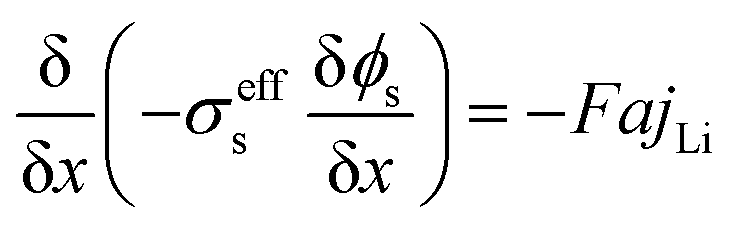 |
(2) |
| Electrolyte phase, electrode & separator, mass and charge balance | 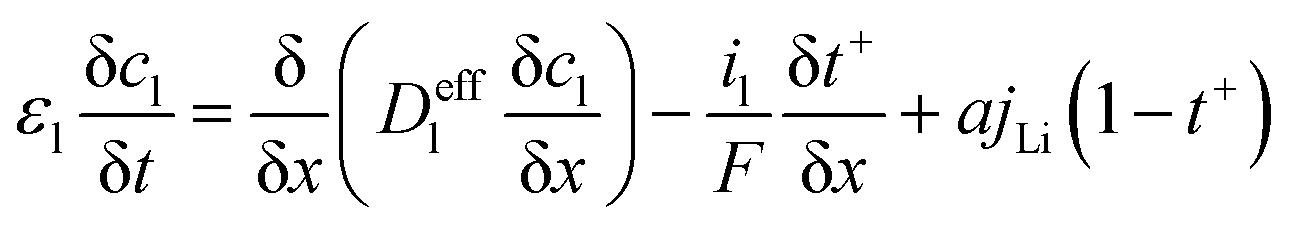 |
(3) |
| Electrochemical kinetics, reaction rate | 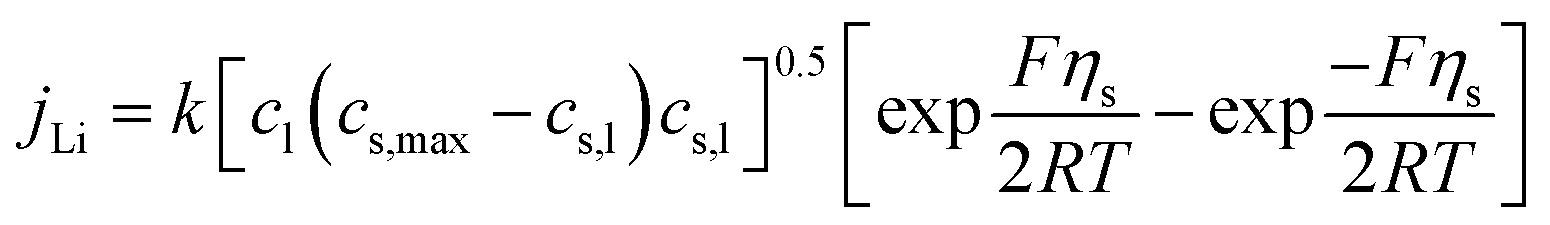 |
(4) |
| Heat generation | 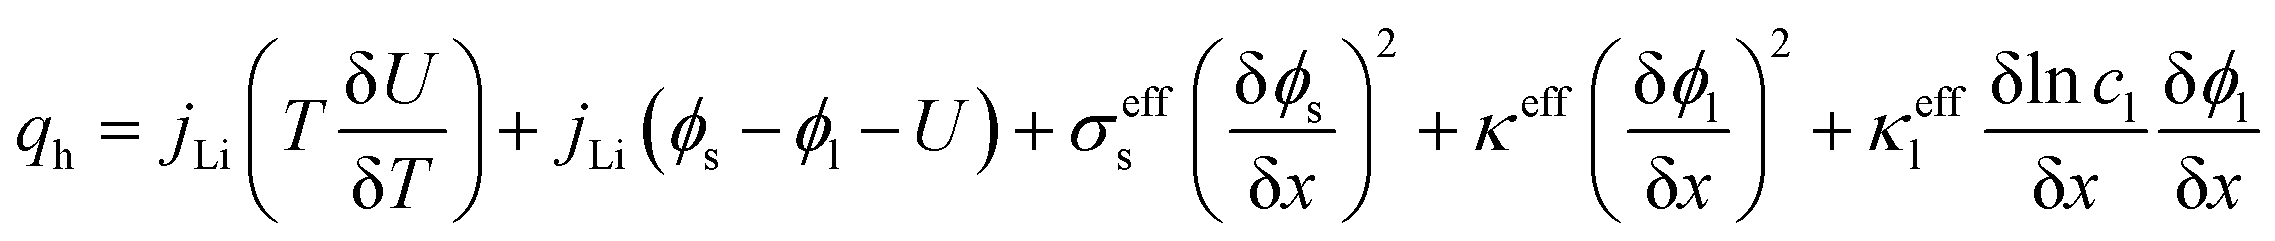 |
(5) |
| Overpotential | ηs = ϕs − ϕl − U | (6) |
| Specific interfacial area in the electrode | a = 3εs/Rs | (7) |
| Electrical conductivity | σeffs = σεps | (8) |
| Diffusion coefficient | Deffl = Dlεpl | (9) |
| Ionic conductivity | κeffl = κlεpl | (10) |
For calculating the LIB voltage during normal charging and discharging processes, the current density is and the referenced concentration of the electrodes were the key factors. Appropriate adjustments could be made to these key factors for the calibration of actual operation characteristics of LIBs.
2.2 1D short-circuit model
As abovementioned, there are four types of short-circuit and due to the fact that electrical conductivity of the cathode is generally much lower than that of the anode and current collectors (Al and Cu), the short-circuit impedance of the An–Ca and Ca–Cu types of short-circuit are approximately 10 times higher than that of the other two types of short-circuits.For simplicity, the An–Ca short-circuit was studied. Although An–Ca short-circuit is not the most dangerous type of short-circuit, it is one of the most common types of short-circuits and therefore deserves research. The methodology used to investigate the influence of the electrodes and separator's thickness and porosity upon short-circuit features can also be adopted to analyze the other three types of short-circuits. In an An–Ca short-circuit, electrons bypass the separator to carry the short-circuit current. The short-circuit current density is directly determined by the number of failure separator layers. The short-circuit model could also be constructed in a one-dimensional coordinate, where the transport of electrons via the cathode and anode would both be considered. Thus, in the 1D short-circuit model, the short-circuit current density is calculated by
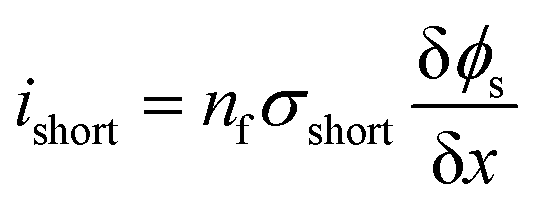 | (11) |
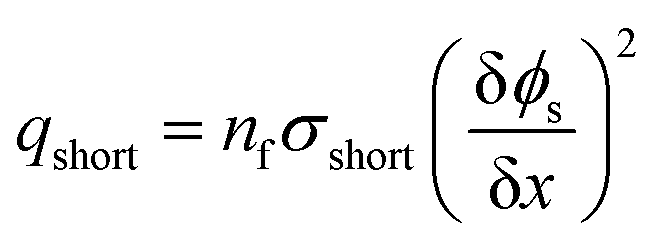 | (12) |
To couple the 1D short-circuit model with the LIB model, the boundary condition was established by setting the negative electrode terminal potential to be zero and the positive electrode terminal potential as the positive terminal potential in the LIB model, i.e. V−s = 0 and V+s = ϕ+s. Therefore, the LIB model and short-circuit model were coupled together and the parameters were iteratively calculated.
In the initial step of the calculation, the cell was at a full charge state; thus, in the LIB model, the cell voltage ϕ+s was 4.2 V and was assigned to the boundary condition for the short-circuit model. Then, the short-circuit current density was calculated within the short-circuit model, and the result support the LIB model. Thus, the voltage in the next step could be calculated and substituted into the short-circuit model.
2.3 3D electrochemical-thermal coupled battery model for short-circuit
To predict the thermal behavior of the battery under a short-circuit condition, a three-dimensional axisymmetric cylindrical battery model was constructed to investigate the thermal properties, heat generation, and heat dissipation throughout the entire cell, as shown in Fig. 2. Obviously, resolving a detailed three-dimensional multilayer model was computationally expensive; hence, some assumptions and simplifications were adopted, which have been validated by Feng et al.26 First, the cell was assumed to be a homogeneous bulk with an overall density and specific capacity. Second, to capture the thermal paths throughout the cell, anisotropic thermal conductivity of the multilayer cylindrical battery was adopted. Thus, the fairly spatially uniform temperature distribution can be calculated by the following heat balance equation:
 | (13) |
 | (14) |
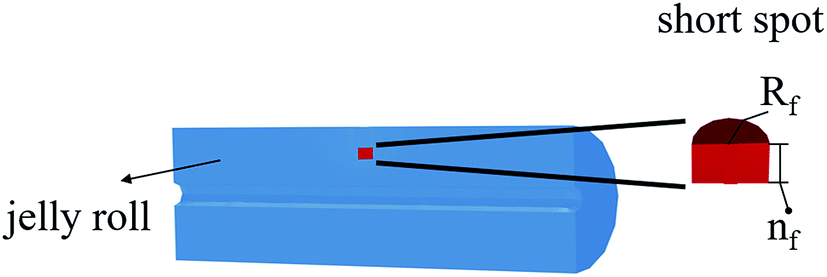 | ||
| Fig. 2 Schematic of the 3D axisymmetric thermal model at short-circuit; Rf denotes the radius of the short-circuit failure area and nf denotes the number of failure separator layers. | ||
To develop an electrochemical-thermal model, the heat source q in eqn (13) should be defined as the heat generation of the battery considering the occurrence of a short-circuit. Inside the entire jelly roll area beside the short-circuit spot, the volumetric heat generation q was calculated by eqn (5) from the electrochemical reactions in the LIB, whereas at the short-circuit spot, eqn (12) was utilized to obtain the heat originated from the short-circuit. Furthermore, the temperature calculated in the thermal model was substituted back into the LIB model and short-circuit model for calculating the updated heat sources and returning them to the thermal model, allowing the cell temperature profile of the next time-step to be evaluated. Therefore, the LIB model, short-circuit model, and thermal model were seamlessly coupled for the calculation of the generated heat source and the average temperature inside the cell.
In summary, the electrochemical LIB model and short-circuit model were both 1D models, whereas the thermal model was a 3D model. The 1D LIB model and 1D short-circuit model were used to calculate the heat sources and then the 1D heat sources were introduced into the 3D thermal model to obtain the temperature distribution. In return, the temperature calculated in the 3D thermal model could be treated as a variable in the 1D LIB model and 1D short-circuit model. As a result, the three models were coupled together. This coupling model was established to investigate the influences of the electrodes' and separator's porosity and thickness upon an internal short-circuit. Since resolving a 3D multilayer battery model can be computationally expensive, this coupling model coupled with the 1D LIB model and 1D short-circuit model will help to improve the convergence speed, reduce the amount of calculations, and acquire the desired characteristic parameters through a reliable and efficient way.
3. Results
To validate the model, simulation results were compared with the experimental data in the cases of normal charging/discharging processes and short-circuit.A typical commercial battery, a 2200 mA h lithium–cobalt oxide cell, was used. Graphite material served as the negative electrode and LiCoO2 was used as the positive electrode. LiPF6 in 3![[thin space (1/6-em)]](https://www.rsc.org/images/entities/char_2009.gif) :7 EC:EMC was the solvent liquid electrolyte. A 18650 LiCoO2 battery was first adopted in the Tesla Roadster due to its high conductivity, high energy density and power density, and high compaction density as well as being a mature technology. To set up the boundary conditions for the battery in the short-circuit case, the negative electrode terminal potential was set to be zero, whereas the current boundary was applied to the positive electrode as the short-circuit current density, i.e. i+s = ishort.
:7 EC:EMC was the solvent liquid electrolyte. A 18650 LiCoO2 battery was first adopted in the Tesla Roadster due to its high conductivity, high energy density and power density, and high compaction density as well as being a mature technology. To set up the boundary conditions for the battery in the short-circuit case, the negative electrode terminal potential was set to be zero, whereas the current boundary was applied to the positive electrode as the short-circuit current density, i.e. i+s = ishort.
In a normal charging/discharging experiment, a 2200 mA h lithium cobalt oxide 18650 cell was charged from 0 to 100% SOC and discharged from 100 to 0% SOC at the rate of 0.3, 0.4, and 1C at room temperature (25 °C). During charging and discharging, the voltage was monitored and plotted. A satisfactory agreement between the simulation and experimental results was observed, as shown in Fig. 3(a) and (b).
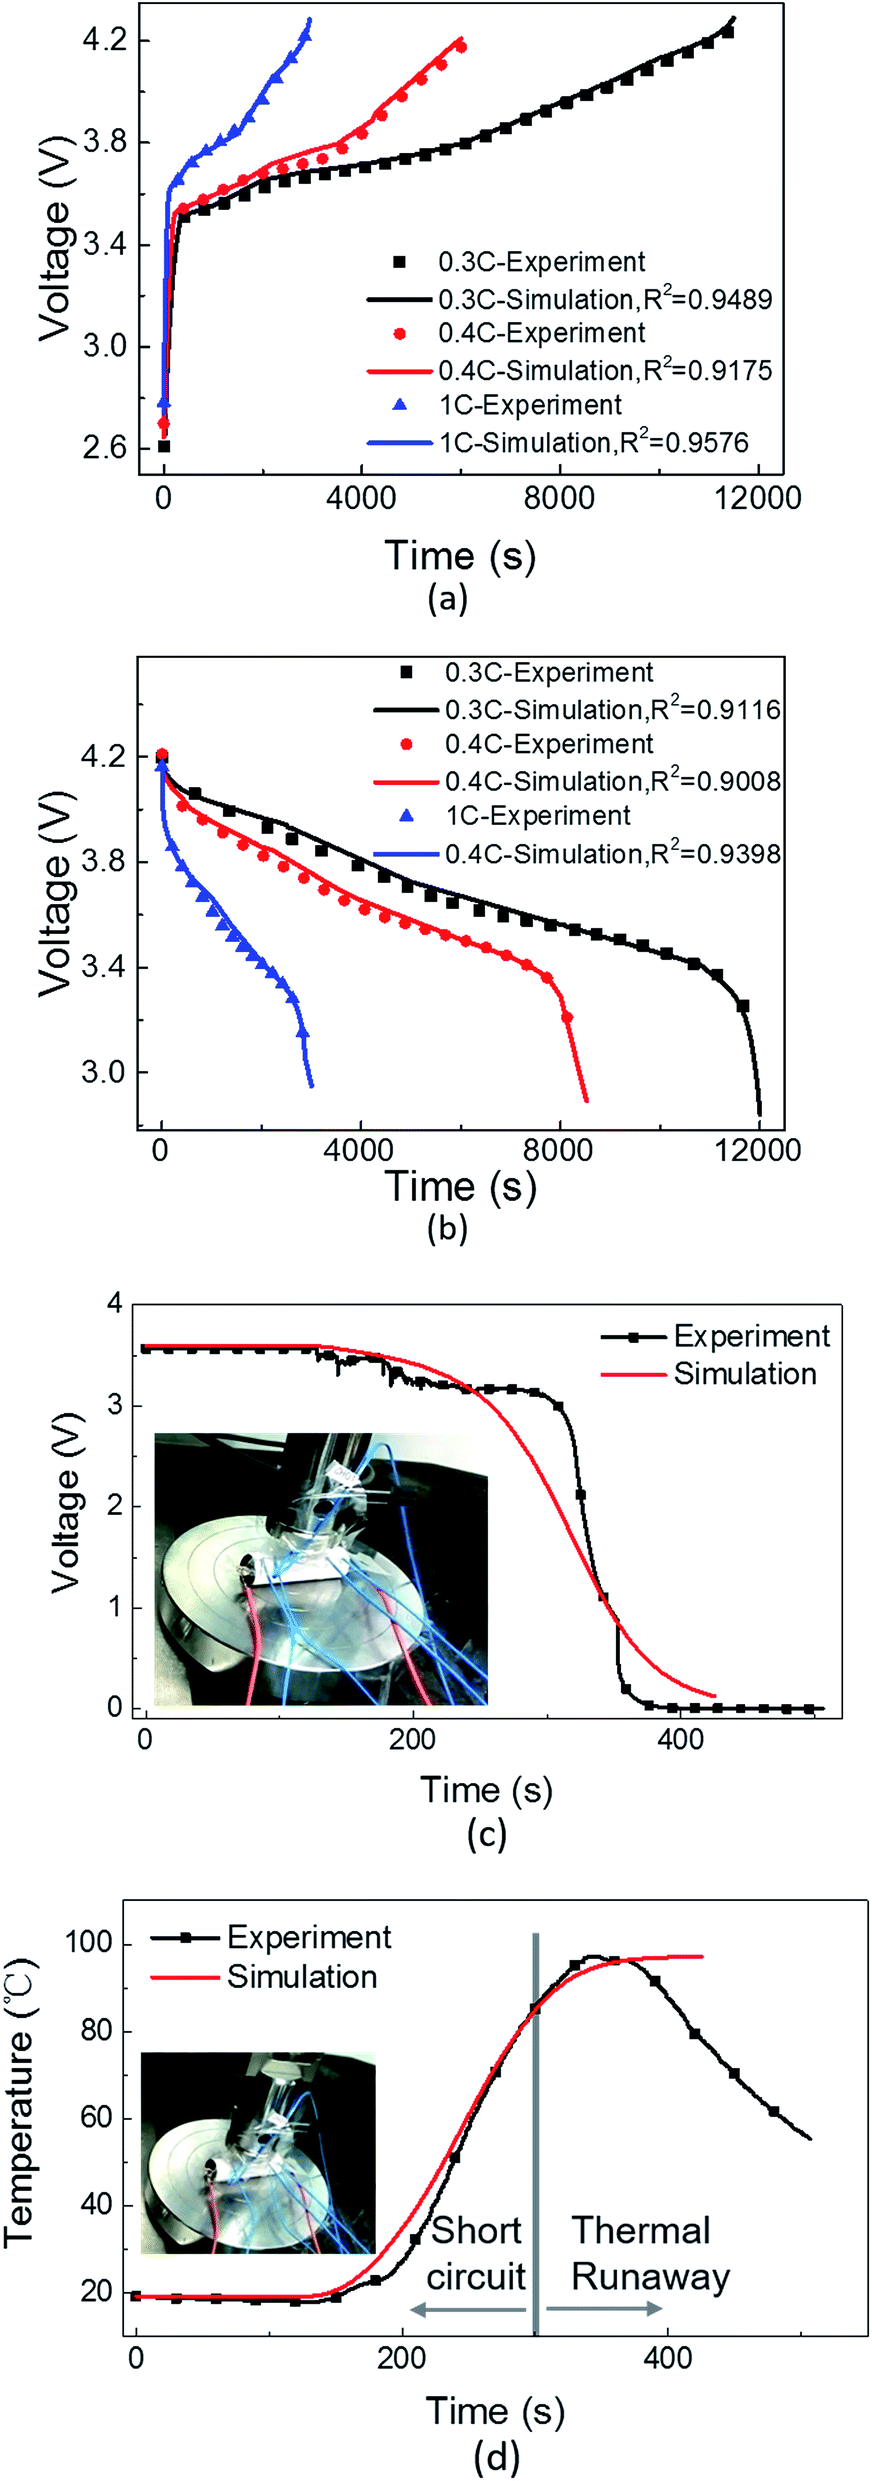 | ||
| Fig. 3 Model validation with experimental data: (a) charging voltage; (b) discharging voltage; (c) short-circuit voltage; (d) short-circuit temperature. The insets in (c) and (d) show the experimental setup for nail penetration test, while red wires are used to measure cell voltage and blue wires are connected with thermal couples for temperature measurement. | ||
In the nail penetration experiment, a lithium-ion cell of the same type was penetrated using a steel nail and then short-circuit was triggered. The radius of the steel nail was 1 mm, and the depth of penetration was determined by the penetration velocity of 2 mm min−1. The short-circuit area in the model was equivalent to a cylindrical shape and was adjusted via two parameters, i.e. the critical radius of the cross section of the short-circuit area Rf and the number of failure separator layers nf. For validation, Rf was valued as the radius of the steel nail during the nail penetration test for an internal short-circuit, and nf was adjusted based on the penetration depth of the steel nail. Then, the experimental short-circuit voltage and temperature curves were compared with the numerical simulation results, as shown in Fig. 3(a) and (b). At the initial stage of nail penetration, the voltage remained quite stable because the penetration depth was not deep enough to initiate a short-circuit. Additionally, the temperature didn't increase. At about 120 s, i.e. 2 min, the penetration depth was 4 mm and an internal short-circuit was initiated; thus, the voltage began to drop and the temperature began to increase. In the simulation, the short-circuit radius Rf was valued as 1 mm, and the number of failure separator layers nf was valued as 20 according to the penetration depth and thickness of the electrodes and separator, which was equivalent to the experimental settings. As shown in Fig. 3(d), at about 300 s, thermal runaway occurred and the experimentally measured temperature and the simulated temperature could not be matched; therefore, this model was validated for a short-circuit before thermal runaway. The numerically calculated short-circuit voltage drop range and profile along with the temperature change agrees with the experimental data. As a result, in both the cases, the model was effectively and sufficiently validated.
These results prove that the model established in this study can be used to accurately describe the major electrochemical behaviors during normal charging/discharging operations as well as in an internal short-circuit scenario. Hereinafter, the engineering design parameters, such as porosity and thickness of the electrodes and separator, have been discussed to identify their influences on the behaviors during an internal short-circuit. Furthermore, the impact of the size of the short-circuit area and the number of failure separator layers was studied, and different short-circuit scenarios of one-point and multi-point short-circuits have also been presented.
4. Discussion
4.1 Parametric effect of one-point short-circuit
To understand the effect of the fundamental material properties of lithium-ion battery on the short-circuit phenomenon, the governing parameters studied herein were porosity and thickness of the separator, positive electrode, and negative electrode. Porosity in the model was defined as the electrolyte phase volume fraction (epsl), and the thickness was the geometric feature (L). Herein, epsls, epslp, and epsln represent the electrolyte phase volume fractions in the separator, positive electrode, and negative electrode, respectively, whereas Ls, Lp, and Ln represent the thicknesses in the same way. The original values of the selected parameters are summarized in Table 2. The above mentioned six parameters have been discussed for the effects of the separator and electrodes' porosity and thickness on the short-circuit behaviors of LIB.| Separator | Negative electrode | Positive electrode | |
|---|---|---|---|
| epsl | 0.37 | 0.444 | 0.4 |
| L | 18 μm | 73 μm | 73 μm |
During cell manufacturing, the porosity is related to many factors, such as the selection of raw materials, the dispersive uniformity in the electrolyte, the control of the slurry density, the mixing processing, etc. For the manufacture of a membrane, the dry and wet methods will result in different porosities; the latter produce a higher porosity. Nowadays, many advanced manufacturing techniques have been developed to improve the porosity design of the electrodes and separator of cells. It is essential and meaningful to explore the relationship between porosity and safety design for the Li-ion battery. Moreover, the thicknesses of the separator and electrodes are also important design parameters in manufacturing Li-ion cells, which is worthy of research.
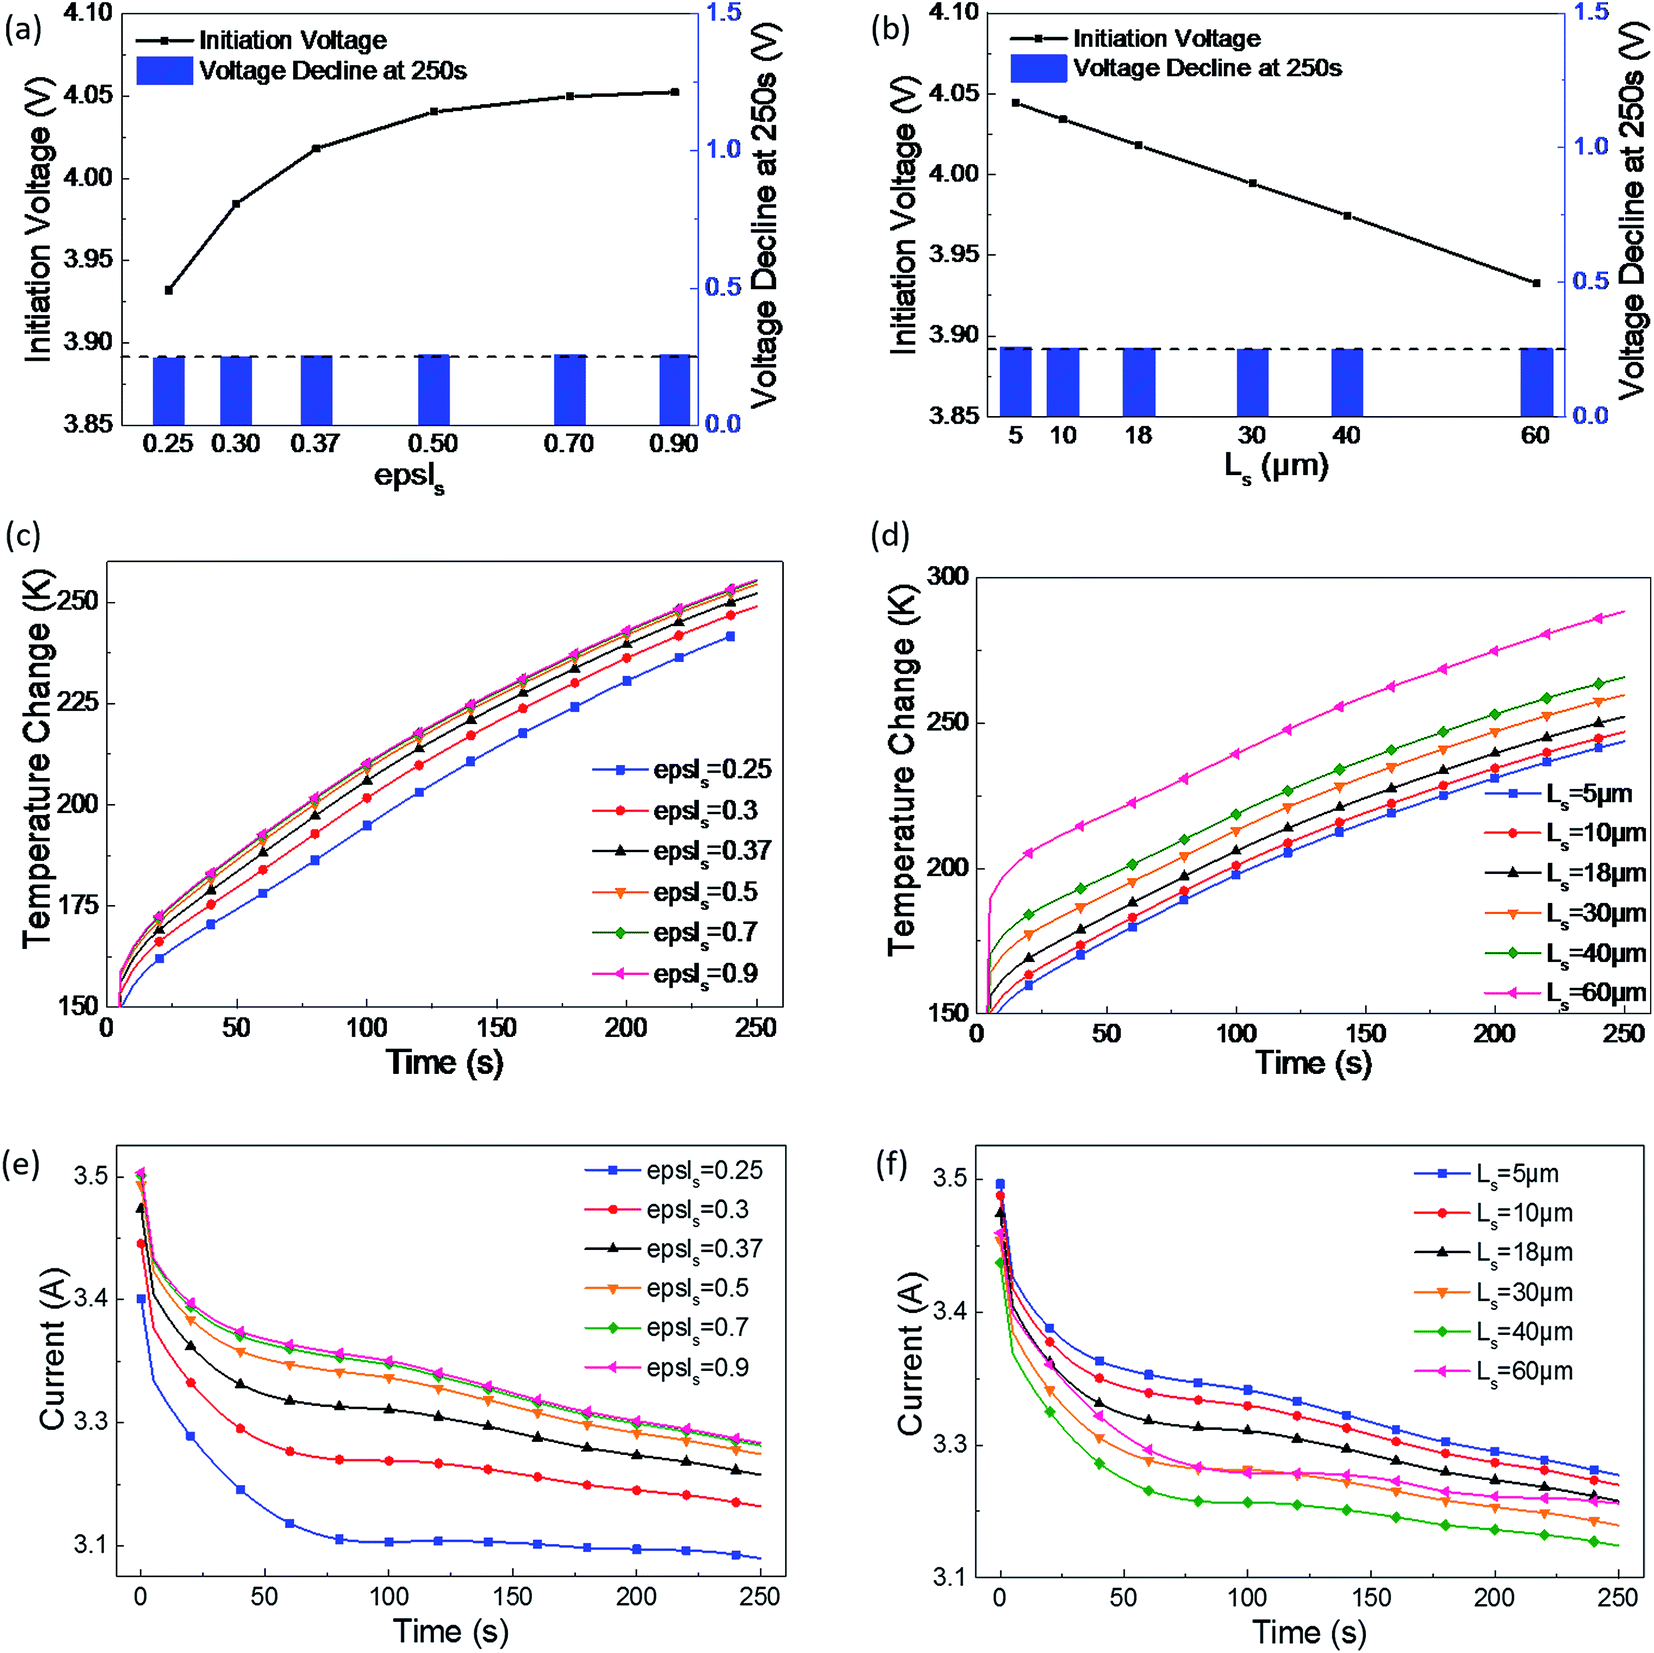 | ||
| Fig. 4 Effect of the separator's (a), (c) and (e) electrolyte phase volume fraction, and (b), (d) and (f) effect of thickness on the short-circuit voltage, temperature, and current. | ||
In Fig. 4(a), as the electrolyte phase volume fraction increases, the initiation short-circuit voltage gets higher, but this increasing tendency slows down. In Fig. 4(b), the initiation voltage linearly decreases with the increase of separator thickness; thus, a linear relationship between the separator thickness and initial short-circuit voltage can be concluded into an empirical formula from the plot as follows:
| V = 4.05462 − 0.00202Ls | (15) |
Heat generation at the short-circuit spot is directly related to the joule heat power, which is the product of the short-circuit voltage and circuit; therefore, with the increase of epsls, maximum increase in temperature occurs due to the increase of short-circuit voltage and current, as shown in Fig. 4(c). However, as shown in Fig. 4(d), the maximum temperature gradually increases as the separator becomes thicker. With the increase of Ls, the joule heat power of short-circuit decreases, whereas the temperature increases. This can be interpreted as the thermal conductivity of the separator being much lower than that of the cathode and anode. Consequently, when the separator becomes thicker, the heat originating from short-circuit becomes more difficult to dissipate through the cell and then the temperature increases.
From the abovementioned, it can be observed that the porosity and thickness are the main influences on the initiation voltage and temperature during a short-circuit. While considering a safer LIB design and the influence rules of epsls and Ls, the value of epsls should be selected in the range of 0.3–0.5 and that of Ls in the range of 10–18 μm to maintain a balance of voltage and temperature.
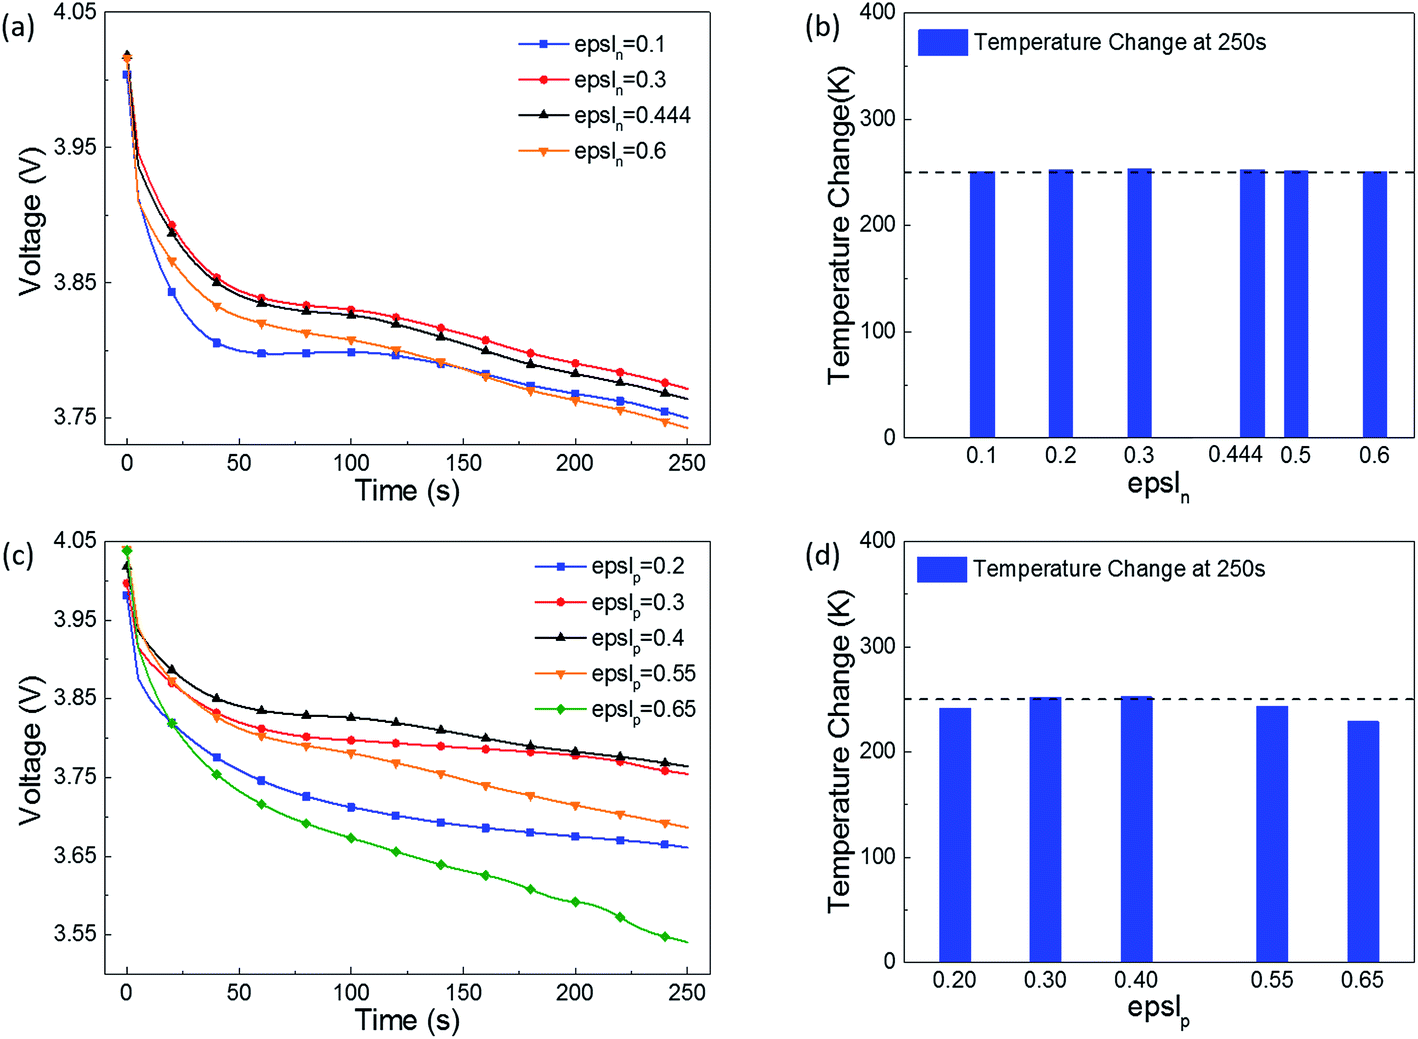 | ||
| Fig. 5 Effect of the electrolyte phase volume fraction in the (a) and (b) negative electrode, and (c) and (d) positive electrode on the short-circuit voltage and temperature. | ||
Comparing the voltage and temperature change as the porosity changes in the positive and negative electrodes (Fig. 5(a) vs. (c), and Fig. 5(b) vs. (d)), at 250 s after the short-circuit is triggered, the voltage drop and temperature increase as the porosity changes in the positive electrode appear to be larger than those for the negative electrode. It was speculated that the porosity influences the insertion of Li+ in the cathode more than the extraction of Li+ in the anode during a short-circuit.
Therefore, the porosity of the cathode has a greater impact on the LIB's short-circuit voltage and temperature. When it comes to a safer LIB design, the selection of epslp should be considered in more detail. For this type of LIB, the original design values of epslp = 0.4 and epsln = 0.444 are quite reasonable.
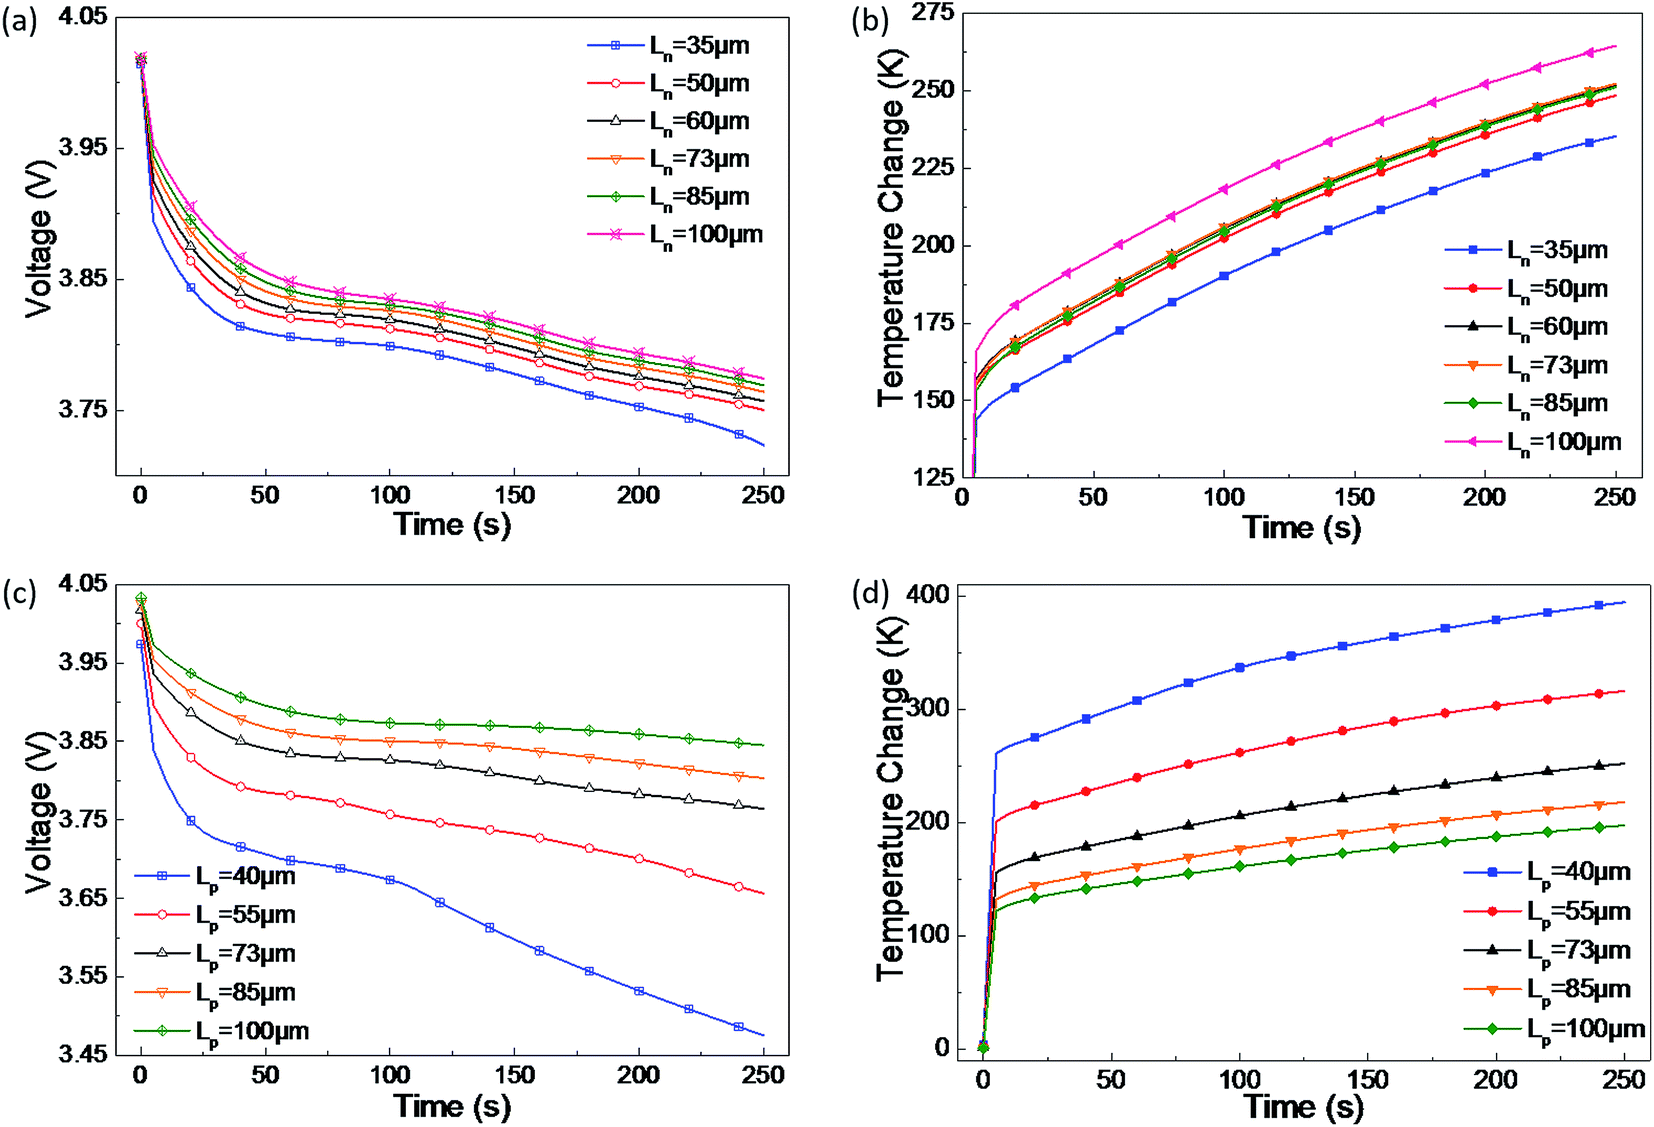 | ||
| Fig. 6 Effect of the (a) and (b) negative electrode's thickness, and (c) and (d) positive electrode's thickness on short-circuit voltage and temperature. | ||
Due to the decreased short-circuit current, joule heat power reduces with an increase in electrode thickness and thus temperature increases, as demonstrated by the results of the parametric study on Lp (Fig. 6(d)). However, the maximum temperature increase at the short-circuit spot varies due to the change of Ln. The reason lies in the different storage capacities for lithium ions in the two electrodes. During the short-circuit discharging process, lithium-ions should be extracted from the anode and should travel to the cathode to balance the electron transfer. In this case, once the negative electrode increases to a certain thickness, the storage capacity for lithium-ions gains an obvious enlargement and more ions in motion are provided regardless of the temperature increase. As a result, during short-circuit discharging, the increase of lithium ions leads to a stronger electrochemical reaction, causing a higher maximum temperature. Conversely, when Ln is diminished to a certain extent, the storage capacity for lithium-ions is not adequate and the maximum temperature becomes lower.
Note that Lp has a greater effect on the short-circuit voltage than Ln. This is the same law as the former parametric study of electrode porosity, which may provide useful guidance for designing a safer LIB.
From the parametric study, the thickness of the cathode has a more important significance than that of the anode due to the impact on the short-circuit voltage and temperature. Electrodes with a larger thickness, i.e. Ln in the range of 50–85 μm and Lp in the range of 55–85 μm, are better at maintaining a stable voltage and avoiding too much heating during a short-circuit.
4.2 Study of short-circuit failure area size
The short-circuit failure area in this study was equivalent to a small cylinder inside a cylindrical-shaped cell, as shown in Fig. 2. The radius of its cross section represents the critical area of failure for the separator and electrodes, and the depth is determined by the number of failure separator layers. Therefore, the study of short-circuit failure area size mainly focuses on two parameters, i.e. the radius of the short-circuit failure area Rf and number of failure separator layers nf.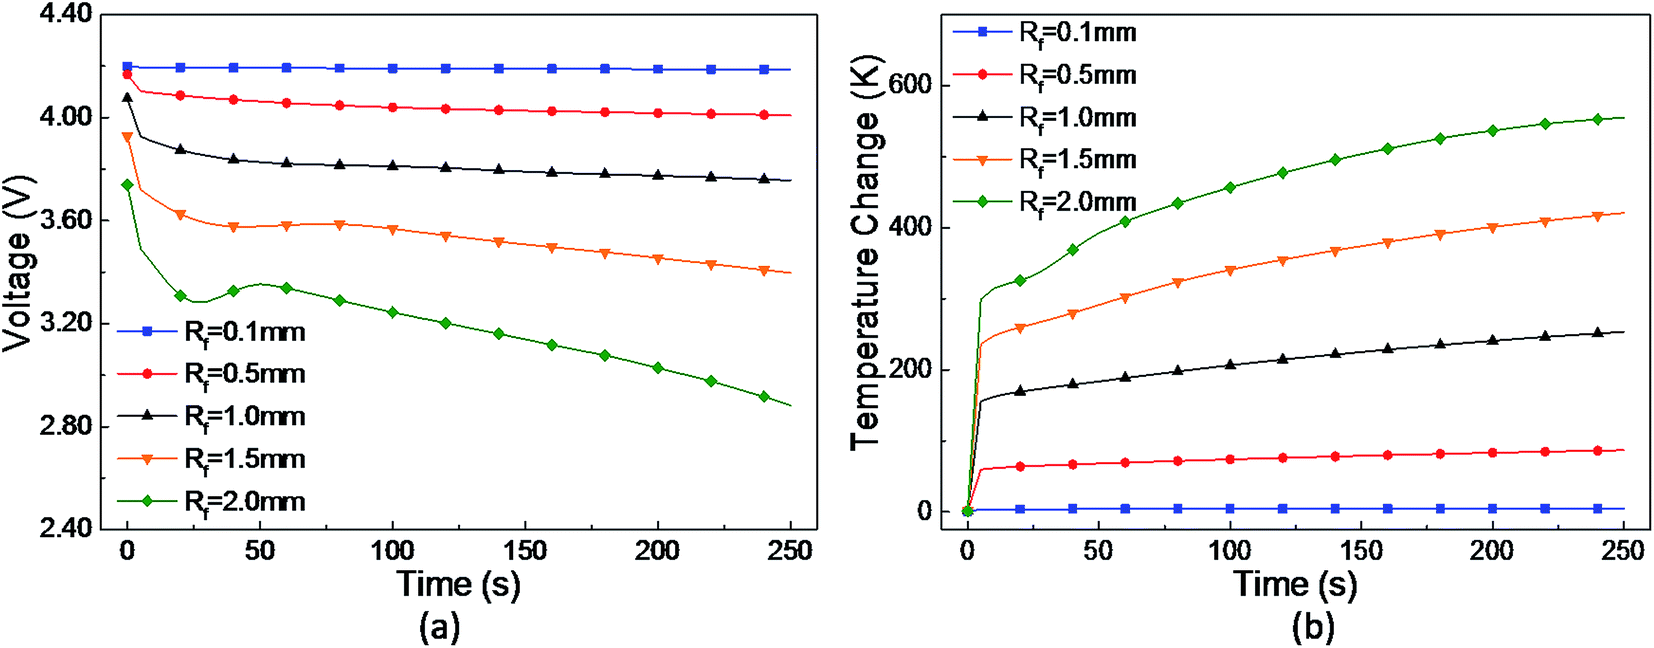 | ||
| Fig. 7 (a) Voltage and (b) temperature curves at different radii of the short-circuit failure area. | ||
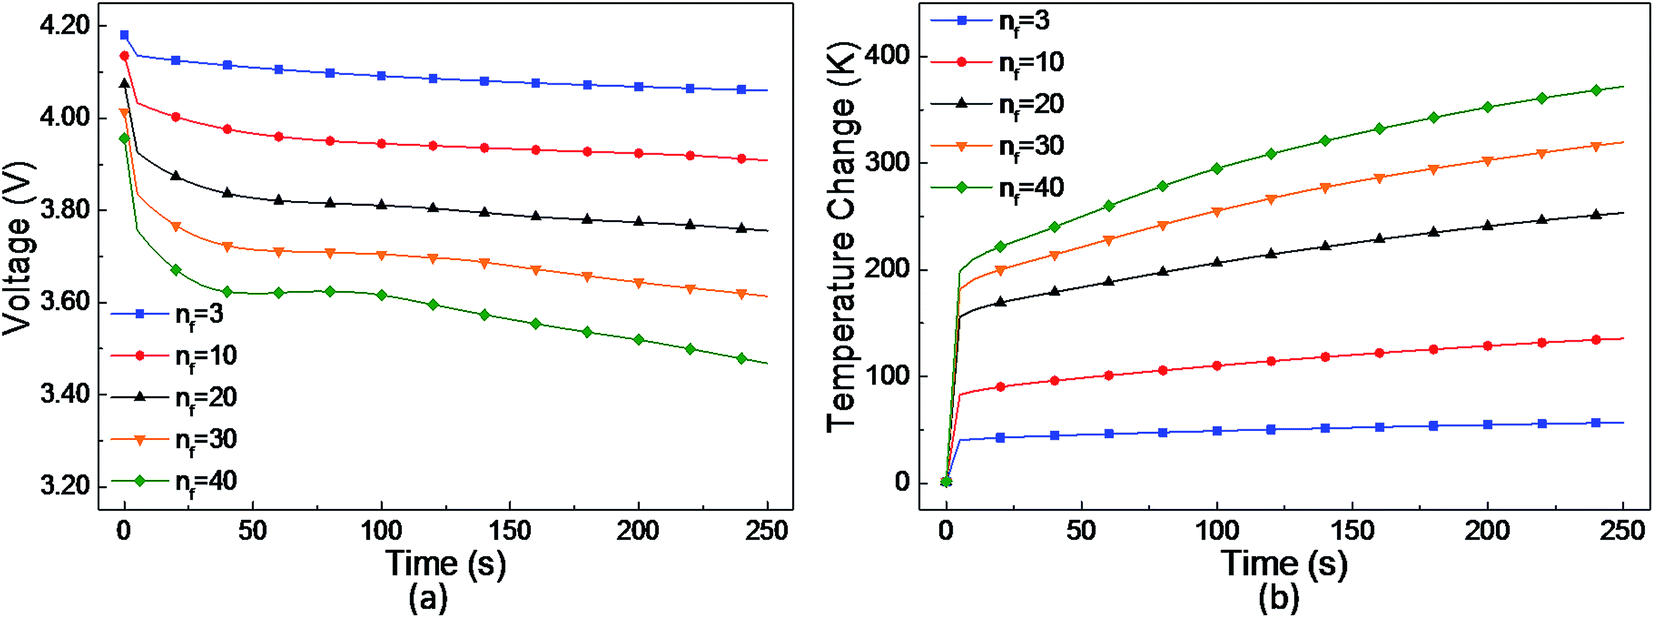 | ||
| Fig. 8 (a) Voltage and (b) temperature curves at different numbers of failure separator layers. | ||
4.3 Study of a multi-point short-circuit
The parametric study of the number of short-circuit points was conducted and the voltage and temperature curves are plotted in Fig. 9(a) and (b). It can be seen that the voltage drop and temperature rise increase with the number of short-circuit points. Note that under the 6-point short-circuit condition, the voltage of the LIB drops down to approximately 0 V at 250 s after the occurrence of a short-circuit. Along with the sharp decline in voltage and current at about 225 s, the short-circuit heat power rapidly decreases. Thus, the cell temperature reaches the maximum value of 771 K at about 225 s, as shown in Fig. 9(c), which then begins to drop due to the rapid reduce in the heat source. As shown in Fig. 9(b)–(d), at the temperature peak point A, the highest temperature area concentrates on the short-circuit points in the cell, whereas at 250 s, the temperature distribution of the jelly roll area is quite uniform due to thermal conduction.
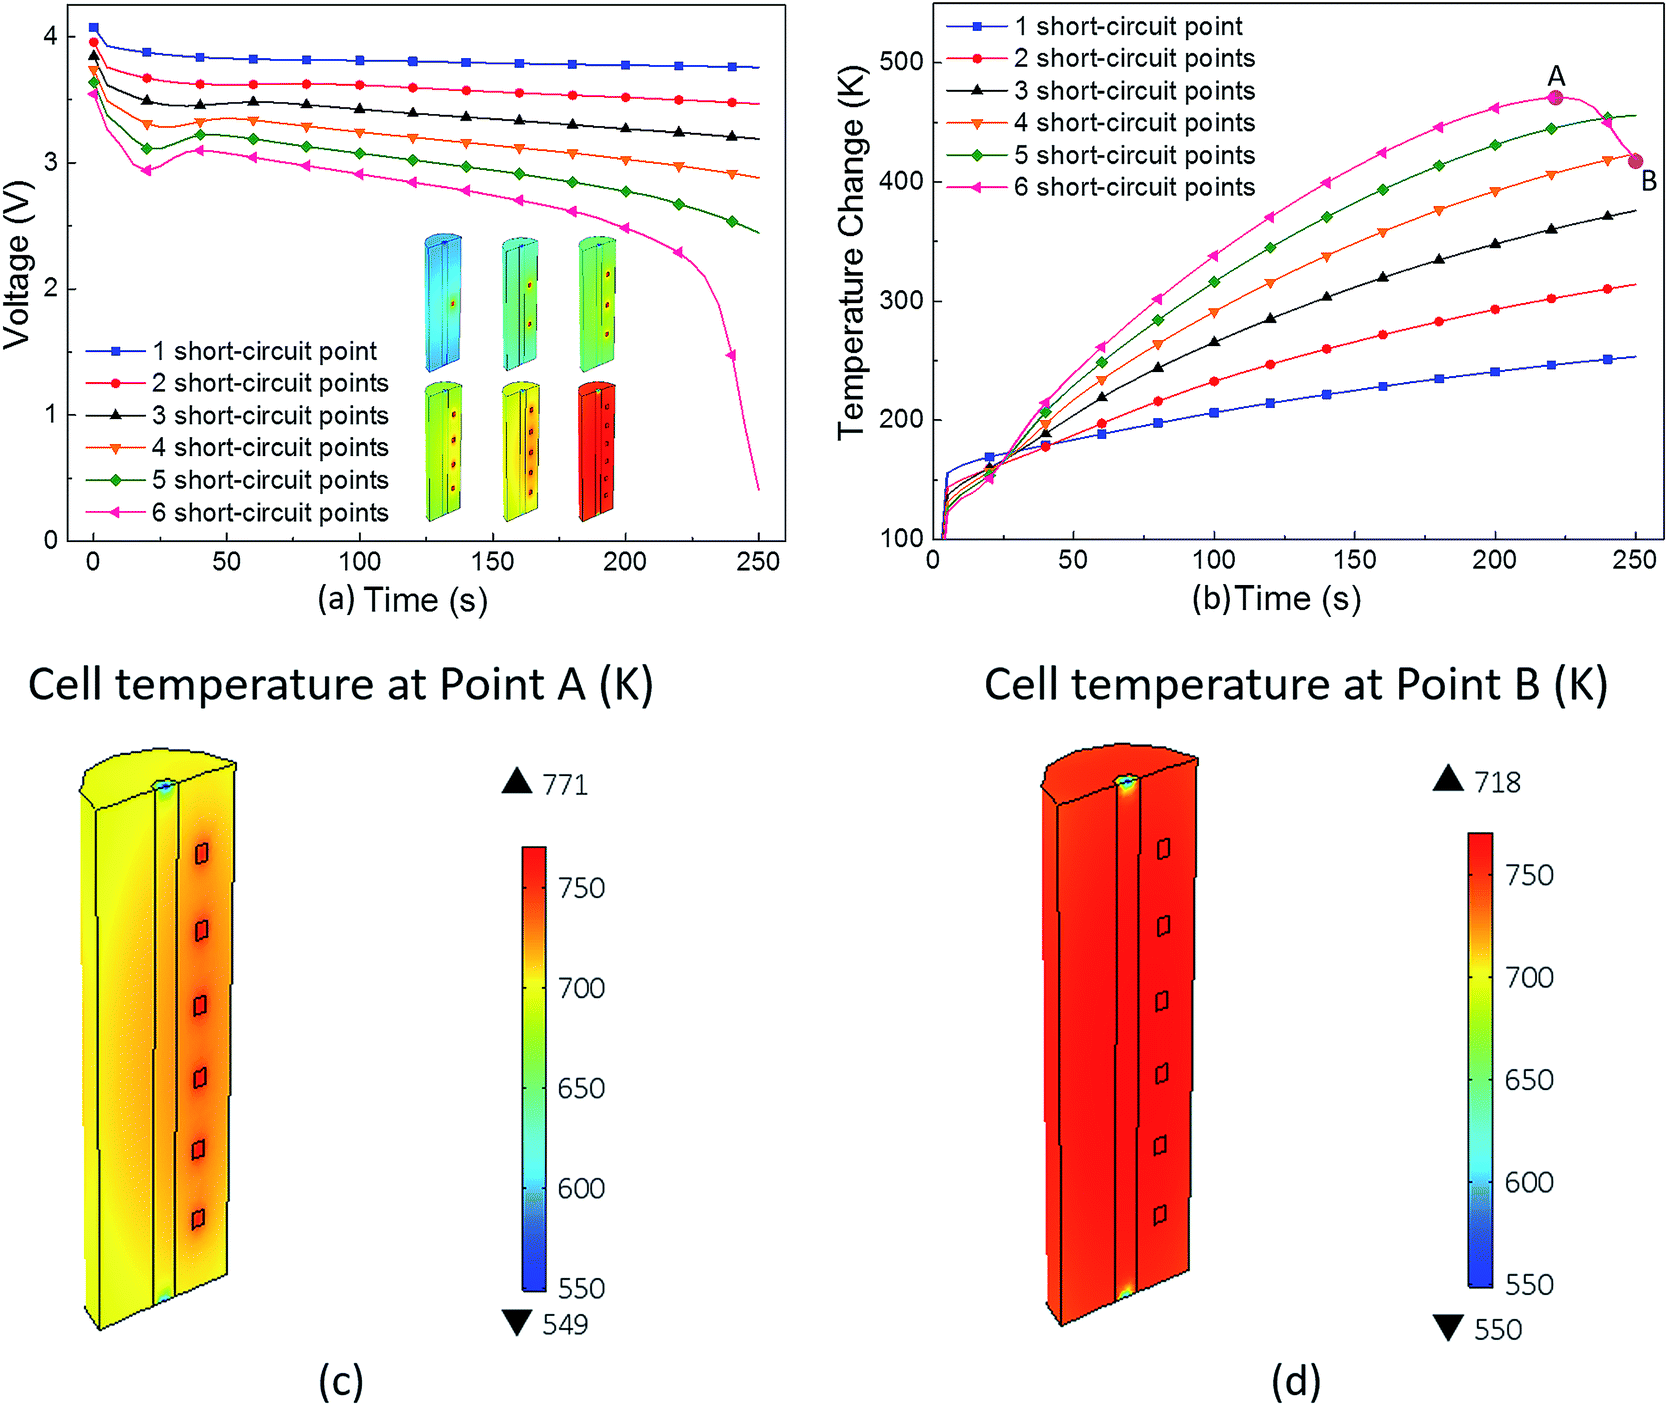 | ||
| Fig. 9 (a) Voltage and (b) temperature curves in the case of 1–6 short-circuit points; cell temperature at (c) 225 s and (d) 250 s during the 6-point short-circuit process. | ||
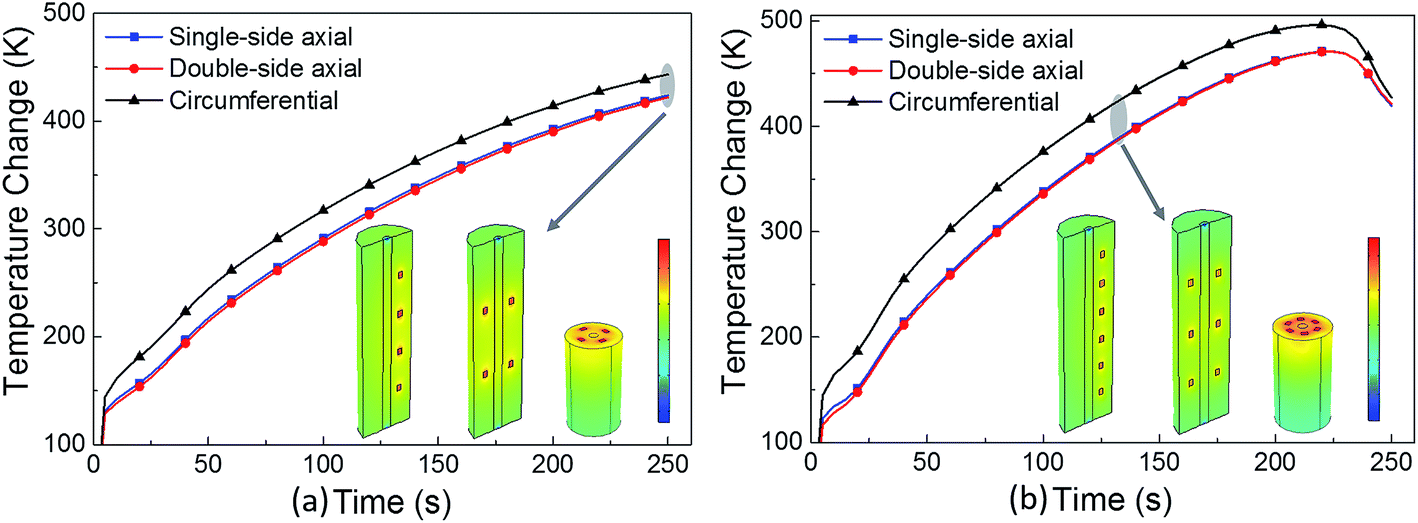 | ||
| Fig. 10 Temperature curves of a (a) 4-point short-circuit, and (b) 6-point short-circuit under different short-circuit positions. | ||
Under the one-point short-circuit condition, the position of the short-circuit spot had no effect on the short-circuit voltage and temperature; however, with the increasing number of short-circuit points, a general rule was elucidated that temperature changes most drastically in the circumferential distribution mode. This is because when the short-circuit points are in circumferential arrangement, the heat sources are more concentrated, which causes problems in heat dissipation.
As shown in Fig. 11, the maximum battery temperature rises as Ls increases under the 1-point and 2-point short-circuit conditions, and this is explained by the low thermal conductivity of the separator. On the other hand, in the case of a 4-point short-circuit, the temperature reduces with the increase of Ls. This is a strong evidence to confirm the explanation for Fig. 4 since the addition of more short-circuit points means an increase in the quantity of heat sources, and consequently, it will definitely increase the temperature in spite of the separator's low thermal conductivity.
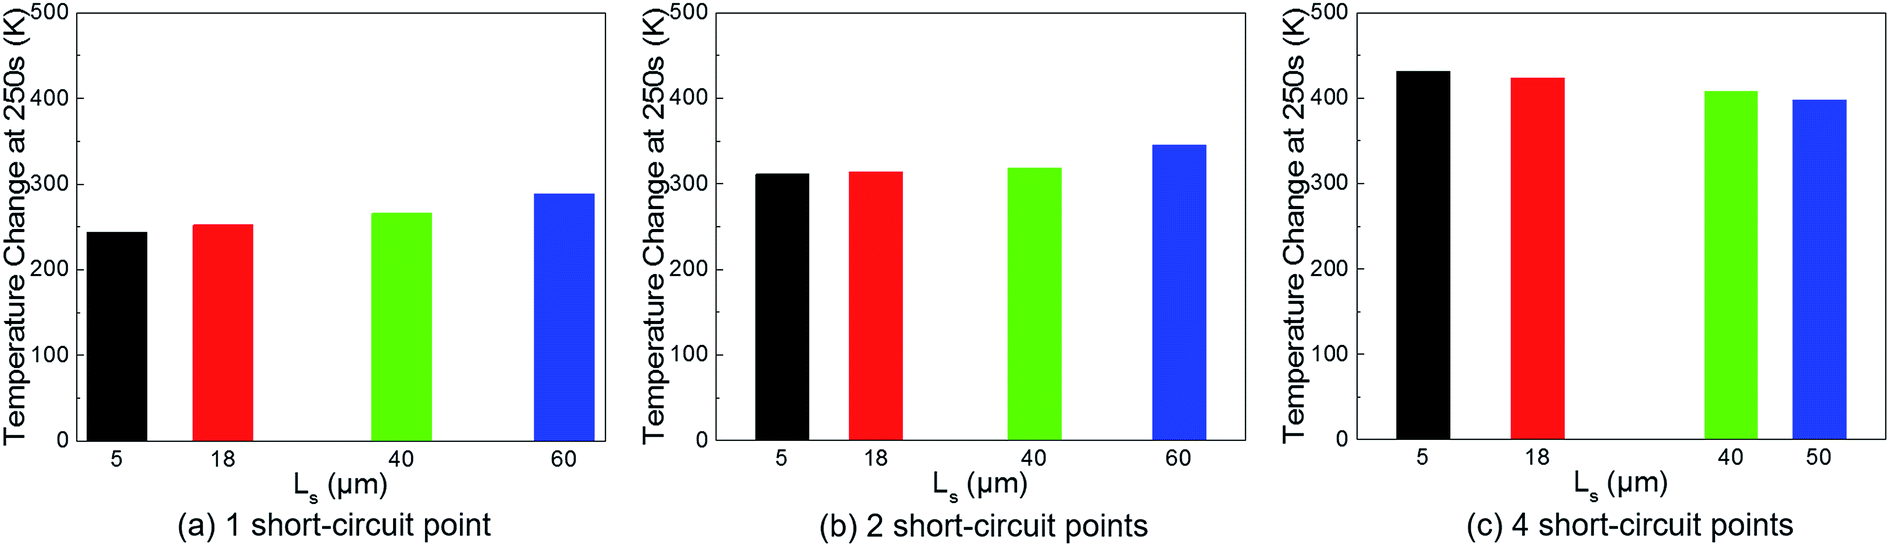 | ||
| Fig. 11 Temperature change with the increase of separator thickness in the case of 1 short-circuit point, 2 short-circuit points, and 4 short-circuit points. | ||
When the number of short-circuit points is few, e.g. the one-point case, epsln has little influence on the voltage and temperature, whereas under the four-point short-circuit condition, a very low volume fraction, e.g. epsln = 0.1, has a much more evident effect on the voltage and temperature. As shown in Fig. 12, compared with the simulation result under the condition of the original electrolyte phase volume fraction of 0.444 in the negative electrode, the voltage drop decreases by 0.65 V and the temperature rise decreases by 70 K at 250 s after the occurrence of a 4-point short-circuit when epsln is reduced to 0.1. It can be concluded that the low porosity of the negative electrode has a greater influence on a multi-point short-circuit as the number of short-circuit points increases.
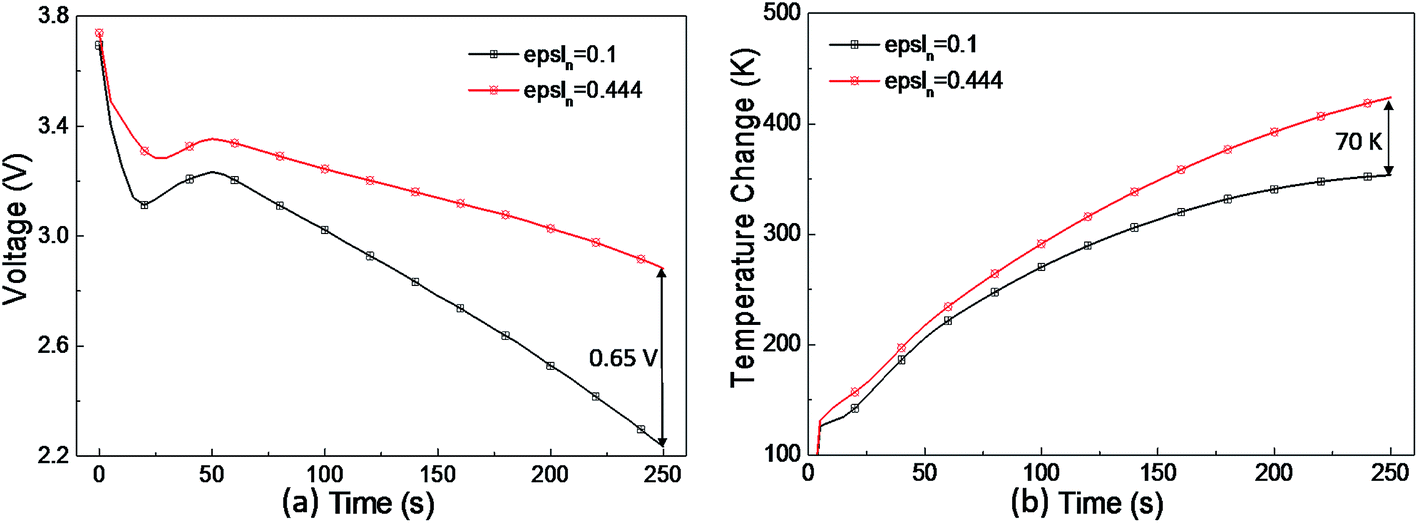 | ||
| Fig. 12 Impact on the (a) voltage and (b) temperature curves when the negative electrode electrolyte phase volume fraction is 0.1 in the case of a 4-point short-circuit. | ||
5. Conclusion
Design parameters may have an important engineering indication on a safe LIB design. In this study, an integrated electrochemical-thermal LIB model was constructed for short-circuit analysis and a parametric study on the porosity and thickness of the separator, cathode, and anode was conducted in the case of one-point and multi-point short-circuits. The main influences on the short-circuit voltage and temperature were summarized and may provide useful guidance to a safer LIB design. The porosity and thickness of the separator are the key factors in battery's internal resistance and the selection of the separator should be considered due to the low thermal conductivity. Considering the two-phase conduction of lithium in both electrodes, the porosity is supposed to be moderately designed to maintain a stable voltage during a short-circuit. As for the electrode thickness, the increase of thickness will bring benefits to the maintenance of short-circuit voltage. However, it will cause a large increase in temperature because of the storage capacity of lithium if the anode thickness is too large. It was found that the impact of the cathode is much greater than that of the anode; thus, it is wise to pay more attention to the selection and design of proper cathode parameters when aiming for a safer LIB.Furthermore, the multi-point short-circuit phenomenon was also studied. Under the one-point short-circuit condition, the position of the short-circuit point has no influence on the short-circuit. However, under the multi-point short-circuit condition, different positions of short-circuit spots will have a much greater impact on the temperature distribution. In addition, the low porosity of the negative electrode affects multi-point short-circuit more than one-point short-circuit.
These results may help to understand the mechanism of an internal short-circuit and lay a foundation for design parameter selection (the porosity and thickness of the cathode, anode, and separator) for a safer LIB, especially in the short-circuit situation.
6. Nomenclature
| a | Specific surface area (m2 m−3) |
| qshort | Joule heat of short-circuit (W m−3) |
| cs | Lithium concentration in the electrode particles (mol m−3) |
| r | Electrode particle radial direction |
| cl | Lithium ions concentration in the electrolyte (mol m−3) |
| R | Gas constant (8.314 J mol−1 K−1) |
| cs,l | Lithium concentration in the interface between electrode particles and electrolyte (mol m−3) |
| Rf | Failure area radius of short-circuit point |
| cp | Heat capacity (J kg−1 K−1) |
| t | Time (s) |
| D | Diffusion coefficient (m2 s−1) |
| t+ | Li+ transference number |
| Dl | Diffusion coefficient in the electrolyte (m2 s−1) |
| T | Temperature (K) |
| Deffl | Effective diffusion coefficient in the electrolyte (m2 s−1) |
| Tamb | Ambient temperature (K) |
| epsln | Electrolyte phase volume fraction of negative electrode |
| U | Open-circuit voltage (V) |
| epsls | Electrolyte phase volume fraction of separator |
| V+s | Positive terminal potential (V) |
| epslp | Electrolyte phase volume fraction of positive electrode |
| V−s | Negative terminal potential (V) |
| F | Faraday's constant (C mol−1) |
| x | x direction in coordinate |
| h | Heat transfer coefficient (W m−2 K−1) |
| ϕs | Electrode potential (V) |
| is | Electrode current density (A m−2) |
| ϕl | Electrolyte potential (V) |
| il | Electrolyte current density (A m−2) |
| ϕ+s | Positive terminal potential (V) |
| ishort | Short-circuit current density (A m−2) |
| εs | Solid phase volume fraction in electrodes |
| jLi | Electrochemical reaction rate (A m−2) |
| εl | Electrolyte phase volume fraction |
| k | Reaction rate constant |
| κ | Thermal conductivity (W m−1 K−1) |
| Ln | Thickness of the negative electrode (μm) |
| κl | Electrical conductivity in the electrolyte (Ω−1 m−1) |
| Lp | Thickness of the positive electrode (μm) |
| κeffl | Effective electrical conductivity of lithium-ions in the electrolyte (Ω−1 m−1) |
| Ls | Thickness of the separator (μm) |
| σ | Electrical conductivity (Ω−1 m−1) |
| n | x direction, y direction, and z direction in 3D coordinates |
| σeffs | Effective electrical conductivity of lithium in the electrode (Ω−1 m−1) |
| nf | Number of failure separator layers |
| σshort | Electrical conductivity at the short-circuit spot (Ω−1 m−1) |
| p | Bruggeman factor |
| ηs | Overpotential (V) |
| q | Rate of heat generation (W m−3) |
| ρ | Density (kg m−3) |
| qh | Heat generation rate of electrochemical reaction (W m−3) |
Acknowledgements
This work was financially supported by the Fundamental Research Funds for the Central Universities, Beihang University, the startup fund for “Zhuoyue 100” titled professor, Beihang University, Opening fund of State Key Laboratory of Nonlinear Mechanics, Institute of Mechanics, Chinese Academy of Sciences, and the financial support from Natural Science Foundation of China (No. 11402012).References
- D. Deng, M. G. Kim, J. Y. Lee and J. Cho, Energy Environ. Sci., 2009, 2, 818–837 CAS.
- M. Armand and J. M. Tarascon, Nature, 2008, 451, 652–657 CrossRef CAS PubMed.
- T. M. Bandhauer, S. Garimella and T. F. Fuller, J. Electrochem. Soc, 2011, 158, R1–R25 CrossRef CAS.
- J. B. Goodenough and Y. Kim, Chem. Mater., 2010, 22, 587–603 CrossRef CAS.
- W. Zhao, G. Luo and C. Y. Wang, J. Electrochem. Soc., 2015, 162, A1352–A1364 CrossRef CAS.
- C. Y. Jhu, Y. W. Wang, C. M. Shu, J. C. Chang and H. C. Wu, J. Hazard. Mater., 2011, 192, 99–107 CAS.
- R. Zhao, J. Liu and J. Gu, Appl. Energy, 2016, 173, 29–39 CrossRef CAS.
- Q. Wang, P. Ping, X. Zhao, G. Chu, J. Sun and C. Chen, J. Power Sources, 2012, 208, 210–224 CrossRef CAS.
- S. Santhanagopalan, P. Ramadass and J. Zhang, J. Power Sources, 2009, 194, 550–557 CrossRef CAS.
- W. Fang, P. Ramadass and Z. Zhang, J. Power Sources, 2014, 248, 1090–1098 CrossRef CAS.
- E. Sahraei, M. Kahn, J. Meier and T. Wierzbicki, RSC Adv., 2015, 5, 80369–80380 RSC.
- J. Xu, B. Liu, L. Wang and S. Shang, Eng. Failure Anal., 2015, 53, 97–110 CrossRef CAS.
- J. Xu, B. Liu and D. Hu, Sci. Rep., 2016, 6, 21829 CrossRef CAS PubMed.
- C. Zhang, S. Santhanagopalan, M. A. Sprague and A. A. Pesaran, J. Power Sources, 2015, 290, 102–113 CrossRef CAS.
- K.-C. Chiu, C.-H. Lin, S.-F. Yeh, Y.-H. Lin and K.-C. Chen, J. Power Sources, 2014, 251, 254–263 CrossRef CAS.
- M. Doyle, J. Newman, A. S. Gozdz, C. N. Schmutz and J.-M. Tarascon, J. Electrochem. Soc., 1996, 143, 1890–1903 CrossRef.
- J. Xu, B. Liu, X. Wang and D. Hu, Appl. Energy, 2016, 172, 180–189 CrossRef CAS.
- P. Arora, M. Doyle, J. Newman, A. Gozdz and R. White, J. Power Sources, 2000, 88, 219–231 CrossRef CAS.
- Y. Ye, Y. Shi, N. Cai, J. Lee and X. He, J. Power Sources, 2012, 199, 227–238 CrossRef CAS.
- C. H. Lee, S. J. Bae and M. Jang, J. Power Sources, 2015, 293, 498–510 CrossRef CAS.
- J. Xu, L. Wang, J. Guan and S. Yin, Mater. Des., 2016, 95, 319–328 CrossRef CAS.
- N. Rey-Raap, M.-L. C. Piedboeuf, A. Arenillas, J. A. Menéndez, A. F. Léonard and N. Job, Mater. Des., 2016, 109, 282–288 CrossRef CAS.
- A. D. Roberts, X. Li and H. Zhang, Chem. Soc. Rev., 2014, 43, 4341–4356 RSC.
- K. X. Wang, X. H. Li and J. S. Chen, Adv. Mater., 2015, 27, 527–545 CrossRef CAS PubMed.
- W. Fang, O. J. Kwon and C.-Y. Wang, Int. J. Energy Res., 2010, 34, 107–115 CrossRef CAS.
- X. Feng, C. Weng, M. Ouyang and J. Sun, Appl. Energy, 2016, 161, 168–180 CrossRef.
- C. Zhang, S. Santhanagopalan, M. A. Sprague and A. A. Pesaran, J. Power Sources, 2015, 298, 309–321 CrossRef CAS.
| This journal is © The Royal Society of Chemistry 2017 |