 Open Access Article
Creative Commons Attribution 3.0 Unported Licence
Simple and tunable surface coatings via polydopamine for modulating pharmacokinetics, cell uptake and biodistribution of polymeric nanoparticles†
Jingshuo Liua,
Hui Xub,
Xing Tangb,
Jinghua Xub,
Zeng Jinc,
Hui Lib,
Shihan Wanga,
Jingxin Goub and
Xiangqun Jin *a
*a
aDepartment of Pharmaceutics, College of Pharmacy Sciences, Jilin University, Changchun 130021, Jilin, China. E-mail: jinxq@jlu.edu.cn
bDepartment of Pharmaceutics, Shenyang Pharmaceutical University, Shenyang 110016, China
cDepartment of Pharmacology, University of Alberta, Edmonton, AB, Canada
First published on 10th March 2017
Abstract
Nanosystems often require different surface coatings to improve their biocompatibility, circulating time, the intracellular uptake and reduce toxic side effects. A pre-understanding and a simple controlling of the surface coatings' interactions with biological systems are of vital importance. Herein, we successfully modified model nanoparticles (NPs) with three surface modifiers: bovine serum albumin (BSA), poly-L-lysine (PLL) and polyethylene glycol (PEG) simply and uniformly via polydopamine (pD). Following, the serum stability, drug release profile, pharmacokinetics, in vivo biodistribution and interactions with tumor cells of these modified nanoparticles were systematically evaluated for further applications. According to the in vitro and in vivo results, BSA coated NPs could inhibit the plasma proteins' adsorption thus prolong their circulation time to some extent. In addition, the BSA shell showed good biocompatibility, non-toxicity and a delayed drug release. Interestingly, PLL coated NPs exhibited higher and pH-dependent intracellular uptake and antitumor activity in an acidic tumor micro environment. Nonetheless, the PLL coating did not exhibit particularly high toxicity due to its low positive charge density. PEG coated NPs displayed good pharmacokinetic profiles as expected. In the light of the successful application of the above pD–surface modifier compound shells (pD–BSA, pD–PLL, pD–PEG), diverse particles can be modified to selectively optimize their nature and achieve the goal such as improved pharmacokinetic profiles, enhanced cellular internalization ability and lower toxicity. This strategy that can selectively alter the biological fate of NPs simply by tunable coatings provides great potential for controllable drug delivery systems for cancer and other therapeutic or diagnostic applications.
1. Introduction
The nature of a particle's surface significantly affects its behavior and fate in the physiological environment.1,2 Generally, surface modification is an excellent solution to overcome limitations due to the nature of a particle's surface. Hence, nanosystems such as polymeric NPs, mesoporous silica nanoparticles (MSNs), quantum dots (QDs), gold nanoparticle (AuNPs) often require different surface modifications to improve their biocompatibility, the ability to interact with cells, circulating time, and reduce their toxic side effects.3 A lot of work and research in this area have been reported. For example, polyethylene glycol (PEG) coverage is commonly used to prolong circulation time in the circulatory system by inhibiting recognition and phagocytosis by the reticuloendothelial system.4,5 In addition, bovine serum albumin and other biological macromolecules are commonly used to reduce platelet adhesion and the toxicity of particles. Luo et al.6 reported the fabrication of MSNs/protein nanocomposites with natural proteins of BSA and gelatin (Gel) as end-caps of MSNs by using succinic anhydride as an intermediate linker to reduce their immunotoxicity. Furthermore, positively charged materials can be used to interact with cells. Choi et al.7 developed poly(allylamine hydrochloride) (PAH)-coated nanoparticles (PAH–BSA NPs) through electrostatic interactions to promote the cell uptake abilities in the MCF-7 and A549 cells.Nanoparticles are safe and effective to use only when their biological response is comprehended and capable to be controlled. In this study, we modulated the biological response of model NPs with BSA, PLL and PEG coating to achieve the goal such as improving pharmacokinetic profiles, enhancing their cellular internalization ability and reducing toxicity. PLGA nanoparticle was chosen due to its ability to maintain therapeutic drug levels for sustained periods of time. Larotaxel (LTX), as a model drug, is mainly used as an anticancer agent for the treatment of a variety of malignancies, especially for breast and lung cancer.8 It is a derivative of taxane which has a much lower affinity for P-glycoprotein than docetaxel and paclitaxel.9 The commonly used “stealth” coverage of PEG can decrease the rate of opsonization, providing more efficient transport. BSA was chosen by virtue of its good biocompatibility, non toxicity and competition with other plasma proteins.10 PLL is a macromolecular polymer composed of amino acids with lower positive charge density but high uptake efficiency.11
According to previous studies, surface modification methods can be divided into two categories (i) chemical conjugation. The lack of reactive functional groups on the particle's surface necessitates activation of the NPs surface with reactive linkers12,13 or coupling agents,14,15 which is inevitably followed by exhaustive purification processes to remove catalysts and excess reactants. Thus complex chemical reactions on the surface will affect the stability of the preparations and easily lead to drug leakage. (ii) Physical adsorption via electrostatic adsorption represented by layer by layer assembly, hydrogen bonding, π–π bonds.16–18 These preparations are usually sensitive to the solutions' pH, ionic strength, concentration of coating material and are even affected by the washing and drying steps.19 As a result, their formulation structure could be unstable due to easier detachment of the outer layer, both under in vitro and in vivo conditions.
In this context, we adopted a simple and uniform protocol based on dopamine polymerization to eliminate the complexity and inefficiency involved in traditional modification processes. Dopamine polymerization product-polydopamine (pD) has a unique ability to deposit on virtually any substrates only by a simple immersion of particles in an aqueous dopamine solution, which was buffered to pH 8–8.5.20,21 Subsequently, amine or thiol-containing molecules (BSA, PLL and mPEG5k–NH2) can be conjugated onto the pD layer via simple mixing at room temperature.22 Importantly, any harsh reaction conditions or complicated equipment was not required. Moreover, it is widely accepted that polydopamine has good biocompatibility and biodegradation.23–25
To our knowledge, the pD–BSA, pD–PLL and pD–PEG shells were successfully applied to polymeric NPs to optimize their nature and eventually improved their pharmacokinetic profiles, enhanced the cellular internalization and pH-dependent antitumor activity and delayed drug release. The resulted nanoparticles BSA–pD–PLGA and PLL–pD–PLGA have not been established as drug delivery system in cancer treatment before. More importantly, a uniform and facile strategy via polydopamine for the design of a controllable drug delivery system for cancer treatment was established. This strategy can selectively modulate the biological response of NPs such as pharmacokinetic profiles, intracellular uptake and toxicities by decorating nanoparticles with pre-understood shells, and accordingly, a wide variety of NPs could be modified to optimize their biological fate more conveniently. This study extends the application of polydopamine in drug delivery system meanwhile providing greater improvement for future design of controllable drug delivery system for cancer and other therapeutic or diagnostic applications.
2. Materials and methods
2.1 Materials
Poly(lactic-co-glycolic acid), PLGA (LA![[thin space (1/6-em)]](https://www.rsc.org/images/entities/char_2009.gif) :
:![[thin space (1/6-em)]](https://www.rsc.org/images/entities/char_2009.gif) GA = 85
GA = 85![[thin space (1/6-em)]](https://www.rsc.org/images/entities/char_2009.gif) :
:![[thin space (1/6-em)]](https://www.rsc.org/images/entities/char_2009.gif) 15, viscosity: 1.0 dL g−1, molecular weight: 127 kDa) was kindly provided by the Changchun Institute of Applied Chemistry, Chinese Academy of Sciences (Changchun, China). Vitamin E TPGS 1000 succinate (C33O5H54) was purchased from Eastman Chemical Company (TN, USA). Dopamine hydrochloride and bovine serum albumin (Aladdin Agent Co., Shanghai, P. R. China), mPEG–NH2 (Mw: 5 kDa) (Shanghai Seebio Biological Technology Co., Shanghai, P. R. China), and poly-L-lysine (PLL, purity: 99.0% Mw:3.6–4.2 kDa) were obtained as a gift from Bainafo Biological Engineering Co., Ltd (Zhengzhou, People's Republic of China). Coumarin-6 and 3-(4,5-dimethylthiazol-2-yl)-2,5-diphenyltetrazolium bromide (MTT) were purchased from Sigma-Aldrich (St. Louis, MO, USA). LTX (C45H53NO14, purity: 99.9%) was Lab-made by the Fudan University in Shanghai. MCF-7 and A549 cell lines were acquired from the Type Culture Collection of the Chinese Academy of Sciences (Shanghai, China). Dialysis bags (MWCO: 14 kDa) were purchased from Ruida henghui Co., Ltd in Beijing. Millipore ultrafiltration tube (Amicon® Ultra Millipore USA). All the reagents used in this study were of the highest commercial grade available.
15, viscosity: 1.0 dL g−1, molecular weight: 127 kDa) was kindly provided by the Changchun Institute of Applied Chemistry, Chinese Academy of Sciences (Changchun, China). Vitamin E TPGS 1000 succinate (C33O5H54) was purchased from Eastman Chemical Company (TN, USA). Dopamine hydrochloride and bovine serum albumin (Aladdin Agent Co., Shanghai, P. R. China), mPEG–NH2 (Mw: 5 kDa) (Shanghai Seebio Biological Technology Co., Shanghai, P. R. China), and poly-L-lysine (PLL, purity: 99.0% Mw:3.6–4.2 kDa) were obtained as a gift from Bainafo Biological Engineering Co., Ltd (Zhengzhou, People's Republic of China). Coumarin-6 and 3-(4,5-dimethylthiazol-2-yl)-2,5-diphenyltetrazolium bromide (MTT) were purchased from Sigma-Aldrich (St. Louis, MO, USA). LTX (C45H53NO14, purity: 99.9%) was Lab-made by the Fudan University in Shanghai. MCF-7 and A549 cell lines were acquired from the Type Culture Collection of the Chinese Academy of Sciences (Shanghai, China). Dialysis bags (MWCO: 14 kDa) were purchased from Ruida henghui Co., Ltd in Beijing. Millipore ultrafiltration tube (Amicon® Ultra Millipore USA). All the reagents used in this study were of the highest commercial grade available.
2.2 Preparation of LTX or coumarin-6-loaded PLGA NPs
The LTX-loaded PLGA nanoparticles were prepared by a classical nanoprecipitation technique.26,27 Briefly, 9.5 mg of LTX and 56 mg of PLGA were dissolved in 8 mL of acetone. Then the oil organic phase was injected into a 12 mL aqueous solution containing 0.03% (w/v) TPGS as a surfactant using a 1 mL injector under stirring within 15 min. After magnetic stirring for 3 h at room temperature to remove acetone, the suspension was centrifuged at 5000 rpm for 5 min to remove a small amount of precipitate including dirt and unencapsulated drug. The NPs suspensions were prepared for polydopamine coating as described in the following sections. Fluorescent coumarin-6-loaded NPs were fabricated by the same protocol, with the only exception that the LTX was replaced by coumarin-6.2.3 Prime-coating with polydopamine
Polydopamine-coated NPs (pD–PLGA NPs) were synthesized by incubating NPs in 1 mg mL−1 of dopamine hydrochloride dissolved in a 10 mM tris buffer (pH 8.5) for 3.5 h at room temperature with stirring. After that, the pD coating process was stopped and the free dopamine and small pD aggregates in solution were removed by ultrafiltration method. This washing procedure was monitored by ultraviolet spectrophotometer (UV) to guarantee the purity of pD–PLGA NPs. The obtained NPs were stored under 4 °C for further modification.2.4 Conjugation of different surface modifiers to pD–PLGA NPs
Different surface modification materials were grafted to the surface of pD–PLGA NPs via reaction between the terminal amine groups and the catechol/quinine groups of the polydopamine coating. In brief, pD–PLGA NPs were resuspended in PBS (10 mM, pH 8.1) containing mPEG5k–NH2, BSA and PLL. The final concentrations of mPEG5k–NH2, BSA and PLL were 1.4%, 1.5% and 2% and the final concentrations of the corresponding NPs were 1.2, 2 and 2.5 mg mL−1 respectively. After 2.5 h of incubation at room temperature with stirring, the resulting NPs were centrifuged at 20![[thin space (1/6-em)]](https://www.rsc.org/images/entities/char_2009.gif) 000 rpm for 30 min at 4 °C and washed three times with deionized water to remove unreacted surface modification materials. The blank (without drug) nanoparticles were prepared by the same procedure, except that only the polymers were dissolved in oil phase. The sterilized nanoparticles were fabricated in the super-clean bench under sterile conditions using a 0.22 μm filter membrane to remove bacteria.
000 rpm for 30 min at 4 °C and washed three times with deionized water to remove unreacted surface modification materials. The blank (without drug) nanoparticles were prepared by the same procedure, except that only the polymers were dissolved in oil phase. The sterilized nanoparticles were fabricated in the super-clean bench under sterile conditions using a 0.22 μm filter membrane to remove bacteria.
2.5 Particle size and zeta potential
The particle mean size, size distribution and zeta potential of the preformed NPs were measured by the Malvern Mastersizer 2000 analyzer (Zetasizer Nano ZS90, Malvern Instruments Ltd, UK). Before measurements, the freshly prepared particles were diluted and the final concentration was adjusted to 0.2 mg mL−1.2.6 Surface morphology
The morphology of the NPs was examined by Transmission Electron Microscope (TEM). Samples for TEM observation were prepared by dropping diluted sample solution (400 μg mL−1 of polymer) onto a copper grid coated with a carbon membrane. Excess solution was wiped away with filter paper. After the grid was dried, it was dyed with 2% phosphotungstic acid and allowed to dry for a further 20 minutes. Then, the samples were examined using a Hitachi H-600 TEM operated at an accelerating voltage of 100 kV.2.7 X-ray photoelectron spectroscopy (XPS) analysis
X-ray photoelectron spectroscopy (XPS, Kratos Ltd, UK) was performed by the AXIS Ultra DLD spectrometer using a monochromatic Al Kα X-ray radiation. Survey and high-resolution spectra were collected at fixed analyzer pass energy respectively. Binding energy values were referenced to the Fermi edge, and charge correction was performed setting the C 1s peak at 290.5 eV.2.8 Fourier transform infrared (FTIR) spectroscopy and 1H-NMR analysis
All samples were analyzed by FTIR Bruker Tensor 27 spectrometer using KBr disks. The transmittance spectra were recorded in the range of 500–4000 cm−1. 1H-NMR spectra of all samples in D2O were obtained using a Bruker AV-600 spectrometer at 600 M.2.9 Drug loading content (DLC)
Drug loading content (DLC) of NPs was determined by RP-HPLC (Hitachi, L-2130 pump, L-2400UV detector, L-2200 auto-sampler and L-2300 column oven). To be specific, weighed lyophilized nanoparticles were dissolved in 1 mL of dichloromethane (DCM) in a volumetric flask under ultrasound conditions. A nitrogen stream was introduced to evaporate DCM for about 15 min and added mobile phase to constant volume. Following, a clear solution was obtained though a 0.45 μm filter membrane for HPLC analysis. A reverse-phase C-18 column (200 × 4.6 mm, 5 μm, C18, CenturySIL, China) was used. The mobile phase was a 35![[thin space (1/6-em)]](https://www.rsc.org/images/entities/char_2009.gif) :
:![[thin space (1/6-em)]](https://www.rsc.org/images/entities/char_2009.gif) 65 (v/v) mixture of water and acetonitrile. The flow rate and column temperature were set at 1.0 mL min−1 and 25 °C, respectively. LTX was detected by a UV/VIS detector at 230 nm. Measurements were carried out three times for each batch. The drug DLC of LTX-loaded NPs was calculated by the following equation:
65 (v/v) mixture of water and acetonitrile. The flow rate and column temperature were set at 1.0 mL min−1 and 25 °C, respectively. LTX was detected by a UV/VIS detector at 230 nm. Measurements were carried out three times for each batch. The drug DLC of LTX-loaded NPs was calculated by the following equation:2.10 Serum stability
Serum stability of NPs with different surface coatings were investigated by measuring the changes of particle size after incubation in 10% FBS. Particle sizes were recorded after various incubation time intervals at 37 °C.2.11 Drug release profiles in vitro
The dialysis method was used to analyze the in vitro release profiles of LTX loaded NPs. The drug-loaded preparations were placed into a regenerated cellulose dialysis bag (MWCO: 14 kDa), which were then put into a brown release bottle and immersed into 10 mL of release medium (pH 7.4 phosphate buffer solution containing 0.5% w/v Tween 80). Afterwards, the release bottle was transferred into an orbital water bath and shaken at 100 rpm at 37 ± 0.5 °C. 10 mL aliquots of release medium were collected at predetermined time intervals for HPLC analysis and replaced with fresh PBS solution. The analysis was similar with the measurement method of DLC. Each batch of experiments was performed in triplicate. The drug concentration was determined as described above. The accumulative release of drug from LTX-loaded NPs was plotted against time.2.12 Cell culture
In this study, the A549 and MCF-7 cell lines were cultured in RPMI 1640 medium and Dulbecco's Modified Eagle's Medium (DMEM) respectively, and both were supplemented with 10% fetal bovine serum and antibiotics (100 U mL−1 penicillin and streptomycin). Both types of cells were subcultured every 2–3 days and cultured in a 95% air humidified atmosphere containing 5% CO2 at 37 °C.![[thin space (1/6-em)]](https://www.rsc.org/images/entities/char_2009.gif) :
:![[thin space (1/6-em)]](https://www.rsc.org/images/entities/char_2009.gif) 10 v/v; detection wavelength: 444 nm; flow rate: 1.0 mL min−1; column temperature: 25 °C). After 2 h of incubation, the medium was removed and the cells were washed three times with cold PBS to terminate the cell uptake. After that, the cells were fixed with 4% paraformaldehyde solution and then the nuclei were stained with 4′,6′-diamidino-2-phenylindole (DAPI) for 10 min followed by washing with PBS (three times, 5 min per wash) to remove free DAPI. Finally, the coverslips placed on microscope slides were visualized and analyzed for further quantitative analysis by Image Pro Plus.
10 v/v; detection wavelength: 444 nm; flow rate: 1.0 mL min−1; column temperature: 25 °C). After 2 h of incubation, the medium was removed and the cells were washed three times with cold PBS to terminate the cell uptake. After that, the cells were fixed with 4% paraformaldehyde solution and then the nuclei were stained with 4′,6′-diamidino-2-phenylindole (DAPI) for 10 min followed by washing with PBS (three times, 5 min per wash) to remove free DAPI. Finally, the coverslips placed on microscope slides were visualized and analyzed for further quantitative analysis by Image Pro Plus.The drug concentration at which the growth of 50% of the cells was inhibited (IC50) in comparison with that of the control sample was calculated by curve fitting of the cell viability data.
2.13 Animals
All the protocols for animal experiments were approved by the Ethics Committee of Shenyang Pharmaceutical University and carried out under the Guide for Care and Use of Laboratory Animals. 4–5 weeks old male Sprague–Dawley (SD) rats (200 ± 10 g) and Kunming mice (18–22 g) were purchased from the Animal Center in Shenyang Pharmaceutical University.2.14 Pharmacokinetic study in rats
Male Sprague–Dawley (SD) rats weighting 200 ± 10 g (4–5 weeks old) were used for the in vivo pharmacokinetic studies. Twenty male rats were randomly divided into four groups and were administered intravenously with five LTX-loaded preparations at dosage of 4 mg kg−1 via the caudal vein. At 0.833, 0.25, 0.5, 1, 2, 4, 8, 12, 24 and 48 h after administration, 0.5 mL of blood samples were collected from the ophthalmic venous plexus into heparinized centrifuge tubes. Afterwards, the blood samples were centrifuged at 4000 rpm for 10 min to separate the plasma and stored at −20 °C until further treatment. These obtained plasma samples were processed as follows: 100 μL of plasma was mixed with 10 μL of internal standard solution (docetaxel, 5000 ng mL−1 in methanol) and then the samples were extracted by 2 mL methy-tert-butyl ether by vortexing for 10 min. After centrifugation at 4000 rpm for 10 min, 1.8 mL of the supernatant was collected and evaporated to dryness under nitrogen at 37 °C. The residue was dissolved in 100 μL of methanol and vortexed for 5 min, and then centrifuged at 12![[thin space (1/6-em)]](https://www.rsc.org/images/entities/char_2009.gif) 000 rpm for 10 min. At last, an aliquot of 5 μL supernatant was used for analysis by UPLC-ESI-MS/MS, according to the similar method described by previous study.9,28 Pharmacokinetic parameters were calculated using DAS 2.0 software.
000 rpm for 10 min. At last, an aliquot of 5 μL supernatant was used for analysis by UPLC-ESI-MS/MS, according to the similar method described by previous study.9,28 Pharmacokinetic parameters were calculated using DAS 2.0 software.
2.15 Ex vivo fluorescence imaging of DiR-loaded nanoparticles
To investigate the biodistribution of drug-loaded polymeric nanoparticles, DiR-loaded nanoparticles were prepared by replacing LTX with DiR (the near infrared fluorescent dye) and were injected into Kunming mice via the tail vein (corresponding DiR dose: 0.15 mg kg−1). The mice were then sacrificed at 0.25 h, 1 h and 4 h post-injection. The major organs (heart, liver, spleen, lung and kidney) were excised and washed three times with physiological saline. Ex vivo imaging signal of DiR in the main organs was monitored using an In Vivo Imaging System (In Vivo FX PRO, Carestream, USA; λex 720 nm, λem 790 nm). Dye accumulation and retention in organs were calculated by the instrument's software.2.16 Statistical methodology
All the experiments were repeated at least three times unless otherwise stated and all the results were expressed as mean ± standard deviation (SD). Statistically significant differences value was set as p < 0.05 based on student's t-test.3. Results and discussion
3.1 Preparation of NPs with different coatings mediated by polydopamine
The preparation of different coating NPs using pD as second modification platform is illustrated in Fig. 1. The final products were fabricated by the following two processes: (i) an oxidative polymerization of dopamine in the presence of oxygen as an oxidant. After 3.5 hours reaction at room temperature, NP suspensions turned dark, which indicated dopamine was successfully polymerized during prime coating of pD. (ii) Incorporation of BSA, PLL and PEG5k–NH2 in a weak alkaline solution. Any harsh reaction conditions or complicated equipment was not required. This novel and simple protocol based on dopamine polymerization could eliminate the complexity and inefficiency involved in traditional modification processes. In point of fact, this method has less limitation with respect to the chemical nature of the substrates and it is applicable to diverse nanocarriers irrespective of their surface chemical reactivity.29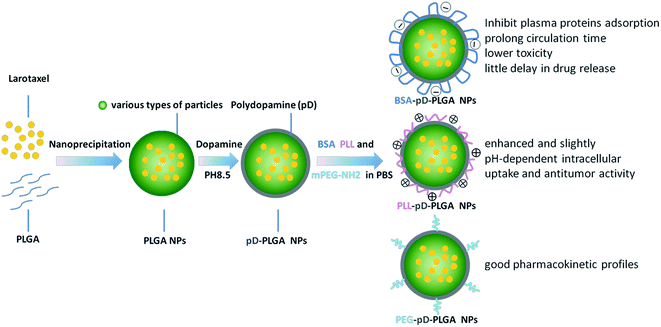 | ||
| Fig. 1 Schematic representation of the manufacturing process for different surface coatings conjugated to NPs. | ||
3.2 Characterization of NPs with different coatings mediated by polydopamine
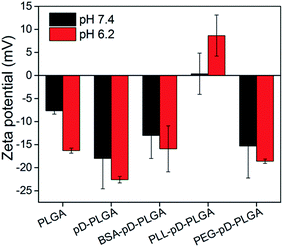
The size, size distribution and the zeta potential of NPs were measured by the Malvern Mastersizer 2000 and the data collected is presented in Table 1 and Fig. 2 respectively. All secondary modified NPs including BSA–pD–PLGA, PLL–pD–PLGA, PEG–pD–PLGA were larger than pD–PLGA NPs indicating successful conjugation of these modification materials. However, the increased sizes are different and not a lot, because the surface modification material only wrap up a small thin layer, for the reason that they were just reacting to the interface of NPs. It is worth noting that black polydopamine coating could absorb the laser light and thus affected the outcome of the measurement compared to naked NPs.30 This might lead to the result that the diameter of pD–PLGA NPs was not always larger than the naked PLGA NPs. Nonetheless, it was still feasible to compare the growth in the particle size among a series of pD modified dark NPs.| Properties, NPs | PLGA | pD–PLGA | PEG–pD–PLGA | PLL–pD–PLGA | BSA–pD–PLGA |
|---|---|---|---|---|---|
| Size (d, nm) | 117.0 ± 2.48 | 121.4 ± 2.94 | 128.9 ± 1.56 | 131.1 ± 0.14 | 128.4 ± 1.34 |
| PDI | 0.028 | 0.064 | 0.07 | 0.08 | 0.091 |
| Drug loading (wt%) | 13.87 ± 0.25 | 13.69 ± 0.039 | 11.98 ± 0.14 | 10.39 ± 0.04 | 9.27 ± 0.62 |
The negative surface charge of PLGA NPs might be ascribed to the presence of carboxylate on the surface of the PLGA segment. After surface modification with polydopamine, the zeta potential of pD–PLGA NPs remained negative. This could be attributed to the deprotonation of phenolic hydroxyl groups of the polydopamine coating.31 BSA–pD–PLGA presented a negative charge both at pH 7.4 and 6.2. Interestingly, PLL–pD–PLGA exhibited a relatively low positive charge density and showed a slightly pH-dependent charge profile from pH 7.4 to 6.2. The drug loading of secondary modified pD–PLGA NPs were lower than those of PLGA NPs and pD–PLGA NPs. The reason could probably be that (i) some of the drugs gradually leaked during the conjugation to the NPs. (ii) The incorporation of modified materials increased the proportion of medical materials when calculating DLC.
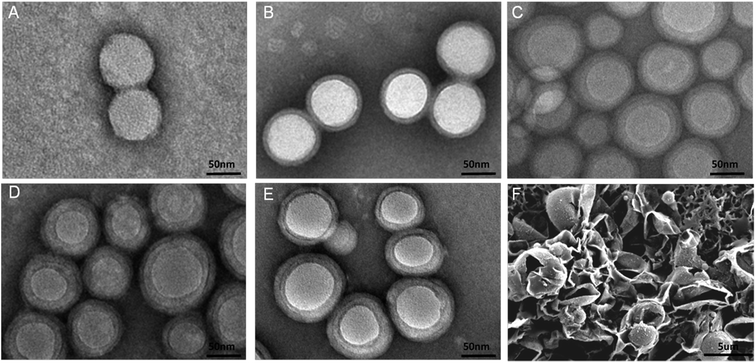
TEM were used in order to access the NPs surface morphology. As can be shown in Fig. 3A–E, the prepared NPs were spherical. Furthermore, significant morphology change could be obviously visualized after both prime and second layer modification suggesting that the outermost layers successfully deposited on the surface of NPs via polydopamine. The average size estimated from the TEM images was around 80 nm which was smaller than the size obtained from the Malvern Mastersizer. This difference might be ascribed to a tendency of shrink and collapse while the NPs turned to the dry state. The particles with a good uniformity were observed which was in accordance with the PDIs in Table 1. SEM image of polydopamine shells (Fig. 3F) was made by polydopamine modified PLGA microspheres which were treated with dichloromethane. The shells assumed a grapeskin-like shape due to the collapse of the thin shell layer and the hollow interior.
XPS analysis was employed to determine the surface chemical composition of NPs as shown in Table S1 (ESI†). The signal at the binding energy of ∼398 eV assigned to N 1s spectrum of XPS appeared on the surface of all polydopamine coated NPs except for the naked PLGA NPs, further verifying the presence of pD coating on naked NPs. Moreover, the nitrogen ratio (N/C, N/O) of BSA–pD–PLGA and PLL–pD–PLGA increased significantly than that of pD–PLGA NPs, indicating successful conjugation of BSA and PLL on the surface of pD–PLGA NPs. Meanwhile, the existence of S2p spectrum of XPS at the binding energy of ∼161 eV was sufficient to confirm the incorporation of the BSA layer. In addition, a slight increase in the O/C ratio of PEG–pD–PLGA compared to the pD NPs also implied the effective conjugation of PEG5k–NH2.
These successful modifications were further confirmed by 1H-NMR spectrum (ESI Fig. S1†) and FT-IR absorption spectrum (ESI Fig. S2†). In 1H-NMR spectrum, several new characteristic signals appeared after the modification of the outer layers. In the 1H-NMR spectrum of PEG–pD–PLGA NPs in D2O, the peak at 3.6 ppm was the characteristic signal of PEG,32 which confirmed the successful modification of PEG. The complex broad peaks present in BSA–pD–PLGA NPs were the result of a combined action by different types of hydrogen. The signal of PLL–pD–PLGA NPs at 1.3–1.9 ppm (–CH–CH2CH2CH2–), 3.2 ppm (–CH2–NH2) and 3.8 ppm (–CH–) confirmed the successful incorporation of PLL. In FT-IR spectrum, the absorption band at 1760 cm−1 was attributed to the carbonyl band of PLGA.33 The broad absorbance between 3600 and 3250 cm−1 of polydopamine modified NPs corresponded to the stretching vibrations of N–H/O–H.34 The peaks at 1654 and 1543 cm−1 (ESI Fig. S2D†) were assigned to the amide I bond and amide II bond in the BSA, respectively. In addition, characteristic absorption bands at 1673 cm−1 and 1566 cm−1 (ESI Fig. S2E†) were assigned to the C![[double bond, length as m-dash]](https://www.rsc.org/images/entities/char_e001.gif) O stretching vibration of acetyl group (amide I) and N–H bending vibration (amide II) in the PLL. In summary, the increase in particle size and the change of zeta potential, morphology, surface components, 1H-NMR spectrum and FT-IR absorption spectrum suggested that NPs with different coatings assisted by polydopamine were prepared successfully.
O stretching vibration of acetyl group (amide I) and N–H bending vibration (amide II) in the PLL. In summary, the increase in particle size and the change of zeta potential, morphology, surface components, 1H-NMR spectrum and FT-IR absorption spectrum suggested that NPs with different coatings assisted by polydopamine were prepared successfully.
3.3 Serum stability
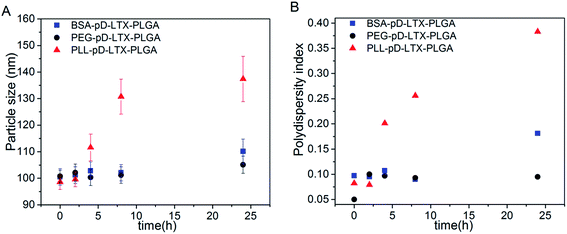
Nanoparticles co-incubation with 10% FBS was carried out to investigate the in vitro serum stability of the outer shell with the method reported previously.35,36 As data shown in Fig. 4, the particle size of PEG–pD–LTX–PLGA and BSA–pD–LTX–PLGA NPs increased 4.3% and 9.6% respectively, which was considerably lower than PLL–pD–LTX–PLGA NPs over 24 h incubation. In addition, the PDI of PEG–pD–LTX–PLGA and BSA–pD–LTX–PLGA remained almost unchanged, which indicated that they were stable under physiological conditions due to their lower affinity for plasma proteins. However, PLL–pD–LTX–PLGA exhibited a significant increase in particle size and PDI. From the results it can be seen that although PLL–pD–LTX–PLGA NPs displayed with a small amount of positive charge at pH 7.4, the adsorption of serum proteins on the surface were still prone to forming protein corona due to electrostatic interactions,37 while the negatively charged BSA would probably repel the proteins of the same charge.38–403.4 In vitro drug release
Overall, the NPs with different shells showed similar release profiles in Fig. 5. Particularly, it can be seen that BSA–pD–LTX–PLGA released 44% within 24 h while pD–LTX–PLGA released 53%. There was an obvious delay in drug release of BSA–pD–LTX–PLGA in contrast to pD–LTX–PLGA NPs (p < 0.05). In fact, it has been reported that the binding rate of larotaxel to plasma proteins is over 85.9%.9 Therefore, it is probable that after LTX was released from the PLGA matrix, it was subsequently bounded to the outer BSA shells for some delay. The binding might be due to the interactions between LTX and a few hydrophobic amino acids and hydrophobic segment involved in BSA shell. Moreover, the release behavior of PEG–pD–LTX–PLGA was similar to the pD–LTX–PLGA NPs (p > 0.05), hence indicating that the PEG shell negligibly interfered with the drug release. The pH changes to 6.3 did not have a significant effect on the release profiles of these NPs (data not shown here). Although less than 10 nm protein shell in this study was not enough to exhibit a tremendous delayed release, this result still brought us a tip that proteins shells like BSA or its analogue might delay the release of high protein-binding rate drugs like taxane.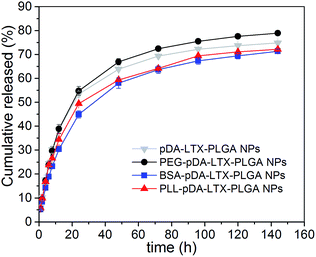 | ||
| Fig. 5 In vitro drug release profiles of pD–LTX–PLGA, PEG–pD–LTX–PLGA, BSA–pD–LTX–PLGA and PLL–pD–LTX–PLGA NPs. | ||
3.5 Cellular uptake
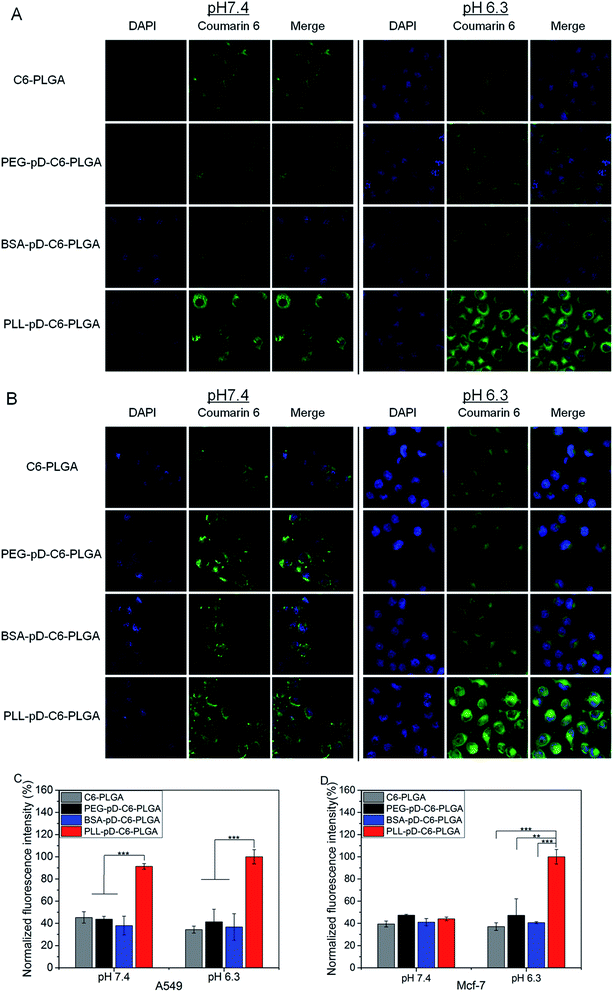
The extent of internalization of modified NPs was visualized under confocal laser scanning microscopy. Two types of cancer cell lines A549 and MCF-7 were selected for this assessment. In consideration of the slightly pH-dependent surface, this study was carried out at pH 7.4 and 6.3. Cellular uptake took place fast and the concentration of coumarin-6 for each formulation were fixed and unified. After two hours of incubation, most nanoparticles were distributed in the perinuclear region and a small part in the nucleus. At the end of the ingestion, the cell morphology of PLL–pD–PLGA NPs was observed to be significantly rounder compared with the other preparations at acidic pH.CLSM images and mean fluorescence intensity of NPs in A549 and MCF-7 cells are illustrated in Fig. 6A–D. The internalization of PLGA NPs, BSA–pD–PLGA NPs and PEG–pD–PLGA NPs stayed unchanged from neutral to acidic conditions for both cell types. However, the uptake of PLL–pD–PLGA NPs appears to be pH-dependent. For A549 cells, the internalization of PLL coated NPs was 2.0-fold more than that of naked PLGA NPs at neutral pH and was 2.9-fold more compared to the naked PLGA NPs at pH 6.3. Regarding the MCF-7 cells, the internalization of PLL coated NPs was 1.2-fold more than that of naked PLGA NPs at pH 7.4, and at acidic pH, the internalization of PLL coated NPs was 2.7-fold more than that of naked PLGA NPs and 2.5-fold more than BSA coated NPs. Overall, the results indicated that the cells ingested more positively charged NPs than negative ones, which is in accordance with the generally accepted concept that electrostatic interactions are enhanced between positive charged nanoparticles and the cell membrane.41,42 Moreover, these results reveals that the increase of positive charge from pH 7.4 to 6.3 for PLL coated NPs can improve internalization of NPs to some extent in the acidic tumor micro environment. And the extent of this improvement varies depending on the type of cell (MCF-7 obviously and A549 slightly here).
Indeed, the particle surfaces are inevitably decorated with many biomolecules especially a group of proteins from the culture medium during incubation. The positively charged NPs are easily bound with the negatively charged proteins in the serum-containing medium via electrostatic attraction. Therefore, the cells may “see” the decorated surfaces rather than the pristine ones in water. Although being compensated by the adsorbed proteins, positively charged particles were still easier to adsorb onto the negatively charged cell membranes. In fact, NPs maintained the intended advantage of pH-dependent surface in serum-containing medium. It can be speculated that the protein corona on the surface of the NPs might be loosely bound and therefore some portion of the original surface is exposed.37 An alternative reason is that the cells could recognize the proteins adsorbed on the particles' surface,43,44 which promoting their subsequent interaction with cells as reported for other cell types that already studied.36,45
PLL coated NPs exhibit excellent cellular uptake and slightly pH-dependent intracellular uptake which is beneficial to meet the treatment needs in the acidic tumor micro environment.
3.6 Cell viability
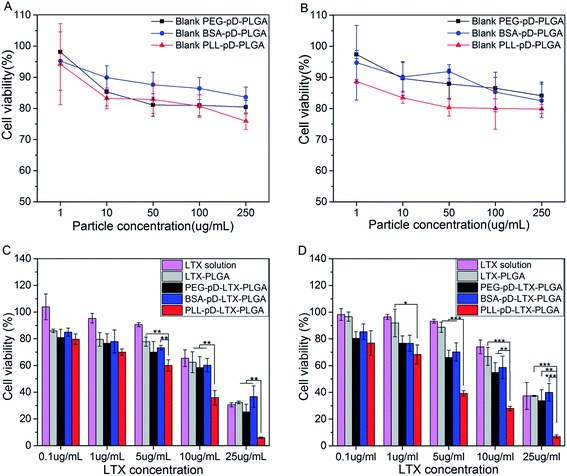
Blank NPs with different surface properties were employed to explore the toxicity of the coatings alone by cell survival assay. A549 cells were treated with blank NPs suspensions of a series of concentrations at pH 7.4 (Fig. 7A) and pH 6.3 (Fig. 7B). Higher cell viability of BSA coated NPs was observed, which demonstrated that BSA shell showed good biocompatibility and low toxicity at both pH. The lower cell viability of PLL coated NPs were observed revealing that PLL coating is a little more toxic than negatively charged shells. Even so, the PLL coated particles showed that over 80% of the cells survived even after 24 h coculture, only except the highest concentration of 250 μg mL−1 (75.8% at pH 7.4 and 79.8% at pH 6.3). The potential mechanism for the slight increase in cytotoxicity for blank PLL–pD–PLGA NPs is possibly attributed to the positive charge of the particle's surface which could disrupt the integrity of the cell membrane.46 Nevertheless, the toxicity of blank PLL–pD–PLGA NPs was reduced after the lower positive charge was compensated by absorbed protein molecules. Therefore, the PLL coating mediated by polydopamine has limited adverse effect which is beneficial for potential medical applications.To evaluate the in vitro antitumor activity of NPs with different coatings mediated by polydopamine, MTT assays were performed using A549 cells and the results are shown in Fig. 7C (pH 7.4) and Fig. 7D (pH 6.3). Firstly, the cell toxicity of LTX loaded NPs exhibited an obvious dose dependent trend and no appreciable difference existed between BSA coated NPs and PEG coated NPs at both pH. However, the growth of cells was suppressed more extensively by PLL–pD–PLGA NPs than by the rest preparations at both pH along with the increase of LTX concentration. Interestingly, this inhibition was more pronounced under acidic than neutral conditions, which was further substantiated by the IC50 values listed in Table 2. The IC50 of PLL coated NPs was 2-fold higher at pH 7.4 than at pH 6.3 (6.7 μg mL−1 vs. 3.3 μg mL−1). This result can be explained by the pH-dependent differences in the intracellular uptake results, which further confirms the advantage of the PLL coating for killing tumor cell in the acidic tumor micro environment.
| IC50 (μg mL−1) | |||||
|---|---|---|---|---|---|
| LTX solution | LTX–PLGA | BSA–pD–LTX–PLGA | PLL–pD–LTX–PLGA | PEG–pD–LTX–PLGA | |
| a IC50 is a concentration at which 50% of the cells are killed which quantitatively evaluates the in vitro therapeutic effects of a pharmaceutical formulation. | |||||
| pH 7.4 | 16.0 | 15.9 | 16.4 | 6.7 | 13.2 |
| pH 6.3 | 19.7 | 18.1 | 16.6 | 3.3 | 13.1 |
3.7 In vivo pharmacokinetics
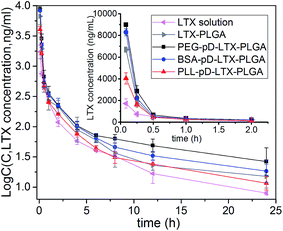
The pharmacokinetic profiles are shown in Fig. 8, and the relevant parameters are listed in Table 3. As expected, PEG–pD–LTX–PLGA NPs exhibited better pharmacokinetic profiles compared with other formulations. The AUC value of PEG coated NPs (5157.807 ± 759.694 μg L−1 h−1) was 3.0-fold higher than that of LTX solution (1701.01 ± 53.90 μg L−1 h−1) and 1.6-fold higher than LTX–PLGA NPs (3285.67 ± 473.05 μg L−1 h−1). Surprisingly BSA–pD–LTX–PLGA NPs showed higher AUC and t1/2z preceded only by the PEG coated NPs. Specifically, the AUC of BSA coated NPs was 2.4-fold greater than that of LTX solution and 1.3-fold greater than LTX–PLGA NPs (4161.45 ± 273.20 μg L−1 h−1 vs. 3285.67 ± 473.05 μg L−1 h−1, p < 0.05). The t1/2z values of BSA coated NPs was 2.3-fold compared with LTX solution (16.56 ± 1.11 h vs. 7.23 ± 0.48 h, p < 0.05) and 1.4-fold compared with PLL–pD–LTX–PLGA NPs (16.56 ± 1.11 h vs. 11.51 ± 3.34 h, p < 0.05). However, the t1/2z values of BSA coated NPs and PEG coated NPs were pretty close (16.56 ± 1.11 h vs. 18.73 ± 5.89 h, p > 0.05). The good pharmacokinetic profiles of BSA coated NPs could be probably attributed to that: (i) the BSA corona around NPs is able to inhibit the plasma proteins adsorption due to electrostatic repulsion between the same charge;38,39 (ii) the preformed albumin shells can reduce adsorption of the other plasma proteins owing to steric hindrance effect.10 Thus, less adsorption of plasma proteins can lead to less phagocytosis of NPs by the reticuloendothelial system (RES).47 Since plasma proteins such as immunoglobulin (IgG) and complement would promote the uptake of NPs by the mononuclear phagocyte system.48 Despite the lower AUC and t1/2z compared with the negatively charged NPs, PLL–pD–LTX–PLGA NPs showed higher AUC, t1/2z and Cmax than LTX solution. Specifically, the AUC of PLL coated NPs was 1.5-fold greater than that of LTX solution (2642.77 ± 133.50 μg L−1 h−1 vs. 1701.01 ± 53.90 μg L−1 h−1, p < 0.05). The t1/2z values of PLL coated NPs was 1.6-fold higher compared to LTX solution (11.51 ± 3.34 h vs. 7.23 ± 0.48 h, p < 0.05).| Parameters | LTX solution | LTX–PLGA | PEG–pD–LTX–PLGA | BSA–pD–LTX–PLGA | PLL–pD–LTX–PLGA |
|---|---|---|---|---|---|
| AUC (0–∞) (μg L−1 h−1) | 1701.01 ± 53.90 | 3285.67 ± 473.05 | 5157.81 ± 759.69 | 4161.45 ± 273.20 | 2642.77 ± 133.50 |
| t1/2z (h) | 7.23 ± 0.48 | 13.06 ± 3.38 | 18.73 ± 5.89 | 16.56 ± 1.11 | 11.51 ± 3.34 |
| Cmax (μg L−1) | 1732.64 ± 435.95 | 6705.43 ± 202.91 | 8988.37 ± 75.73 | 8304.83 ± 335.09 | 4051.83 ± 513.02 |
| Vz (L kg−1) | 24.57 ± 2.01 | 23.368 ± 7.82 | 20.62 ± 3.46 | 23.29 ± 11.26 | 25.09 ± 6.73 |
| MRT (0–∞) (h) | 7.13 ± 0.29 | 7.10 ± 1.56 | 11.39 ± 6.77 | 8.82 ± 3.06 | 7.63 ± 1.62 |
3.8 In vivo biodistribution
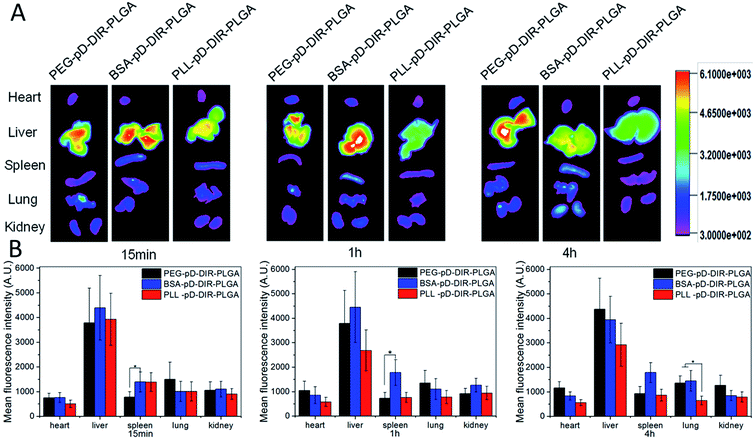
Ex vivo imaging was used to assess the biodistribution of polydopamine assisted surface coated NPs. Sprague–Dawley rats were sacrificed after intravenous injection (iv) administration and the major organs including heart, liver, spleen, lungs and kidneys were excised. The results are summarized in Fig. 9. First of all, the three types of coated NPs were mainly distributed in liver and this result was determined by the particle size. The sum of organ distribution for PLL coated NPs was less than that of negatively charged NPs. These results are in good agreement with its low AUC in pharmacokinetic (PK) results discussed above. It is speculated that a portion of the positively charged particles might be internalized by blood cells or be bound to the polyanions on the surface of the vessel wall.49 15 min and 1 h post-injection, the distribution of PEG–pD–DiR–PLGA was less than BSA and PLL coated NPs in the liver and spleen (p < 0.05), but more than BSA and PLL coated NPs in lungs. Subsequently, PEG–pD–DiR–PLGA NPs were gradually transferred mainly to the liver, but their distribution in lungs was still more than PLL coated NPs (p < 0.05). Although foreign particles cannot avoid the ultimate fate of opsonization and engulfment by the reticuloendothelial system (RES), understanding the in vivo distribution characteristics is of great significance for controlling the in vivo distribution behavior of nanoparticles to meet our expectations when NPs designed.4. Conclusions
In this study, a strategy that can selectively alter the biological fate of NPs simply by tunable coatings was established. We successfully modified NPs with three surface coatings simply and uniformly via polydopamine (pD) to improve their pharmacokinetic profiles, enhance their cellular internalization ability, reduce their toxicities and delay the drug release. The modified NPs structure was confirmed by the increase in particle size, potential change, morphology, surface components, 1H-NMR and FT-IR, and each coating had its individual characteristics in pharmacokinetic profiles, cellular internalization ability and toxicities. Specifically, BSA coated NPs could inhibit the plasma proteins adsorption thus prolong the circulation time to some extent, meanwhile, BSA shell showed good biocompatibility, non-toxicity and a delay in drug release. Interestingly, PLL coated NPs exhibited higher and slightly pH-dependent intracellular uptake and antitumor activity in an acidic tumor micro environment. Even so, the PLL coating does not exhibit particularly high toxicity possibly due to its low positive charge density. In addition, PEG coated NPs exhibited good pharmacokinetic profiles as expected.After a systematic understanding of the biological behavior of each coating, particles can be selectively modified by the shells mentioned above when designed. In consideration of the facts that dopamine polymerization is not limited by the nature of the substrates, pD–surface modifiers complex shells (pD–BSA, pD–PLL, pD–PEG) can be used for a wide variety of particles. And of course, the outer modifiers can be changed as needed. In conclusion, this simple and uniform strategy that can selectively alter the biological fate of NPs as needed provides great potential for future controllable passive delivery for cancer and other therapeutic or diagnostic applications.
Abbreviations
| NPs | nanoparticles |
| pD | polydopamine |
| LTX | larotaxel |
| PEG | polyethylene glycol |
| BSA | bovine serum albumin |
| PLL | poly-L-lysine |
| PDI | polydispersity index |
| CLSM | confocal laser scanning microscopy |
| DAPI | 4′,6′-diamidino-2-phenylindole |
| C6 | coumarin-6 |
| AUC | area under curve |
| MRT | mean residence time |
| t1/2z | plasma half-life |
| Cmax | maximum plasma drug concentration |
| V | distribution volume during elimination phase |
Acknowledgements
This work was funded by the Major State Basic Research Development Program of China 973 Program (2015CB932103).References
- X. Duan and Y. Li, Small, 2013, 9, 1521–1532 CrossRef CAS PubMed.
- H. Guo, S. Y. Fei, Y. Zhang, J. Gou, L. Zhang, H. He, T. Yin, Y. Wang and X. Tang, RSC Adv., 2016, 6, 81110–81119 RSC.
- R. Mout, D. F. Moyano, S. Rana and V. M. Rotello, Chem. Soc. Rev., 2012, 41, 2539–2544 RSC.
- F. Alexis, E. Pridgen, L. K. Molnar and O. C. Farokhzad, Mol. Pharm., 2008, 5, 505–515 CrossRef CAS PubMed.
- Q. Yang, S. W. Jones, C. L. Parker, W. C. Zamboni, J. E. Bear and S. K. Lai, Mol. Pharm., 2014, 11, 1250–1258 CrossRef CAS PubMed.
- Z. Luo, Y. Hu, R. Xin, B. Zhang, J. Li, X. Ding, Y. Hou, L. Yang and K. Cai, J. Biomed. Mater. Res., Part A, 2014, 102, 3781–3794 CrossRef PubMed.
- J. S. Choi and N. Meghani, Colloids Surf., B, 2016, 145, 653–661 CrossRef CAS PubMed.
- K. A. Gelmon, J. Latreille, A. Tolcher, L. Génier, B. Fisher, D. Forand, S. D'Aloisio, L. Vernillet, L. Daigneault, A. Lebecq, M. Besenval and E. Eisenhauer, J. Clin. Oncol., 2000, 18, 4098–4108 CrossRef CAS PubMed.
- Z. Liu, Y. Feng, L. Zhang, G. Li, L. Geng, Y. Cui, F. Teng, X. Tang, K. Bi and X. Chen, Cancer Chemother. Pharmacol., 2013, 71, 1131–1139 CrossRef CAS PubMed.
- Q. Peng, S. Zhang, Q. Yang, T. Zhang, X. Wei, L. Jiang, C. Zhang, Q. Chen, Z. Zhang and Y. Lin, Biomaterials, 2013, 34, 8521–8530 CrossRef CAS PubMed.
- K. Tahara, S. Furukawa, H. Yamamoto and Y. Kawashima, Int. J. Pharm., 2010, 392, 311–313 CrossRef CAS PubMed.
- S. K. Sahoo and V. Labhasetwar, Mol. Pharm., 2005, 2, 373–383 CrossRef CAS PubMed.
- K. S. Rao, M. K. Reddy, J. L. Horning and V. Labhasetwar, Biomaterials, 2008, 29, 4429–4438 CrossRef CAS PubMed.
- S. Narayanan, N. S. Binulal, U. Mony, K. Manzoor, S. Nair and D. Menon, Nanotechnology, 2010, 21, 285107 CrossRef PubMed.
- J. Cheng, B. A. Teply, I. Sherifi, J. Sung, G. Luther, F. X. Gu, E. Levy-Nissenbaum, A. F. Radovic-Moreno, R. Langer and O. C. Farokhzad, Biomaterials, 2007, 28, 869–876 CrossRef CAS PubMed.
- N. M. Alves, C. Picart and J. F. Mano, Macromol. Biosci., 2009, 9, 776–785 CrossRef CAS PubMed.
- S. G. Caridade, C. Monge, F. Gilde, T. Boudou, J. F. Mano and C. Picart, Biomacromolecules, 2013, 14, 1653–1660 CrossRef CAS PubMed.
- R. Meng, K. Li, Z. Chen and C. Shi, J. Huazhong Univ. Sci. Technol., 2016, 36, 7 Search PubMed.
- A. Acevedo-Fani, L. Salvia-Trujillo, R. Soliva-Fortuny and O. Martín-Belloso, Biomacromolecules, 2015, 16, 2895–2903 CrossRef CAS PubMed.
- H. Lee, S. M. Dellatore, W. M. Miller and P. B. Messersmith, Science, 2007, 318, 426–430 CrossRef CAS PubMed.
- H. Lee, J. Rho and P. B. Messersmith, Adv. Mater., 2009, 21, 431–434 CrossRef CAS PubMed.
- H. Lee, N. F. Scherer and P. B. Messersmith, Proc. Natl. Acad. Sci. U. S. A., 2006, 103, 12999–13003 CrossRef CAS PubMed.
- S. H. Ku, J. Ryu, S. K. Hong, H. Lee and C. B. Park, Biomaterials, 2010, 31, 2535–2541 CrossRef CAS PubMed.
- Y. Liu, K. Ai, J. Liu, M. Deng, Y. He and L. Lu, Adv. Mater., 2013, 25, 1353–1359 CrossRef CAS PubMed.
- C. J. Bettinger, J. P. Bruggeman, A. Misra, J. T. Borenstein and R. Langer, Biomaterials, 2009, 30, 3050–3057 CrossRef CAS PubMed.
- J. Pan, Y. Liu and S. S. Feng, Nanomedicine, 2010, 5, 347–360 CrossRef CAS PubMed.
- H. Zhu, H. Chen, X. Zeng, Z. Wang, X. Zhang, Y. Wu, Y. Gao, J. Zhang, K. Liu, R. Liu, L. Cai, L. Mei and S. S. Feng, Biomaterials, 2014, 35, 2391–2400 CrossRef CAS PubMed.
- Z. Liu, B. Zhang, Z. Liu, S. Li, G. Li and L. Geng, Anal. Bioanal. Chem., 2012, 403, 323–330 CrossRef CAS PubMed.
- Y. Liu, K. Ai and L. Lu, Chem. Rev., 2014, 114, 5057–5115 CrossRef CAS PubMed.
- R. van der Westen, L. Hosta-Rigau, D. S. Sutherland, K. N. Goldie, F. Albericio, A. Postma and B. Städler, Biointerphases, 2012, 7, 8 CrossRef CAS PubMed.
- Q. Liu, B. Yu, W. Ye and F. Zhou, Macromol. Biosci., 2011, 11, 1227–1234 CrossRef CAS PubMed.
- H. Xu, D. Yang, C. Cai, J. Gou, Y. Zhang, L. Wang, H. Zhong and X. Tang, Acta Biomater., 2015, 16, 156–168 CrossRef CAS PubMed.
- E. Bernabeu, G. Helguera, M. Legaspi, L. Gonzalez, C. Hocht and C. Taira, Colloids Surf., B, 2014, 113, 43–50 CrossRef CAS PubMed.
- M. Zhang, X. Zhang, X. He, L. Chen and Y. Zhang, Nanoscale, 2012, 4, 3141–3147 RSC.
- S. Zhu, D. S. Lansakara-P, X. Li and Z. Cui, Bioconjugate Chem., 2012, 23, 966–980 CrossRef CAS PubMed.
- D. Le Broc-Ryckewaert, R. Carpentier, E. Lipka, S. Daher, C. Vaccher, D. Betbeder and C. Furman, Int. J. Pharm., 2013, 454, 712–719 CrossRef CAS PubMed.
- C. D. Walkey and W. C. Chan, Chem. Soc. Rev., 2012, 41, 2780–2799 RSC.
- J. Wang, J. Chen, J. Yang, H. Wang, X. Shen, Y. Sun, M. Guo and X. Zhang, Int. J. Nanomed., 2016, 11, 3475–3485 CrossRef CAS PubMed.
- D. Yu, Y. Zhang, X. Zhou, Z. Mao and C. Gao, Biomacromolecules, 2012, 13, 3272–3282 CrossRef CAS PubMed.
- M. P. Calatayud, B. Sanz, V. Raffa, C. Riggio, M. R. Ibarra and G. F. Goya, Biomaterials, 2014, 35, 6389–6399 CrossRef CAS PubMed.
- P. S. Ghosh, C. K. Kim, G. Han, N. S. Forbes and V. M. Rotello, ACS Nano, 2008, 2, 2213–2218 CrossRef CAS PubMed.
- H. Chen, L. Xie, J. Qin, Y. Jia, X. Cai, W. Nan, W. Yang, F. Lv and Q. Zhang, Colloids Surf., B, 2016, 138, 1–9 CrossRef CAS PubMed.
- H. Mokuno, N. Yamada, H. Shimano, S. Ishibashi, N. Mori, K. Takahashi, T. Oka, T. H. Yoon and F. Takaku, Biochim. Biophys. Acta, 1991, 1082, 63–70 CrossRef CAS.
- E. Allémann, P. Gravel, J. C. Leroux, L. Balant and R. Gurny, J. Biomed. Mater. Res., 1997, 37, 229–234 CrossRef.
- G. Romero, I. Estrela-Lopis, J. Zhou, E. Rojas, A. Franco, C. S. Espinel, A. G. Fernández, C. Gao, E. Donath and S. E. Moya, Biomacromolecules, 2010, 11, 2993–2999 CrossRef CAS PubMed.
- Q. Liu, H. Li, Q. Xia, Y. Liu and K. Xiao, Int. J. Nanomed., 2015, 10, 7073–7088 CAS.
- H. Ruh, B. Kuhl, G. Brenner-Weiss, C. Hopf, S. Diabate and C. Weiss, Toxicol. Lett., 2012, 208, 41–50 CrossRef CAS PubMed.
- M. Lundqvist, J. Stigler, G. Elia, I. Lynch, T. Cedervall and K. A. Dawson, Proc. Natl. Acad. Sci. U. S. A., 2008, 105, 14265–14270 CrossRef CAS PubMed.
- S. A. Lobov, D. W. King, K. J. Knox, T. J. Senden and R. W. Stephens, Biomaterials, 2013, 34, 1732–1738 CrossRef CAS PubMed.
Footnote |
| † Electronic supplementary information (ESI) available. See DOI: 10.1039/c7ra01354j |
| This journal is © The Royal Society of Chemistry 2017 |


