 Open Access Article
Spectroscopic characterization of SrB4O7:Tm2+, a potential laser material and optical temperature sensor
Piotr Solarz *a,
Jarosław Komar
 a,
Michał Głowackib,
Marek Berkowskib and
Witold Ryba-Romanowski
 a
a
aInstitute of Low Temperature and Structure Research, Polish Academy of Sciences, ul. Okólna 2, 50-422 Wrocław, Poland. E-mail: solarz@int.pan.wroc.pl; Fax: +48-713441029; Tel: +48-713435021
bInstitute of Physics, Polish Academy of Sciences, al. Lotników 32/46, 02-668 Warsaw, Poland
First published on 12th April 2017
Abstract
Polycrystalline samples of SrB4O7:1% Tm2+ were prepared in air by a solid state reaction method. High resolution spectra and decay curves for infrared luminescence related to the intraconfigurational 2F5/2 → 2F7/2 transition and for visible luminescence related to the interconfigurational transition between the lowest energy state of the 4f125d configuration and the ground 2F7/2 state of the 4f13 configuration of Tm2+ were recorded as a function of temperature between 5 and 350 K. Energies of crystal field levels of the 2F5/2 and 2F7/2 multiplets and the 2F5/2 lifetime value were determined from low temperature measurements. With these data room temperature emission and absorption spectra were calibrated in the cross-section units. It was found that the infrared emission in SrB4O7:Tm2+ is long-lived with a lifetime value of 9.5 ms and its spectrum indicates that stimulated emission near 1.18 nm may be feasible. Examination of recorded decay curves for the visible luminescence revealed that the lifetime of the lowest energy state of the 4f125d configuration depends weakly on temperature in the region 5–280 K and then shows a steep decrease when the temperature grows from about 290 K to 350 K. The evaluated values of the thermal sensitivity parameter S for SrB4O7:Tm2+ in the region 300–330 K (27–57 °C) exceed 3.9% per K with a peak at 320 K (47 °C) equal to 6.30% per K. The S value is the highest reported thus far for luminescence thermometers operating in physiological temperatures.
1 Introduction
There is a long lasting interest in rare earth-doped crystals and glasses. In the past attention has been directed mainly toward finding new laser crystals and designing laser devices. In an enormous number of published papers, laser operation for Nd3+, Ho3+, Er3+, Tm3+ and Yb3+ in a variety of host crystals has been reported and solid state lasers employing some of these systems are now commercially available. Physicochemical and laser properties of these materials have been reported in several review works, e.g. in an exhaustive review by Kaminskii.1 The search for new laser active crystals is continuing and is directed mainly toward finding better and cheaper laser hosts.2–4 Crystals doped with divalent rare earth ions have been studied, too. Interest in these systems resulted from an expectation that owing to low energies of the 4fN−15d excited configurations the broad and intense absorption bands related to parity allowed inter-configurational transitions in divalent rare earth ions would be beneficial for optical pumping. This expectation has not been corroborated, however. In early works the alkaline fluoride host crystals have been chosen and laser operation has been demonstrated in CaF2:Sm2+,5,6 SrF2:Sm2+,7,8 CaF2:Dy2+ (ref. 9–11) and CaF2:Tm2+,12,13 but only at cryogenic temperatures. Attempts to achieve room temperature laser operation in crystals doped with Sm2+ or Dy2+ were unsuccessful because their luminescence bandwidths were found to grow adversely with increasing temperature. Room temperature laser operation in CaF2:Tm2+ could not be achieved as a consequence of an adverse ground state absorption of Tm 3+ ions (about 80% of thulium ions in CaF2 host was present in the trivalent state).Recently, a considerable interest has been directed to optical temperature sensing that offers a possibility to measure the temperature remotely. Numerous papers published during last decade have been devoted to elaborate various methods of temperature sensing and potential sensors that may be employed for this purpose. A variety of thermometers for thermal sensing based on organic fluorophores, quantum dots, bio-molecules and rare earth-doped systems have been described and their sensing capabilities compared. Achievements and current knowledge in this field are presented in valuable review works published recently e.g.14–17 Phosphor thermometers based on luminescent rare earth ions in inorganic hosts are especially attractive because they offer rich energy level structures and are able to show luminescence transitions in a vast spectral region from UV to near infrared. Phosphor thermometers investigated thus far contained trivalent luminescent rare earth ions Nd3+, Eu, Dy, Ho, Er, Tm.
In the present paper we deal with spectroscopic features of divalent thulium ions in SrB4O7 host. Currently, the interest in oxide crystals doped with divalent rare earth ions is stimulated by the search for efficient phosphors able to convert the radiation of blue light emitting diodes (LED) into white light, providing thereby new sources for lighting purposes. The discovery of intense luminescence in SrB4O7 host doped with Eu2+ (ref. 18) and with Sm2+ ions19 has proved that oxide host crystals are worth considering. In fact, numerous visible phosphors based on Eu2+-doped hosts have been recently fabricated and characterized, e.g.: Ca2SiO4:Eu2+,20 CaSrSiO4:Eu2+,21 Ba3Si6O12N2:Eu2+ (ref. 22) and many sulphides.23
Considerable less attention has been paid to Sm2+-doped systems. Nevertheless recent papers dealing with the SrB4O7:Sm2+ phosphor have demonstrated its suitability for application as optical pressure sensors at high temperatures.24–26 Peculiarities of emission spectra related to the intra-configurational transitions of Sm2+ in SrB4O7:Sm2+ have been reported in ref. 27–29. Effect of temperature on intensities of inter- and intra-configurational transitions and on luminescence lifetime of SrB4O7:Sm2+ have been studied in ref. 30 and 31. Just recently it has been demonstrated that SrB4O7:5% Sm2+ system is promising for application as an optical sensor characterized by a high relative decay time temperature sensitivity in a wide temperature region with a record value of 3.36% per K at 550 K.32
The search for phosphors based on divalent thulium ions is hampered by the fact that these ions are less stable than Eu2+ and Sm2+ ions. As far as we know only two papers published in the past provide fundamental information on luminescence of Tm2+ ions in oxide crystals. The paper by Schipper et al.33 has reported the first observation of the 4f125d → 4f13 emission of Tm2+ in SrB4O7 powder samples prepared by a solid state reaction in a reducing atmosphere consisting of 25% H2 and 75% N2. Authors have analysed and interpreted emission and excitation spectra recorded at 4.2 K and proposed mechanisms governing the excited state relaxation dynamics in the temperature region between 4.2 K and 300 K. In the paper by Peterson et al.34 the room temperature diffuse reflectance spectra of SrB4O7:Tm2+ powders fired at temperatures ranging from 650 °C to 900 °C in air or in Ar/H2 atmosphere have been recorded and analysed. Authors have shown that the reduction from Tm3+ to Tm2+ in SrB4O7 occurred also for samples fired in air though a significant fraction of incorporated thulium ions still was present in the trivalent state.34 The outstanding feature of the SrB4O7:RE2+ (RE = Eu, Sm, Tm) stems from the stability of oxidation state of incorporated rare earth ions combined with a large transparency region of the host crystal stretching from UV to about 3000 nm.35
Intention of the present work is to determine spectroscopic properties of the SrB4O7:Tm2+ system that are relevant to its potential for practical application. First, spectral and temporal characteristics of transitions within the 4f13 configuration of Tm2+ are analysed to assess the feasibility of resonantly pumped infrared laser operation near 1.2 μm. Second, the effect of temperature on spectra and decay of visible luminescence related to the inter-configurational 4f125d → 4f13 transition of Tm2+ is investigated aiming at assessment of utility of the SrB4O7:Tm2+ as an optical temperature sensor.
2 Experimental
Synthesis
SrB4O7 polycrystalline samples were prepared by a solid state reaction method. As starting materials SrCO3 (4N5), B2O3 (4N), and Tm2O3 (5N) were used. Powders were dried for 10 hours and then their appropriate amounts were weighted to obtain following molar composition: Sr0.99Tm0.01B4O7. Mixed SrCO3 and B2O3 were formed into pellets and heated in air for 10 hours in 300 °C and 10 hours in 800 °C. First step of heating is necessary to avoid melting of B2O3 before getting in reaction with strontium carbonate. When reaction begins the CO2 is starting to volatilize and heated pellets begins to swell. Second step of heating causes complete removal of CO2 from the material. Thoroughly grounded and formed into pellets materials were heated in air again for 24 hours in 800 °C to remove other SrO–B2O3 phases and obtain pure SrB4O7 phase. Then 1% of Tm2O3 was added and mixture was heated for the third time for 24 hours in 800 °C. To perform spectroscopic measurement the polycrystalline pellets 17 mm in diameter and 2 mm thick were prepared.Spectroscopic measurements
High resolution emission spectra were recorded upon ion argon laser excitation 488 nm line with DongWoo Optron setup composed of 750 mm focal length monochromator DM711 (1 cm−1 spectral resolution FWHM for 0.02 mm slits), and detection systems: (VIS) PDS-1 with photomultiplier tube R3896 (Hamamatsu) or (IR) PS/TC-1 controller with InGaAs detector model IGA-030-TE2-H Electro-Optical Systems Inc Kinetic measurements were taken employing an experimental set-up consisting of a tunable optical parametric oscillator (OPO) pumped by a third harmonic of a Nd:YAG laser, a double grating monochromator with a 1000 mm focal length, a detection unit incorporating a photomultiplier operating in the visible or a cooled InSb detector operating in near infrared and a Tektronix MDO 4054B-3 Mixed Domain Oscilloscope. The OPO source delivered a train of light pulses with duration of 7 ns and pulse energy of several mJ (depending on wavelength within the 430–600 nm region) with the repetition rate of 20 Hz. The same apparatus was employed to record excitation (PLE) spectra. To perform measurements at low temperature, the samples were installed in a continuous flow liquid helium cryostat equipped with a temperature controller.Crystallographic structure determination
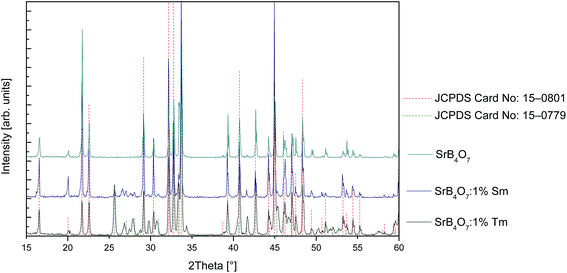
Phase analysis and structural refinement were performed with a Siemens D5000 diffractometer (Ni-filtered CuKα radiation). Data were collected in the range 20–100° with a step of 0.02° and averaging time of 10 s per step. XRD pattern (Fig. 1) shows pure SrB4O7 phase (JCPDS Card No. 15-0801) for undoped sample. In thulium doped SrB4O7 beside the main tetraborate phase there is a little amount of metaborate (JCPDS Card No. 15-0779) phase visible.3 Results and discussion
Luminescence of Tm2+ ions in crystals may be related to vibronic inter-configurational transitions between the lowest energy state of the 4f125d configuration and the ground 2F7/2 state of the 4f13 configuration and to an intra-configurational 2F5/2 → 2F7/2 transition. The spectral region of the latter transition is close to that of the 2F5/2 → 2F7/2 transition of isoelectronic Yb3+ ions and depends weakly on the host crystal. Resulting luminescence band in CaF2:Tm2+ system has been observed near 1.12 μm and the low temperature laser operation at 1.116 μm has been obtained in the past.12,13 Peculiarities of the 2F5/2 → 2F7/2 luminescence for the SrB4O7:Tm2+ system have not been determined in previously reported study because weak luminescence lines could not be separated from the background.33 Also, the room temperature absorption (diffuse reflectance measurement) spectrum recorded for the 2F7/2 → 2F5/2 transition in SrB4O7:Tm2+ did not provide reliable information because of superposed absorption of residual Tm3+ ions.34 It will be shown in the following paragraph that spectra and decay curves recorded in a wide temperature region are able to provide new information on the 2F5/2 → 2F7/2 infrared luminescence in SrB4O7:Tm2+.3.1 Effect of temperature on the intra-configurational 2F5/2 → 2F7/2 infrared luminescence
Fig. 2 compares luminescence spectra of Tm2+ in the near infrared region, recorded at several different temperatures in the region of 5–300 K.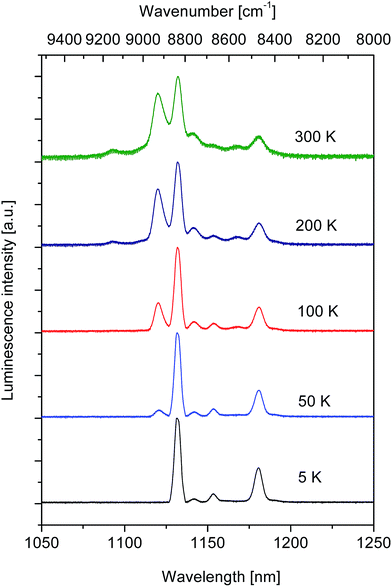 | ||
| Fig. 2 The 2F5/2 → 2F7/2 luminescence spectra of Tm2+ ions in SrB4O7 host recorded at several different temperatures upon excitation at 488 nm. | ||
The site symmetry for Tm2+ ions in this host is lower than cubic, therefore four crystal field components for the ground 2F7/2 multiplet and three crystal field components for the 2F5/2 excited multiplet are predicted. Since the population of the crystal field components is governed by the Boltzmann statistics the luminescence spectra are expected to be temperature dependent. It can be seen in Fig. 2 that at 5 K the luminescence spectrum consists of four well separated lines located at 1131.6 nm (8837 cm−1), 1141.3 nm (8762 cm−1), 1152.95 nm (8673 cm−1) and 1180 nm (8475 cm−1). We assign these lines to transitions from the lowest crystal field component of the 2F5/2 excited multiplet to four crystal field components of the ground state. Accordingly, the line located at 1131.6 nm is related to the transition ending on the lowest crystal field component of the ground multiplet (0–0 line) and remaining lines are related to transitions ending on the higher crystal field components located at 75, 164 and 362 cm−1. In the spectrum of the 50 K luminescence an additional line related to transition from the second higher energy component of the initial 2F5/2 multiplet appears at 1120.25 nm (8927 cm−1). Above 200 K a weak line peaking at 1093.3 nm (9147 cm−1) contributes to the spectrum. Assuming that it is related to transitions from the highest energy component of the initial state we locate components of the 2F5/2 excited multiplet at 8837, 8927 and 9147 cm−1. At higher temperatures the transitions from all crystal field levels of the 2F5/2 multiplet contribute to luminescence band and recorded spectra do not show significant differences.
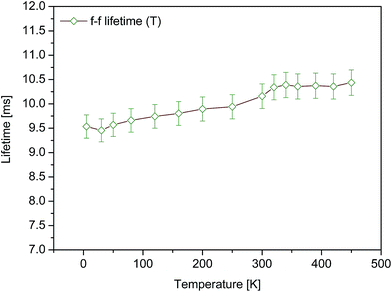
The 2F5/2 → 2F7/2 infrared luminescence of Tm2+ in SrB4O7 is found to be long-lived. Decay curves of this luminescence were recorded at different temperatures in the 5–450 K region. All of them were consistent with a single exponential time dependence providing thereby a set of reliable lifetime values. A plot of measured luminescence lifetimes versus temperature is shown in Fig. 3.
Observed increase of the lifetime with growing temperature is due likely to a lengthening effect of self-absorption, commonly encountered during investigation of the 2F5/2 → 2F7/2 emission in crystals doped with Yb3+. Therefore we consider the value of 9.5 ms determined from a decay curve recorded at 5 K to be actual 2F5/2 lifetime.
In principle the relaxation of the 2F5/2 metastable level of Tm2+ in SrB4O7 is governed by radiative transitions and nonradiative multiphonon transitions. The rate of multiphonon relaxation is expected to be low since a simultaneous emission of six phonons with the highest energy of about 1400 cm−1 that are available in the host would be needed to bridge the energy difference of about 8400 cm−1 between the 2F5/2 and 2F7/2 levels. Having this in mind we assume that the measured luminescence lifetime of 9.5 ms is close to the 2F5/2 radiative lifetime and we calibrate the 2F5/2 → 2F7/2 emission band in units of emission cross-section σem(λ) employing the Füchtbauer–Ladenburg relation:
 | (1) |
 | (2) |
 | (3) |
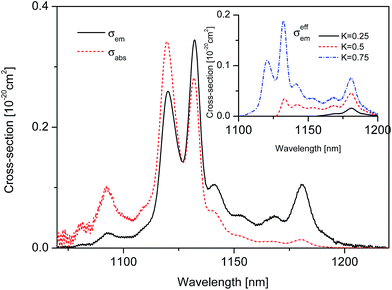 | ||
| Fig. 4 Room temperature 2F5/2 → 2F7/2 luminescence spectrum σem (solid line) and derived 2F7/2 → 2F5/2 absorption spectrum σabs (dashed line) calibrated in cross-section units for the SrB4O7:Tm2+ system. Inset shows an effective emission cross-section spectrum σeffem(λ) calculated according to eqn (4). | ||
It can be seen that the curve of emission cross-section dominates significantly that of absorption cross-section in the spectral region between 1150 and 1230 nm pointing thereby at positive values of optical amplification coefficient. To predict the wavelength of a potential laser operation the effective emission cross-section function σeffem(λ) was evaluated according to the relation:
| σeffem(λ) = Kσem(λ) − (1 − K)σabs(λ) | (4) |
3.2 Effect of temperature on the 4f125d → 4f13 visible luminescence
In contrast to the 2F5/2 level of the 4f13 configuration considered above, the lowest energy state of the 4f125d configuration of Tm2+ ions depends strongly on the host. Based on careful analysis of low temperature luminescence spectrum it has been located at 17![[thin space (1/6-em)]](https://www.rsc.org/images/entities/char_2009.gif) 210 cm−1 SrB4O7:Tm2+ system,33 that is markedly higher than about 14
210 cm−1 SrB4O7:Tm2+ system,33 that is markedly higher than about 14![[thin space (1/6-em)]](https://www.rsc.org/images/entities/char_2009.gif) 000 cm−1 found in the past for CaF2:Tm2+ system.12,13 Due to larger energy gap between the bottom of the 4f125d configuration and the next lower energy 2F5/2 state the nonradiative relaxation is suppressed in SrB4O7:Tm2+ system and an efficient visible emission related to the 4f125d → 4f13 (2F7/2) transition is observed.
000 cm−1 found in the past for CaF2:Tm2+ system.12,13 Due to larger energy gap between the bottom of the 4f125d configuration and the next lower energy 2F5/2 state the nonradiative relaxation is suppressed in SrB4O7:Tm2+ system and an efficient visible emission related to the 4f125d → 4f13 (2F7/2) transition is observed.
Fig. 5 shows spectra of visible luminescence in the SrB4O7:Tm2+ system recorded at several sample temperatures in the 300–5 K temperature region. At 300 K the spectrum has a maximum at 595.4 nm and consists of a single broad and smooth band, typical for vibronic transitions. Decrease of temperature down to 110 K affects little the shape of the luminescence band but it brings about a monotonic shift of the band maximum to about 601.2 nm.
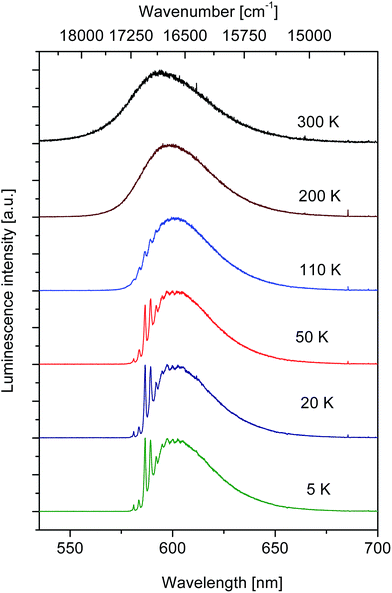 | ||
| Fig. 5 Effect of temperature on spectral characteristics of visible luminescence in SrB4O7:Tm2+ system. Excitation wavelength was 488 nm. | ||
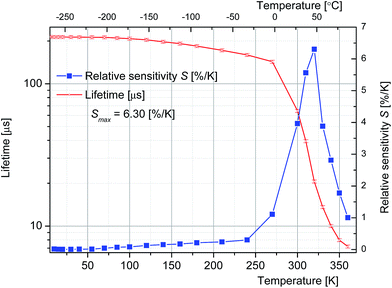
During further decrease of temperature the position of maximum is arrested but the intensity of a structure on the short wavelength side of the band, hardly visible at 110 K, grows steadily and eventually at 5 K a group of narrow lines contributes to the spectrum. Details of the 5 K luminescence spectrum shown in Fig. 5 are consistent with those recorded at 4.2 K and reported in the work by Schipper et al.33 proving thereby that we are dealing with the same material. According to the assignment proposed in33 the structure that appears in the low temperature spectrum of the 4f125d → 4f13 transition of Tm2+ in SrB4O7 consists of zero phonon lines and related progressions. Measurement of the excited state relaxation dynamics was performed when changing the sample temperature in a vast region 5–360 K. It was found that the decay curves of luminescence follow a single exponential time dependence for all temperature points considered. Fig. 6 shows a plot of evaluated time constants (luminescence lifetime values) versus sample temperature.
It can be seen that initially the lifetime values decrease gently with increasing temperature and then at about 290 K a very steep decrease occurs. Eventually at 360 K the lifetime value of 5 us was measured. Observed change of lifetime induced by variation of the temperature points at the potential of the system under study for optical thermometry. Commonly, the quality of optical sensors based on temperature-dependent luminescence lifetime is assessed employing a thermal sensitivity parameter S defined by the relation:32
 | (5) |
The sensitivity parameter was calculated according to eqn (5) above and plotted versus temperature in Fig. 6.
The evaluated values of thermal sensitivity parameter S for the SrB4O7:Tm2+ system in the 300–330 K (27–57 °C) region exceed 3.9% per K with a peak value of 6.30% per K at 320 K (47 °C). It can be seen that in the temperature region between 10 °C and 47 °C the luminescence lifetime values are advantageously high and the S parameter depends linearly on the temperature.
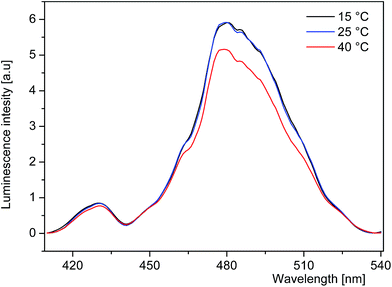
In addition, the SrB4O7:Tm2+ system shows a broad and intense absorption band stretching from 450 nm to 550 nm favouring thereby an efficient excitation. Moreover, the PLE spectra recorded at 15 °C, 25 °C and 40 °C and compared in Fig. 7 indicate that the excitation efficiency is weakly affected by the temperature in this region. It is worth mentioning that in contrast to crystals doped with trivalent rare earth ions the ion–ion energy transfer processes do not affect significantly spectra and excited state relaxation dynamics of Tm2+ ions in SrB4O7. Indeed, low temperature luminescence spectra and lifetime of inter-configurational transition reported for SrB4O7:0.5% Tm2+ in ref. 33 do not differ from those presented above for SrB4O7:1% Tm2+. All these features indicate that the SrB4O7:Tm2+ system may be a promising optical sensor operating in the physiological temperature region.
Ability to measure temperature changes in living cells is of paramount importance for the detection of pathological states e.g. of tumour deceases. Therefore numerous papers published during last decade have been devoted to elaborate various methods of temperature sensing and potential sensors that may be employed for this purpose. In an excellent review paper published recently by Tingting Bai and Ning Gu17, presenting the state of the art in this topic, thermometers for thermal sensing and imaging of living cells and biological tissues based on organic fluorophores, quantum dots, bio-molecules and rare earth-doped systems are described and their sensing capabilities compared. Reported values of thermal sensitivity parameter S refer to various spans of temperature within the 10–60 °C region. Among non-contact luminescent thermometers the highest values of S parameters have been found for organic fluorophores, e.g.: 3.9% per K in the temperature range 32–37 °C for ns decay of “ER thermo yellow” compound37 and for rare earth metal complexes, e.g.: 2.74% per K in the temperature range 25–50 °C for Eu-TTA.38 Evaluated thermal sensitivity parameters for inorganic rare earth-doped thermometers are markedly lower, however39–42 with the highest S parameter value of 1.6% per K in the temperature range 10–36 °C reported for NaYF4:Er3+,Yb3+.43 Recently, using a Cr3+ to Nd3+ emission intensity ratio, the highest 3.48% per K sensitivity has been obtained in the physiological temperature range.44 The evaluated values of thermal sensitivity parameter S for the SrB4O7:Tm2+ system in the 300–330 K (27–57 °C) region exceed 3.9% per K with a peak value of 6.30% per K at 320 K (47 °C), and to our knowledge they are higher than those reported thus far for other luminescent thermometers operating in this temperature region.
4 Conclusions
Based on analysis of the effect of temperature on luminescence spectrum related to the 2F5/2 → 2F7/2 intra-configurational transition of Tm2+ three crystal field levels of the 2F5/2 initial multiplet were located at 8837, 8927 and 9147 cm−1 and four crystal field levels of the ground 2F7/2 multiplet were located at 75, 164 and 362 cm−1 for the SrB4O7:Tm2+ system. Observed luminescence is long-lived with a lifetime value of 9.5 ms at 5 K. Comparison of the room temperature 2F5/2 → 2F7/2 luminescence band calibrated in the cross-section units according to the Füchtbauer–Ladenburg relation to that of the 2F7/2 → 2F5/2 absorption band derived by a reciprocity method points at a positive value of optical amplification coefficient in a spectral region between 1150 and 1230 nm. Adverse effect of self-absorption was considered and its importance was assessed based on the calculated effective cross-section spectrum. It was also concluded that an excited state absorption (ESA) due to allowed transitions from the metastable level to states of the 4fN−15d configuration (ESA), cannot affect the emission around 1.18 μm in SrB4O7:Tm2+ because of large 4fN−15d → 2F5/2 energy gap. In SrB4O7:Tm2+ system the lifetime (τ) of intense visible emission related to vibronic inter-configurational transitions between the lowest energy state of the 4f125d configuration and the ground 2F7/2 state of the 4f13 configuration of Tm2+ changes abruptly when the temperature (T) varies in the region 280–350 K implying utility of this system for luminescence- based thermometry. The evaluated values of thermal sensitivity parameter S for the SrB4O7:Tm2+ system in the 300–330 K (27–57 °C) region exceed 3.9% per K with a peak value of 6.30% per K at 320 K (47 °C). Therefore, such a phosphor can be used as temperature sensor in biological region of temperatures.Author contributions
The manuscript was written through contributions of all authors. All authors have given approval to the final version of the manuscript.Funding sources
NCN under project DEC-2013/09/D/ST5/03878.Abbreviations
| 4N | 99.99% |
| 4N5 | 99.995% |
| 5N | 99.999% |
| ESA | Excited state absorption |
| Eu-TTA | Europium(III) thenoyltrifluoroacetonate trihydrate |
| FWHM | Full width at half maximum |
| IR | Infrared |
| JCPDS | Joint Committee on Powder Diffraction Standards |
| LED | Light emitting diode |
| NCN | National Science Centre |
| S | Thermal sensitivity parameter |
| VIS | Visible |
| XRD | X-ray diffraction |
Acknowledgements
The work was funded by the National Science Centre (NCN) on the basis of the decision number DEC-2013/09/D/ST5/03878.References
- A. A. Kaminskii, Laser Photonics Rev., 2007, 1, 93–177 CrossRef CAS.
- X. Zhang, Y. Zhou, J. Ren, D. Lu, H. Yu, Z. Wang, S. Guo and X. Xu, CrystEngComm, 2016, 18, 5338–5343 RSC.
- L. Zhang, H. Lin, G. Zhang, X. Mateos, J. M. Serres, M. Aguiló, F. Díaz, U. Griebner, V. Petrov, Y. Wang, P. Loiko, E. Vilejshikova, K. Yumashev, Z. Lin and W. Chen, Opt. Express, 2017, 25, 3682–3693 CrossRef PubMed.
- A. Rudenkov, V. Kisel, A. Yasukevich, K. Hovhannesyan, A. Petrosyan and N. Kuleshov, Opt. Lett., 2016, 41, 5805–5808 CrossRef PubMed.
- P. P. Sorokin and M. J. Stevenson, IBM J. Res. Dev., 1961, 5, 56–58 CrossRef CAS.
- W. Kaiser, C. G. B. Garrett and D. L. Wood, Phys. Rev., 1961, 123, 766–776 CrossRef CAS.
- P. P. Sorokin, M. J. Stevenson, J. R. Lankard and G. D. Pettit, Phys. Rev., 1962, 127, 503–508 CrossRef CAS.
- D. L. Wood and W. Kaiser, Phys. Rev., 1962, 126, 2079–2088 CrossRef CAS.
- A. Yariv, Proc. IRE, 1962, 50, 1699 CAS.
- L. F. Johnson, Proc. IRE, 1962, 50, 1691 CrossRef CAS.
- Z. J. Kiss and R. C. Duncan, Proc. IRE, 1962, 50, 1531 Search PubMed.
- Z. J. Kiss and R. C. Duncan, Proc. IRE, 1962, 50, 1532 CAS.
- R. C. Duncan and Z. J. Kiss, Appl. Phys. Lett., 1963, 3, 23–24 CrossRef CAS.
- D. Jaque and F. Vetrone, Nanoscale, 2012, 4, 4301–4326 RSC.
- X. Wang, Q. Liu, Y. Bu, C.-S. Liu, T. Liu and X. Yan, RSC Adv., 2015, 5, 86219–86236 RSC.
- C. D. S. Brites, P. P. Lima, N. J. O. Silva, A. Millán, V. S. Amaral, F. Palacio and L. D. Carlos, Nanoscale, 2012, 4, 4799–4829 RSC.
- T. Bai and N. Gu, Small, 2016, 1–21 CrossRef CAS PubMed.
- A. Meijerink, J. Nuyten and G. Blasse, J. Lumin., 1989, 44, 19–31 CrossRef CAS.
- A. Lacam and C. Chateau, J. Appl. Phys., 1989, 66, 366–372 CrossRef CAS.
- Y. Y. Luo, D. S. Jo, K. Senthil, S. Tezuka, M. Kakihana, K. Toda, T. Masaki and D. H. Yoon, J. Solid State Chem., 2012, 189, 68–74 CrossRef CAS.
- S. Tezuka, Y. Sato, T. Komukai, Y. Takatsuka, H. Kato and M. Kakihana, Appl. Phys. Express, 2013, 6, 72101 CrossRef.
- C. Yasushita, H. Kato and M. Kakihana, J. Inf. Disp., 2012, 13, 107–111 CrossRef CAS.
- P. F. Smet, I. Moreels, Z. Hens and D. Poelman, Materials, 2010, 3, 2834–2883 CrossRef CAS.
- F. Datchi, A. Dewaele, P. Loubeyre, R. Letoullec, Y. Le Godec and B. Canny, High Pressure Res., 2007, 27, 447–463 CrossRef CAS.
- S. V. Rashchenko, A. Y. Likhacheva and T. B. Bekker, High Pressure Res., 2013, 33, 720–724 CrossRef CAS.
- Q. Jing, Q. Wu, Y. Liu, Y. Zhang, S. Liu, L. Liu, J. Xu and Y. Bi, High Pressure Res., 2013, 33, 725–733 CrossRef CAS.
- H. Liang, Q. Zeng, T. Hu, S. Wang and Q. Su, Solid State Sci., 2003, 5, 465–467 CrossRef CAS.
- R. Stefani, A. D. Maia, E. E. S. Teotonio, M. A. F. Monteiro, M. C. F. C. Felinto and H. F. Brito, J. Solid State Chem., 2006, 179, 1086–1092 CrossRef CAS.
- J. Sun, J. Zhu, X. Liu and H. Du, J. Rare Earths, 2012, 30, 1084–1087 CrossRef CAS.
- S. Sakirzanovas, A. Katelnikovas, D. Dutczak, A. Kareiva and T. Jüstel, J. Lumin., 2012, 132, 141–146 CrossRef CAS.
- P. Solarz, M. Karbowiak, M. Głowacki, M. Berkowski, R. Diduszko and W. Ryba-Romanowski, J. Alloys Compd., 2016, 661, 419–427 CrossRef CAS.
- Z. Cao, X. Wei, L. Zhao, Y. Chen and M. Yin, ACS Appl. Mater. Interfaces, 2016, 8, 34546–34551 CAS.
- W. J. Schipper, A. Meijerink and G. Blasse, J. Lumin., 1994, 62, 55–59 CrossRef CAS.
- J. R. Peterson, W. Xu and S. Dai, Chem. Mater., 1995, 7, 1686–1689 CrossRef CAS.
- R. C. Ropp, in Encyclopedia of the Alkaline Earth Compounds, Elsevier, 2013, pp. 481–635 Search PubMed.
- S. A. Payne, L. L. Chase, W. F. Krupke and L. A. Boatner, J. Chem. Phys., 1988, 88, 6751–6756 CrossRef CAS.
- H. Itoh, S. Arai, T. Sudhaharan, S.-C. Lee, Y.-T. Chang, S. Ishiwata, M. Suzuki and E. B. Lane, Chem. Commun., 2016, 52, 4458–4461 RSC.
- M. Suzuki, V. Tseeb, K. Oyama and S. Ishiwata, Biophys. J., 2007, 92, L46–L48 CrossRef CAS PubMed.
- F. Vetrone, R. Naccache, A. Zamarrón, A. J. De La Fuente, F. Sanz-Rodríguez, L. M. Maestro, E. M. Rodriguez, D. Jaque, J. G. Sole and J. A. Capobianco, ACS Nano, 2010, 4, 3254–3258 CrossRef CAS PubMed.
- H. Peng, M. I. J. Stich, J. Yu, L. N. Sun, L. H. Fischer and O. S. Wolfbeis, Adv. Mater., 2010, 22, 716–719 CrossRef CAS PubMed.
- A. Siaï, P. Haro-González, K. Horchani-Naifer and M. Férid, Sens. Actuators, B, 2016, 234, 541–548 CrossRef.
- G. Jiang, X. Wei, Y. Chen, C. Duan, M. Yin, B. Yang and W. Cao, Mater. Lett., 2015, 143, 98–100 CrossRef CAS.
- P. Rodríguez-Sevilla, Y. Zhang, P. Haro-González, F. Sanz-Rodríguez, F. Jaque, J. G. Solé, X. Liu and D. Jaque, Adv. Mater., 2016, 28, 2421–2426 CrossRef PubMed.
- L. Marciniak, A. Bednarkiewicz, J. Drabik, K. Trejgis and W. Strek, Phys. Chem. Chem. Phys., 2017, 19, 7343–7351 RSC.
| This journal is © The Royal Society of Chemistry 2017 |

