DOI:
10.1039/C7RA01261F
(Paper)
RSC Adv., 2017,
7, 15823-15832
A solvent free method of analysis to rapidly determine trace levels of ten medium and low brominated diphenyl ethers in soil pore water
Received
30th January 2017
, Accepted 6th March 2017
First published on 10th March 2017
Abstract
A solvent free method of analysis for rapid simultaneous determination of ten medium and low brominated diphenyl ethers at trace levels in soil pore water by headspace solid phase microextraction coupled with gas chromatography equipped with an electron capture detector was developed. Extraction conditions such as desorption time, polydimethylsiloxane thickness, ionic strength, temperature, stirring and extraction time were carefully studied and optimized. In addition, the effects of pH and dissolved organic matter on headspace solid phase microextraction were thoroughly studied. For the ten medium and low brominated diphenyl ethers in this study, the limits of detection ranged from 0.04 to 1.20 ng L−1, and the relative standard deviations were lower than 10.00%. Soil pore water from red soil, yellow-brown soil and black soil was quantitatively analyzed with recoveries ranging from 80.40% to 108.90%, and from 85.9% to 108.45% at 50 ng L−1 and 200 ng L−1, respectively.
1. Introduction
Recent studies have shown that polybrominated diphenyl ethers (PBDEs), which are one of the three major flame retardants in the world and widely embedded in products such as building materials, electrical appliances, plastics compounds and textiles, are semi-volatile organic compounds (SVOCs) with the potential to cause harm to the environment and human health.1,2 In 2004, PBDEs were banned in Europe, and in 2009 they were listed as persistent organic pollutants (POPs) by the Stockholm Convention because of their persistence, bioaccumulation and toxicity. Unfortunately, the degree of PBDEs pollution is still increasing because of their continued use in Asia,3 as well as their persistence and transference in ecosystems. Medium and low brominated diphenyl ethers (MALBDEs) have much higher bioavailability and can easily undergo long-range transport in the environment and move up food chains4 because of their physicochemical properties, such as lower vapor pressure. Some toxicological studies have also revealed that MALBDEs had seriously adverse effects on animal health. Chevrier et al.5 reported that verbal comprehension and working memory were lower in children with early-life exposure to higher BDE-99 concentrations in indoor environments. Moreover, the European Chemical Bureau (ECB) has reported that high brominated congeners are less toxic than low brominated congeners of PBDEs. In addition, recent findings have indicated that high brominated congeners can be metabolically transformed and degraded to low and medium brominated congeners through reductive debromination.6 As a result, the possibility of their risk to human health and the environment is comparably higher, indicating that the environmental effects of MALBDEs should be focused on.
Soil, which is a major environmental reservoir for MALBDEs7 and natural habitat of animals and plants, has been severely polluted through human activities. Li et al.8 reported that the total concentrations of PBDEs in the topsoil in Shandong province ranged from 17.0 to 146 μg g−1 dry weight (dw), with a mean value of 58.7 μg g−1 (dw), while Ming-Hong Wu9 also showed that the concentrations of PBDEs ranged from 4.68 to 174.7 ng g−1 dry weight (dw) in Shanghai soil, possibly because of the high number of electronics factories in these regions. Soils have also been found to be secondary emission sources of MALBDEs, as these compounds can constantly be desorbed into soil pore water and then be absorbed by plants or animals. Accordingly, a great quantity of MALBDEs could be transferred to humans through food chains, which threatens human health. Many studies10 have shown that freely dissolved part are the most bioavailable fraction of POPs in soil and sediment, and this fraction of POPs is commonly used to assess whether soils are at risk of bioconcentration or not. However, the concentration of MALBDEs in soil pore water is often at trace levels that are too low to detect because of the lipophilicity with low solubility and the relatively small amount of free MALBDEs, which has hindered research. According to Carter,11 the higher concentration of contaminants was set in his study because trace level of POPs were hard to detect in the soil pore water. Thus, detection of the trace quantity of MALBDEs in soil pore water is important for monitoring and assessing the risk of MALBDEs in soil.
Nevertheless, few studies have investigated methods of measuring MALBDEs in soil pore water. Conventional techniques including liquid–liquid extraction (LLE), accelerated solvent extraction (ASE), Soxhlet extraction and solid phase extraction (SPE) may enable determination of MALBDEs in soil pore water. However, these techniques are hindered by many practical issues, such as time-consuming, the need for large sample volumes, the occurrence of secondary pollution because of the use of organic solvents, and difficulties associated with purification and enrichment. Moreover, most MALBDEs in soil pore water are found at the nanograms per liter level, which is below the limit of detection for conventional methods.12
Solid phase microextraction (SPME)13–15 technology is a solvent-free technology that integrates sampling, concentration, and clean-up has rapidly developed in recent years and has the potential to overcome the aforementioned problems.16 In addition, headspace solid phase microextraction (HS-SPME)17 technology is the optimum mode of SPME for interference-free sampling. In this method, the extraction of analytes avoids direct contact by coating fibers with matrixes, which can prolong the lifespan of SPME fiber, remove purification process.18 HS-SPME coupled with an ECD detector has been implemented to reduce the cost relative to mass spectrometry.
Here, a solvent free method of analysis, head space-solid phase microextraction coupled with GC-ECD, was established for the simultaneous determination of trace levels of ten MALBDEs in soil pore water.
2. Materials and methods
2.1 Materials and reagents
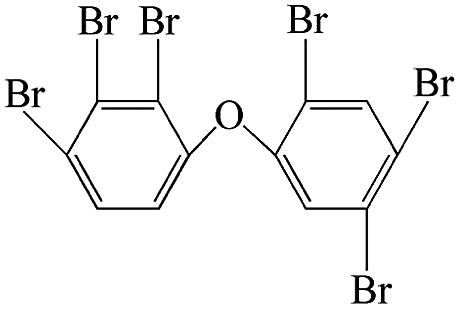
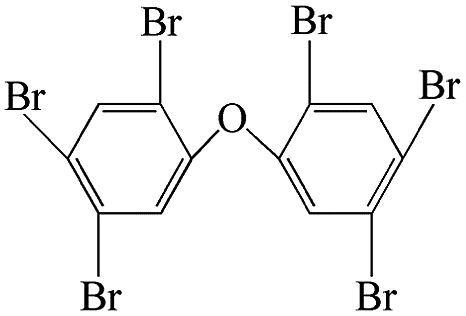
Ten analytes including 2,4-dibromodiphenyl ether (BDE-7, 98.5% purity), 4,4′-dibromodiphenyl ether (BDE-15, 98.5% purity), 2,4,4′-tribromodiphenyl ether (BDE-28, 97.9% purity), 3,3′,4-tribromodiphenyl ether (BDE-35, 98.5% purity), 2,2′,4,4′-tetrabromodiphenyl ether (BDE-47, 98.5% purity), 2,4,4′,6-tetrabromodiphenyl ether (BDE-75, 98.5% purity), 2,2′,3,4,4′-pentabromodiphenyl ether (BDE-85, 98.5% purity), 2,3,4′,5,6-pentabromodiphenyl ether (BDE-117, 98.5% purity), 2,2′,3,4,4′,5′-hexabromodiphenyl ether (BDE-138, 98.5% purity), and 2,2,4,4,5,5-hexabromo-diphenyl ether (BDE-153, 98.6% purity) were stocked in isooctane at 50 mg L−1 and used for identification, quantification and investigation of the HS-SPME method. All of these analytes were purchased from Accustandard Inc. (New Haven, CT, USA). The basic physicochemical properties of the above analytes are shown in Table 1. Working standard solutions for the external standard curve of analytes and investigation of the HS-SPME method were prepared with n-hexane by serially diluting stock solutions from 50 to 1000 μg L−1. All stock and working standards were stored at 4 °C until analysis. Chromatographic grade acetone and n-hexane were obtained from Merck KGaA (Darmstadt, Germany). Technical grade humic acid was purchased from Sigma-Aldrich (Saint Louis, MO, USA). Highly pure water (R ≥ 18 MΩ) used throughout the study was prepared using a Millipore water purification system (MilliQ Water, Molsheim, France). Soils were obtained from a depth of 10–20 cm in Heilongjiang, Henan and Jiangxi provinces and the basic physicochemical properties of the three test soils were shown in Table 2. The polydimethylsiloxane (PDMS) coating of fiber, as a nonpolar substance, has been used for extracting hydrophobic organic contaminants (HOCs) and the manual holder, used in this study for extraction MALBDEs, were purchased from Supelco (Bellefonte, PA, USA). MS400 magnetic agitator was obtained from Bante (Shanghai, China).
Table 1 Some physicochemical properties of selected medium and low brominated diphenyl ethers investigated in this study
| Medium and low brominated diphenyl ethers |
Structural formula |
lgHa37 |
Kowb |
Swc (298 K) (mg L−1) |
| Henry's law constant. Octanol–water partition coefficients. Aqueous solubility. |
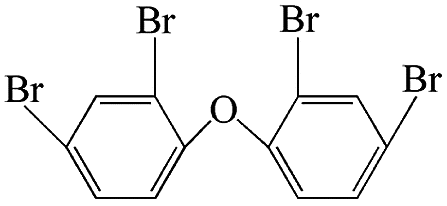
| 2,4-Dibromo diphenyl ether |
 |
9.343 |
— |
— |
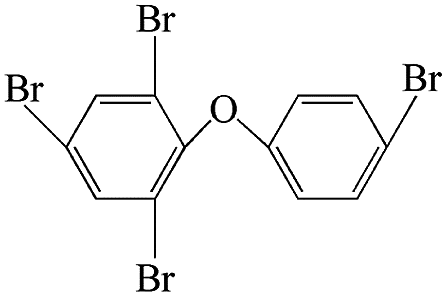
| 4,4′-Dibromo diphenyl ether |
 |
5.978 |
5.55 (ref. 38) |
0.216 ± 0.03 (ref. 39) |
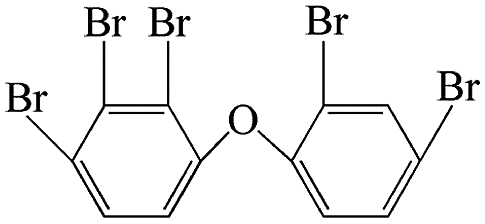
| 2,4,4′-Tribromo diphenyl ether |
 |
4.816 |
5.94 ± 0.15 (ref. 40) |
0.07 ± 0.01 (ref. 38) |
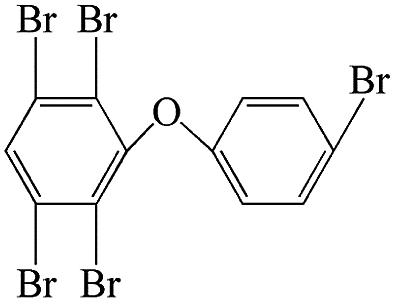
| 3,3′,4-Tribromo diphenyl ether |
 |
6.647 |
— |
— |
| 2,2′,4,4′-Tetrabromo diphenyl ether |
 |
0.843 |
6.81 ± 0.08 (ref. 40) |
1.47 × 10⁻² ± 0.09 (ref. 39) |
| 2,4,4′,6-Tetrabromo diphenyl ether |
 |
3.002 |
— |
— |
| 2,2′,3,4,4′-Pentabromo diphenyl ether |
 |
3.414 |
7.37 ± 0.12 (ref. 40) |
0.006 ± 0.0001 (ref. 38) |
| 2,3,4′,5,6-Pentabromo diphenyl ether |
 |
3.868 |
— |
— |
| 2,2′,3,4,4′,5′-Hexabromo diphenyl ether |
 |
2.914 |
7.91 (ref. 38) |
— |
| 2,2′,4,4′,5,5′-Hexabromo diphenyl ether |
 |
0.348 |
7.90 ± 0.14 (ref. 40) |
5.04 × 10⁻⁵ ± 0.27 (ref. 39) |
Table 2 Physicochemical properties of soils used in this study
| |
Red soil |
Yellow-brown soil |
Black soil |
| pH |
5.11 |
8.05 |
6.26 |
| Organic matter (%) |
1.78 |
2.54 |
3.14 |
| Total C (%) |
1.03 |
1.47 |
1.82 |
| Total N (%) |
0.1 |
0.12 |
0.15 |
| Total P (%) |
0.07 |
0.08 |
0.05 |
| Total K (%) |
0.86 |
1.04 |
0.75 |
| Clay (%) |
52.9 |
22.9 |
30.3 |
| Silt (%) |
23.8 |
31.4 |
21.6 |
| Sand (%) |
23.3 |
45.7 |
48.1 |
| Pore water dissolved organic carbon (mg L−1) |
23.1 |
30.6 |
17.1 |
2.2 Preparation of soil pore water
Testing soils were air-dried, gently ground and sieved to 1 mm to ensure homogeneity, then stored at 4 °C prior to use. The soil pore water was collected using a modified method.19,20 In brief, 50 g of soil (dry weight) was spiked with 50 mL of highly pure water containing 0.01 M calcium chloride and 10 mM sodium azide in a 250 mL conical flask covered with aluminum foil to avoid photolysis, then mixed at 160 rpm for 48 h using a mechanical shaker. Next, the soil slurry was homogenized, placed in centrifuge tubes and centrifuged at 1448 g for 30 minutes using a Sigma 2–16 K centrifugal machine obtained from Germany. Collecting the supernatant from two-phase sample, filtered with 0.45 μm pore diameter polycarbonate membranes using a vacuum pump purchased from GAST (Chicago, IL, USA) and stored at 4 °C before analysis. A sub-sample of 30 mL soil pore water was spiked with the ten MALBDEs to determine the recovery of real samples by the HS-SPME method. Another sub-sample of 20 mL of soil pore water was used to measure the dissolved organic carbon (DOC) level, which was accomplished with a Multi N/C 3100(Jena, Germany).21 All treatments were repeated three times.
2.3 Process of headspace solid phase microextraction
The polydimethylsiloxane (PDMS) coating of fiber and the manual holder used to acquire the proper exposure depth were assembled according to the device description of manual holder, after which the fibers were conditioned with nitrogen protection in the pre-injector of an Agilent 6890 at 280 °C for 30 minutes. Following conditioning, the steel tube of the fiber, to protect the PDMS coating from mechanical damage, was inserted into a 20 mL amber vial that sealed with a polyethylene and silicone polytetrafluoroethylene (PTFE)-faced septum cap (CNW Technologies; Düsseldorf, Germany) and containing a magnetic rotor covered with PTFE for stirring the sample solution. Then the PDMS coating was exposed to the surface samples at fixed temperature and agitation for a time. Finally, the fiber bound with the PDMS coating contracted in the steel tube, at which time it was quickly removed from the amber vial and directly inserted into the injection port of the Agilent 6890 to induce thermal desorption at 280 °C.
2.4 Instrumentation and conditions
An Agilent 6890 (Santa Clara, CA, USA) gas chromatograph equipped an electron capture detector (GC-ECD) and an HP 7683 auto-sampler was used for the qualitative and quantitative analysis of PBDEs. A HP-5MS capillary column (30.0 m length × 0.25 mm inside diameter × 0.25 μm film thickness) coated with 5% phenyl methyl siloxane was used for the separation of selected MALBDEs. Ultra-pure nitrogen (purity > 99.999%) was applied as carrier and makeup gas at a flow rate of 2.9 mL min−1 and 60 mL min−1, respectively. The injection port was maintained at 280 °C, and then switched into splitless mode. The oven temperature was programmed as follows: initial temperature 60 °C (3 min), followed by an increase to 240 °C at a rate of 30 °C min−1, where it was held for 1 min, then increased to 260 °C at a rate of 10 °C min−1, where it was held for 1 min, followed by a further increase to 280 °C at a rate of 5 °C min−1, where it was held for 1 min, and then finally an increase to 300 °C at a rate of 15 °C min−1, which was held for 11 min. The temperature of the ECD was fixed at 300 °C.
3. Results and discussion
3.1 Multivariate optimization of headspace solid phase microextraction
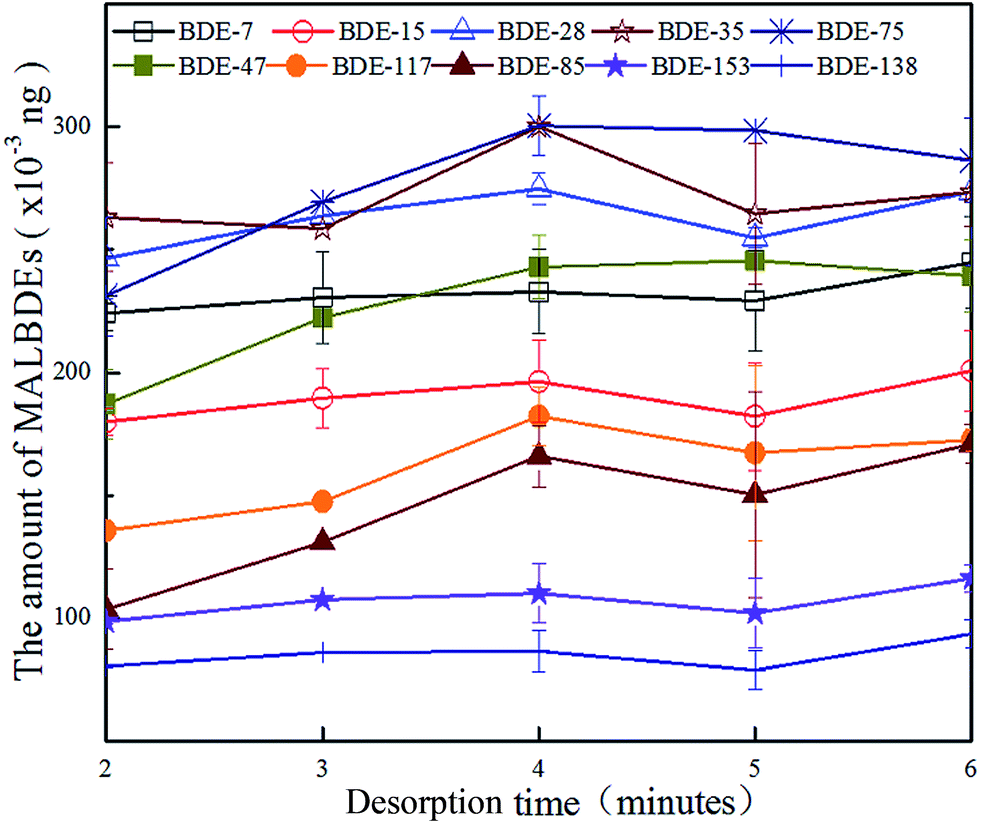
3.1.1 Optimization of desorption time. Previous researchers reported that there are comparable variables on the desorption time of analytes because of different affinity with the same coating, which may result in the incomplete desorption of partial analytes under a selected desorption time.17,22 Thus, in this study, the thermal desorption time in the GC injector to achieve complete release of MALBDEs trapped from samples during the process of extraction was explored in the range two to six minutes with a desorption temperature of 280 °C, which was recommended as the maximum working temperature. However, as shown in Fig. 1, there were no dramatic differences in the desorption quantities from four to six minutes among all tested MALBDEs (p < 0.01). Specifically, they were all quickly released at 280 °C in four minutes, although with great differences in the physicochemical properties. The desorption quantity of partly MALBDEs at two and three minutes was slightly lower, possibly because of incomplete release. Thus, to ensure complete release from fiber, four minutes were selected as the optimum desorption time for later studies.
 |
| | Fig. 1 Influence of desorption time in the GC injector on the amount of desorbed medium and low brominated diphenyl ethers. | |
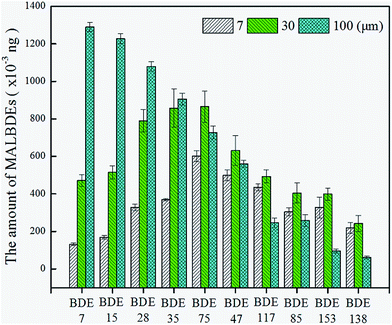
3.1.2 Optimization of polydimethylsiloxane thickness. Polydimethylsiloxane (PDMS) coatings currently in use are applied in thicknesses of 7 μm, 30 μm and 100 μm. Some previous studies revealed that the amount of analytes extracted from coatings of different thickness varied.23,24 Thus, in this study, the impact of the PDMS coating's thickness on the amount of trapped PBDEs was investigated in the presence of 7, 30 and 100 μm. As shown in Fig. 2, the amount of MALBDEs extracted from coatings with a thickness of 30 μm was higher than those at 7 μm; and the quantities of BDE-75 to BDE-138 were still higher at a thickness of 100 μm. For low brominated diphenyl ethers, desorption was predominant at 80 °C. This may have occurred because the temperature inside the thicker coating was lower and the desorption route was longer, resulting in the trapped quantity increasing with the addition of coating thickness. For medium brominated diphenyl ethers, the absorption process was predominant and the quantity absorbed was higher with thicker PDMS coatings at a temperature of 80 °C. However, the route of absorption was longer when the PDMS coating was thicker. Thus, the results showed that 30 μm was the optimum thickness of the PDMS coating for extraction of medium brominated diphenyl ethers; therefore, this thickness was used for the remainder of the experiments.
 |
| | Fig. 2 Influence of thickness of polydimethylsiloxane coating on the amount of trapped medium and low brominated diphenyl ethers. | |
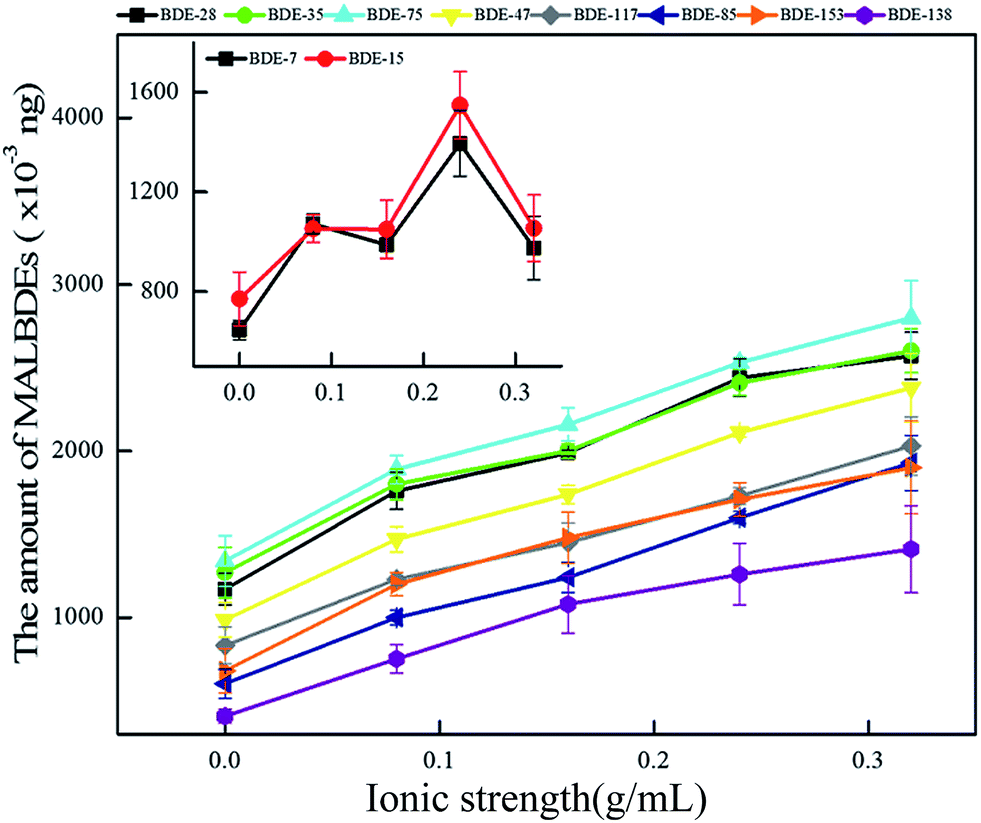
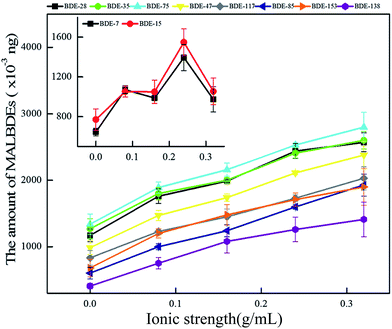
3.1.3 Optimization of ionic strength. Ionic strength is an important influencing factor because of its effect on the solubility of hydrophobic organic contaminants (HOC); accordingly, it is commonly investigated in the field using the SPME method.25–27 Thus, the HS-SPME method proposed herein may be affected by changes in ionic strength. In this study, exploratory experiments were conducted in the presence of 0, 0.08, 0.16, 0.24 and 0.32 g mL−1 sodium chloride (NaCl) solution as a model substance, which is commonly used to investigate the effects of ionic strength. As shown in Fig. 3, the extraction quantity of MALBDEs was all strongly affected by increasing NaCl concentrations. From BDE-28 to BDE-138, the extraction quantity was constantly enhanced by the addition of NaCl from 0 to 0.24 g mL−1, and the differences of partly MALBDEs among all tested NaCl concentration even were significant such as BDE-75 (p < 0.01). Taking BDE-75 as an example, the extraction quantity with a NaCl concentration of 0.32 g mL−1 was 2.1 times higher than that without the addition of NaCl. However, the changes in BDE-7 and BDE-15 differed from those observed for the other fractions. These results can be clarified using theories of salt out and salt in. In this study, the NaCl molecules added were instantly surrounded with a layer of water molecules, which resulted in the dissolution of MALBDEs and subsequent formation of hydration spheres. Specifically, the amount of water molecules available to dissolve MALBDEs decreased, which led to further suppression of the dissolution process of MALBDEs. Therefore, the transfer of MALBDEs from the liquid phase to the gas phase was accelerated, after which the amount of MALBDEs in the gas phase increased. However, previous study has shown28 that salt ions also may generate electrostatic interactions with other ions in solution, which may reduce the quantity of MALBDEs extracted by the HS-SPME method. MALBDEs are weak-poplar substances, and have a lower degree of ionization with increasing bromine atoms.27 As a result, for BED-7 and BDE-15, the maximum extraction quantity that could be obtained with the salt concentration was 19.4% (W/V) because the effect of salt out is predominant when the NaCl concentration reaches 24.2%. In addition, to study the movement of water, which can shorten the life span of HS-SPME fibers by swelling the PDMS coating, we also investigated changes in the surface tension with the addition of NaCl. The results showed that the addition of NaCl can augment surface tension, which further protects the fiber from hindering the up-migration of water. Therefore, the NaCl concentration of 0.32 g mL−1 was selected for further analysis.
 |
| | Fig. 3 Influence of ionic strength on the amount of trapped medium and low brominated diphenyl ethers. | |
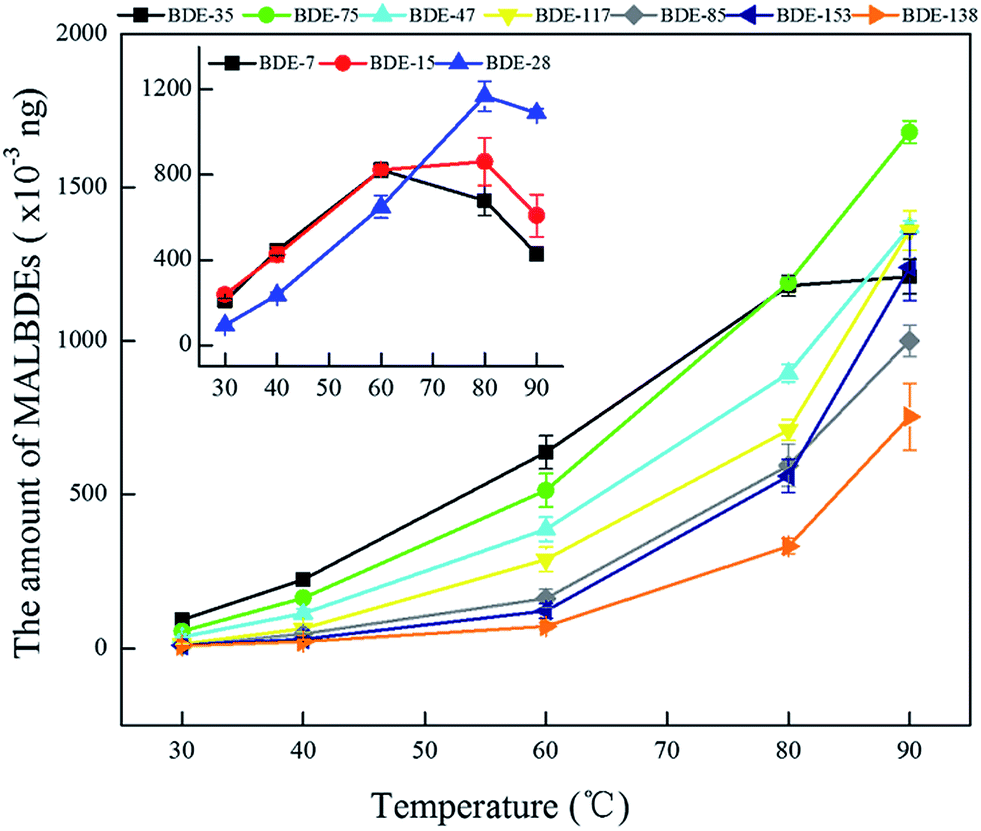
3.1.4 Optimization of temperature. The HS-SPME method is based on the theory of diffusion, which is always divided into three processes, the diffusion of analytes into the aqueous phase, gas phase and PDMS coating. Many previous studies have reported that the diffusion constant and Henry's law constant could be dramatically promoted as temperature increased.29 In this study, the influence of temperatures ranging from 30 °C to 95 °C was investigated. As shown in Fig. 4, from BDE-35 to BDE-138, the extraction quantities all increased continuously with increasing temperature. Taking BDE-75 as an example, the extraction quantity at 95 °C was 30.4 times higher than that at 30 °C. However, for BDE-7, BDE-15 and BDE-28, the extraction quantity initially increased, then decreased, which is in line with the results of a previous study.17 The phenomenon mentioned above can be explained by the release process of these congeners from the PDMS coating. Initially, the diffusion rate of MALBDEs in both the liquid and gas phase increased because thermal energy is partly transformed to kinetic energy as temperature increases, and Henry's law constant also was promoted. Thus, the amount of extraction was increased. However, as temperature continued to increase, the low brominated diphenyl ethers were desorbed little by little from the PDMS coating because of slight affinity with coating. When the release process was predominant, the results obtained showed reductions in extraction of compounds such as BDE-7 at 80 °C, and the degree of reduction was found to have a partial negative relationship with the number of bromine atoms. In general, for ten analytes, the optimum extraction temperature was 60 °C, 80 °C and 95 °C, respectively. Moreover, water vapour also increased with increasing temperature, which accelerated swelling of the PDMS coating. For the simultaneous detection of the ten analytes and swelling, we set the optimum temperature at 80 °C for the subsequent experiments.
 |
| | Fig. 4 Influence of the temperature on the amount of trapped medium and low brominated diphenyl ethers. | |
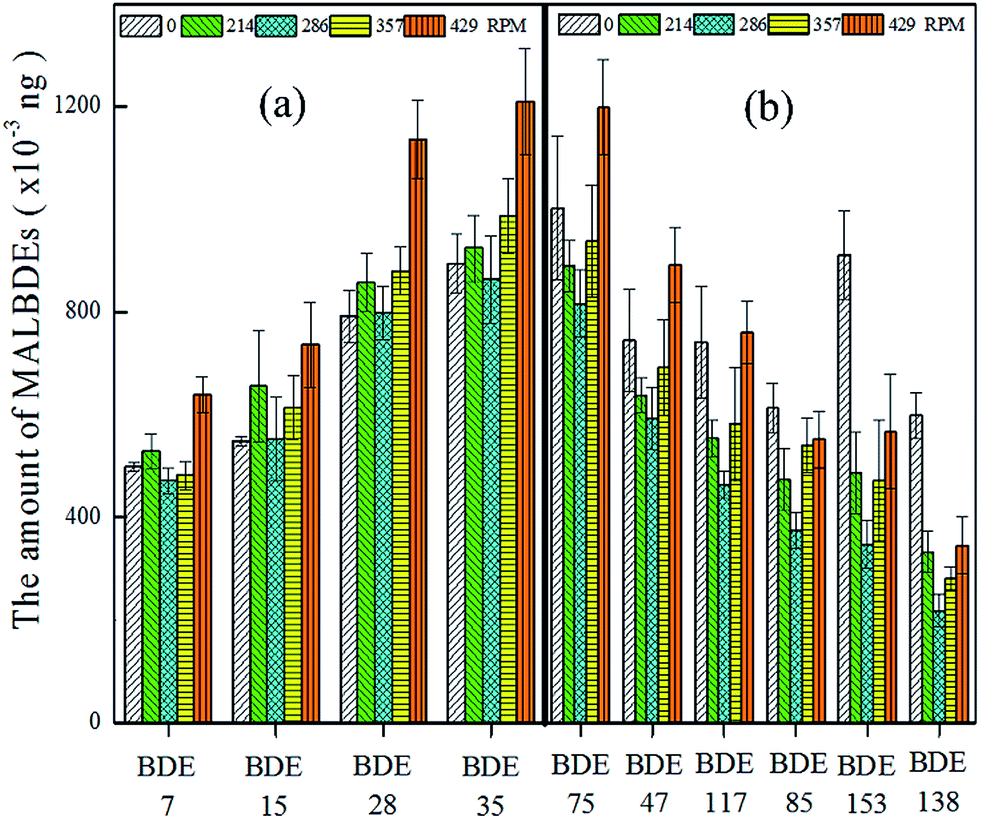
3.1.5 Optimization of stirring. It has been reported that the HS-SPME method does not consider the impact of stirring on the extraction quantity of analytes, despite the potential for it to directly influence the distribution of MALBDEs in samples. In this study, the effects of stirring at 0, 214, 286, 357 and 429 rpm were explored. Interestingly, as shown in Fig. 5(a), for BDE-7, BDE-15, BDE-28 and BDE-35, the amount absorbed initially increased, then decreased, after which they ascended again. In Fig. 5(b), the levels of the other congeners decreased from 0 to 357 rpm, and then increased from 357 to 429 rpm. These results can likely be explained by the theory of the distribution vacancy complement. In general, when a portion of a group of analytes is volatilized to the gas phase from the surface of a sample, the remainder would be redistributed through gradient diffusion to fill up the vacancies. However, for MALBDEs, it is relatively difficult to escape from the water to the gas phase; therefore, it does not need to be stirred to cover the vacancies. When the experiment was conducted with certain stir, MALBDEs would constantly redistribute through mass flow, which further restrain the transfer of MALBDEs from liquid to gas phase. The extraction quantity was increased at 429 rpm, possibly because of the increase in contact area caused by the large eddy current, but also because stirring may have resulted in splashing onto the surface of the PDMS coating, thereby reducing the precision of the results. Therefore, we selected 0 rpm as the basic condition for further experiments.
 |
| | Fig. 5 Influence of stirring on the amount of trapped medium and low brominated diphenyl ethers. | |
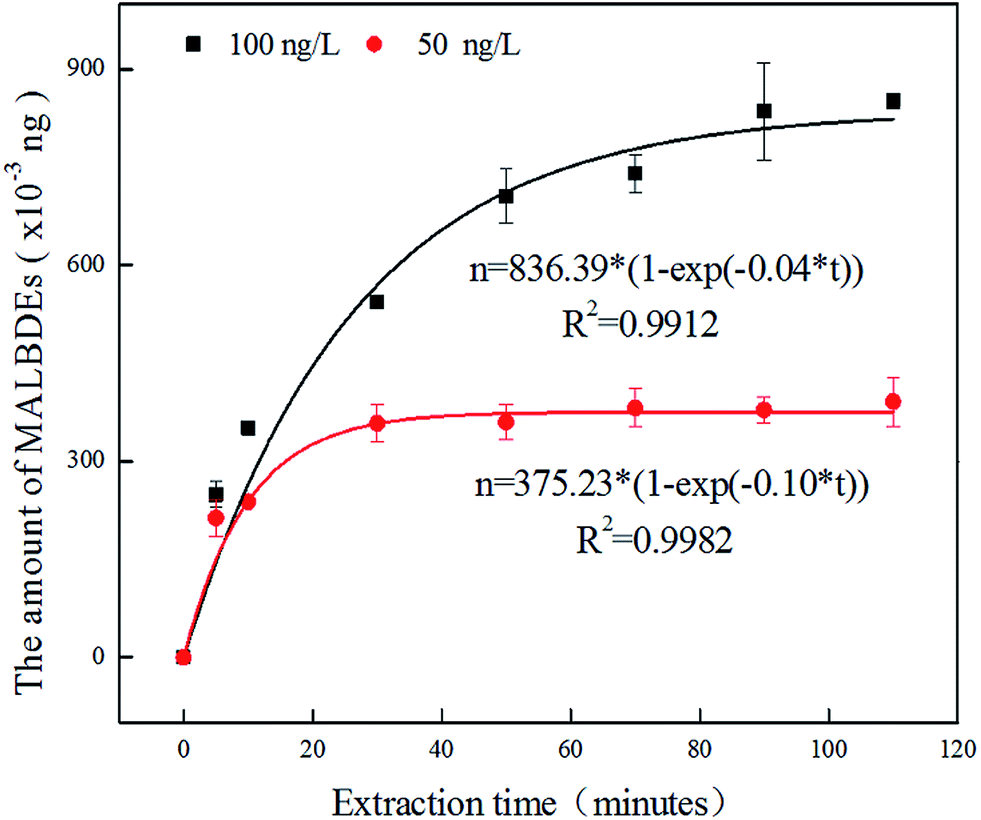
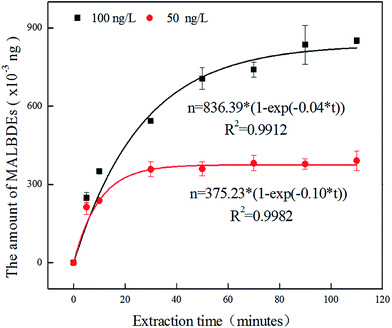
3.1.6 Optimization of extraction time. Extraction time is another pivotal factor influencing the HS-SPME method; therefore, it is commonly investigated to evaluate its strength on extraction quantity.30 As show in Fig. 6, take BDE-47 for example, equilibrium was attained in 100 minutes at a concentration of 100 ng L−1, while equilibrium was attained more quickly when there were lower levels in the sample (e.g., 50 ng L−1). Taking the equilibrium time, efficiency, detection line, trace level and GC-ECD detection time into account, the extraction time was set at 30 minutes for the developed method.
 |
| | Fig. 6 Extraction quantity of 2,2′,4,4′-tetrabromo diphenyl ether at 50 ng L−1 and 100 ng L−1, respectively, with increasing extraction time. | |
3.2 Effect of interference factors on headspace solid phase microextraction
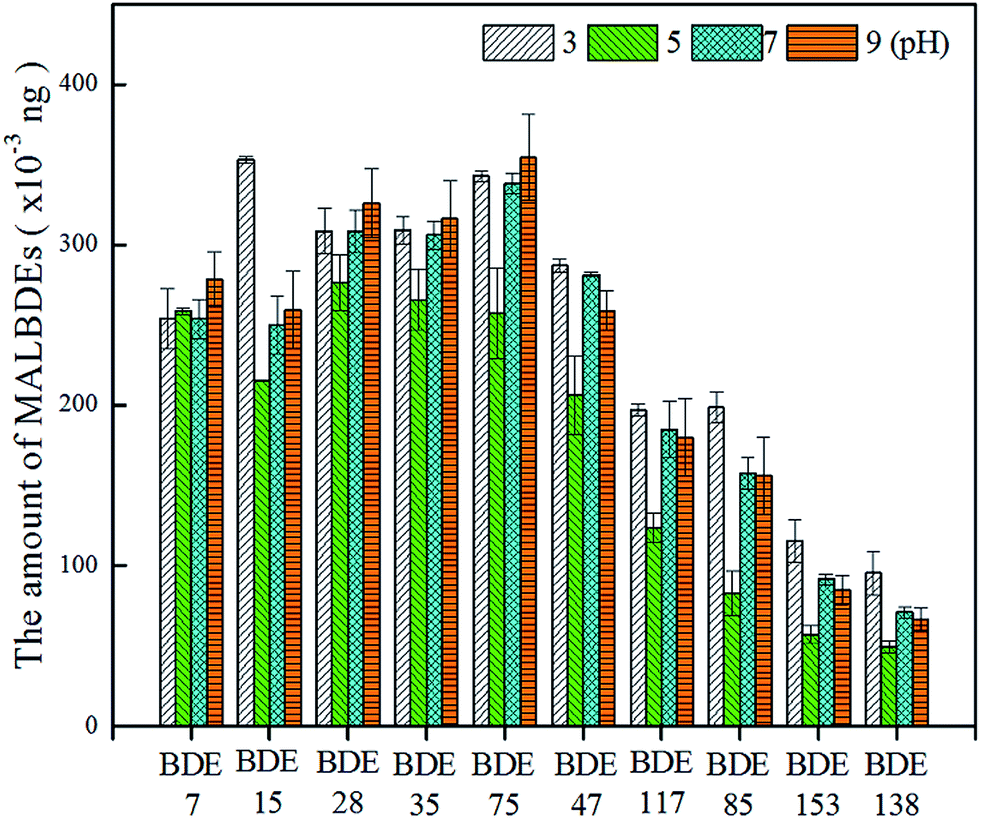
3.2.1 Effect of sample pH value. Some studies have considered the pH is an influential factor on the extraction of analytes by SPME31,32 because the pH of actual samples varies. The soil pore water collected for the present study also has various pH values, which may have influenced the quantity of MALBDEs extracted. Fig. 7 summarizes the effects of pH values ranging from three to nine on extraction quantity. The results revealed that pH had indeed influence the extraction of MALBDEs to a certain degree, although no clear patterns were observed. Thus, the pH value should be standardization. For convenience, the pH was set at seven for subsequent analyses.
 |
| | Fig. 7 Effects of pH on the amount of trapped medium and low brominated diphenyl ethers. | |
3.2.2 Effect of humic acid. The pore water obtained from soil contains dissolved organic matter (DOM) that could interact with and adsorb POPs such as MALBDEs. Accordingly, it is important to study whether free-MALBDEs in soil pore water are further transformed to bound-MALBDEs during the process of extraction with the presence of DOM. In this study, we investigated the effects of interference by DOM on the extraction quantity of MALBDEs using a solution of humic acid (HA), as a model substance, from 0 to 100 mg L−1. The results revealed that DOM do not interfere with the detection of MALBDEs. Indeed, the extraction quantity did not vary significantly (p < 0.01), even at 100 mg L−1. This may have been because of the short extraction time of 30 minutes and the temperature of 80 °C, which resulted in weak interaction and adsorption. Hence, DOM did not interfere with determination of MALBDEs in soil pore water by SPME.
3.3 Evaluation of method performance
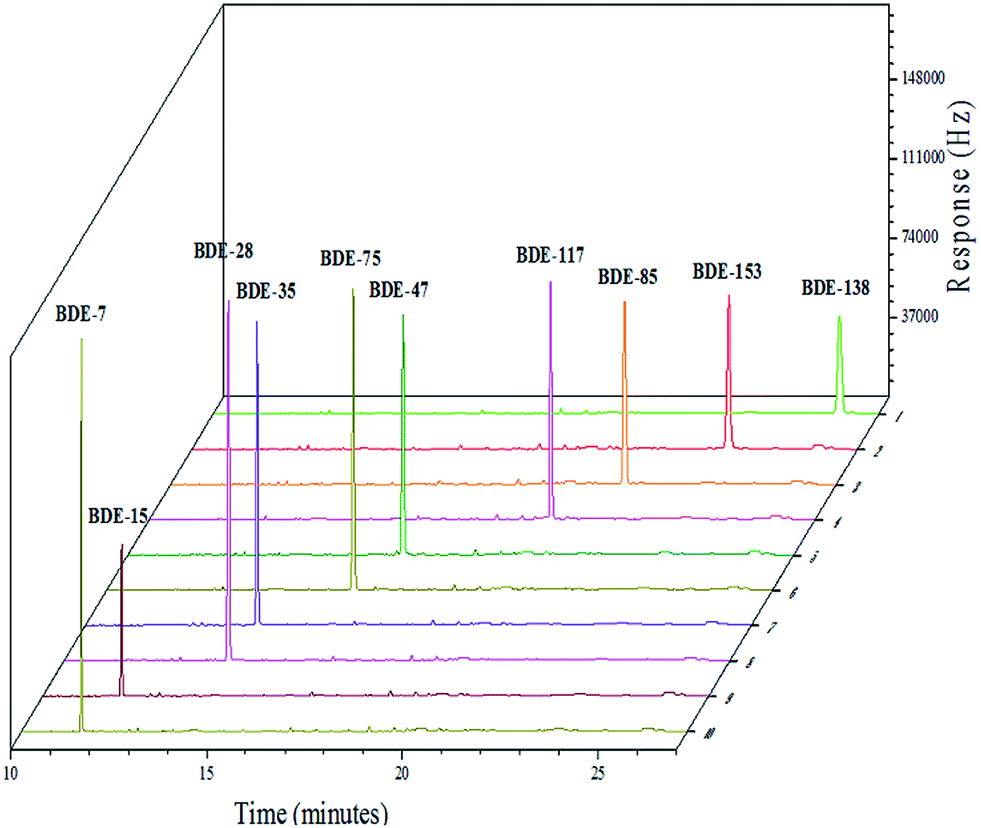
A series of experiments were conducted under the optimum conditions established for the HS-SPME-GC-ECD process to validate the performance of the proposed method based on the linear dynamic range (LDR), limit of detection (LOD), limit of quantification (LOQs), and repeatability. Results obtained and summarized are listed in Table 3. Investigation of the LDR by extracting the spiked MALBDEs with ultrapure water at concentrations of 5–200 ng L−1 revealed good linearity (R2 > 0.9960). Fig. 8 shows the chromatogram of 1.0 mg L−1 MALBDEs. The LOD values ranged from 0.04 to 1.2 ng L−1 (calculated on the basis of 3 times of signal-to-noise ratio), while the LOQ values ranged from 0.13 to 4.02 ng L−1 (calculated on the basis of 10 times of signal-to-noise ratio). Moreover, good reproducibility was obtained for samples spiked with 10 ng L−1 using a single fiber, with relative standard deviations (RSDs) found to range from 1.60 to 10.00%. Overall, these findings indicate that the proposed method has excellent reproducibility and high sensitivity for simultaneous determination of the trace levels of the ten investigated MALBDEs.
Table 3 Analytical performance of ten medium and low brominated diphenyl ethers by headspace solid phase microextraction coupled with gas chromatography equipped with an electron capture detector
| Compound |
Linear range (ng L−1) |
R2 |
LOD (ng L−1) |
LOQ (ng L−1) |
RSD% (c = 10 ng L−1, n = 6) |
| BDE-7 |
5–200 |
0.9986 |
0.39 |
1.29 |
6.5 |
| BDE-15 |
5–200 |
0.9980 |
0.30 |
1.01 |
10.0 |
| BDE-28 |
5–200 |
0.9964 |
0.04 |
0.13 |
2.2 |
| BDE-35 |
5–200 |
0.9971 |
0.05 |
0.16 |
1.6 |
| BDE-75 |
5–200 |
0.9980 |
0.68 |
2.28 |
4.3 |
| BDE-47 |
5–200 |
0.9979 |
0.99 |
3.29 |
3.6 |
| BDE-117 |
5–200 |
0.9988 |
0.49 |
1.63 |
4.3 |
| BDE-85 |
5–200 |
0.9998 |
0.23 |
0.76 |
5.8 |
| BDE-153 |
5–200 |
0.9963 |
1.20 |
4.02 |
7.0 |
| BDE-138 |
5–200 |
0.9960 |
0.50 |
1.66 |
8.7 |
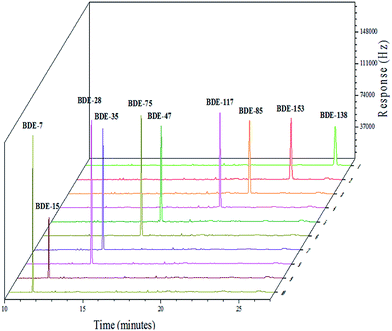 |
| | Fig. 8 Chromatogram of 1.0 mg L−1 medium and low brominated diphenyl ethers. | |
3.4 Comparison with previous methods
In this study, the method developed based on HS-SPME-GC-ECD was compared with other methods for determination of MALBDEs (Table 4). As shown in Table 4, measurement of BDE-28, BDE-47, BDE-85, BDE-138 and BDE-153 has been investigated using different methods, but no methodological investigations of BDE-7, BDE-15, BDE-35, BDE-75 and BDE-117 have been reported. Moreover, the LODs of MALBDEs obtained from the proposed method were lower than those based on TA-IL-DLLME-HPLC,32 SFOME-HPLC,33 DLLME-HPLC,12 LC/NI-APPI/MS/MS,34 SBSE-GC-MS4 and MWCNT-HS-SPME-GC-ECD,35 but slightly higher than that observed for SPE-DLLME-GC-ECD.36 This is because the proposed method was applied to simultaneously determine ten kinds of MALBDEs. Namely, the LOD of this method could be further reduced still by adjusting the conditions investigated in this study when the measured kinds of MALBDEs were less. Moreover, when compared to SPE-DLLME-GC-ECD, the developed method did not use organic solvent, and consisted of a simple process with smaller labour and time costs.
Table 4 The LODs of the developed method was compared with those reported in the previous studies
| Methods |
Analytes (ng L−1) |
| BDE-7 |
BDE-15 |
BDE-28 |
BDE-35 |
BDE-47 |
BDE-75 |
BDE-85 |
BDE-117 |
BDE-138 |
BDE-153 |
| Temperature-assisted ionic liquid dispersive liquid–liquid microextraction-high performance liquid chromatography. Solidified floating organic drop microextraction-high performance liquid chromatography. Dispersive liquid–liquid microextraction-phase-high performance liquid chromatography. Solid-phase extraction-dispersive liquid–liquid microextraction-gas chromatography-electron capture detector. Liquid chromatography-negative ion atmospheric pressure photoionization tandem mass spectrometry. Stir bar sorptive extraction-gas chromatography-mass spectrometry. Multiwalled carbon nanotube fibers-headspace solid phase microextraction-gas chromatography with electron-capture detection. |
| TA-ILDLLME-HPLCa |
— |
— |
— |
— |
100 |
— |
— |
— |
— |
— |
| SFOME-HPLCb |
— |
— |
10 |
— |
10 |
— |
— |
— |
— |
— |
| DLLME-HPLCc |
— |
— |
12.4 |
— |
55.6 |
— |
— |
— |
— |
— |
| SPE-DLLME-GC-ECDd |
— |
— |
0.03 |
— |
0.06 |
— |
0.15 |
— |
— |
0.13 |
| LC/NI-APPI/MS/MSe |
— |
— |
— |
— |
10.9 |
— |
|
— |
— |
0.5 |
| SBSE-GC-MSf |
— |
— |
0.4 |
— |
0.3 |
— |
2.4 |
— |
3.3 |
5.4 |
| MWCNT-HS-SPME-GC-ECDg |
|
|
1.1 |
|
|
|
|
|
|
16 |
| PDMS-HS-SPME-GC-ECD |
0.39 |
0.30 |
0.04 |
0.05 |
0.99 |
0.68 |
0.23 |
0.49 |
0.50 |
1.20 |
3.5 Analysis of real samples
The proposed method for MALBDEs was applied to the detection of soil pore water of red soil, yellow-brown soil and black soil collected on a large scale (E126°48′N45°49′44-E117°09′N28°04′) in China. No target analytes were detected in these soil pore water. The actual samples were then spiked with 50 ng L−1 and 200 ng L−1 of MALBDEs, respectively, and analysed using the developed HS-SPME method. As shown in Table 5, the recovery of MALBDEs at 50 ng L−1 and 200 ng L−1 varied from 80.40% to 108.90% and from 85.90% to 108.45%, respectively, while the relative standard deviation of the developed method was lower than 18.36% and 11.93%, respectively.
Table 5 Analytical performance of real samples for ten medium and low brominated diphenyl ethers
| Sample |
Spiked (ng L−1) |
Detected (μg L−1)/recovery (% RSD, n = 3) |
| BDE-7 |
BDE-15 |
BDE-28 |
BDE-35 |
BDE-75 |
| Red soil |
0 |
ND |
|
ND |
|
ND |
|
ND |
|
ND |
|
| 50 |
48.84 |
97.67(5.86) |
48.77 |
97.54(8.45) |
43.19 |
86.37(4.65) |
52.14 |
104.27(4.53) |
44.44 |
88.88(3.23) |
| 200 |
184.62 |
92.31(4.61) |
177.10 |
88.55(6.91) |
177.91 |
88.96(2.13) |
182.54 |
91.27(2.30) |
176.74 |
88.37(6.64) |
| Yellow-brown soil |
0 |
ND |
|
ND |
|
ND |
|
ND |
|
ND |
|
| 50 |
42.31 |
84.61(8.32) |
54.46 |
108.90(3.30) |
41.28 |
82.56(9.30) |
50.22 |
100.44(9.58) |
43.02 |
86.04(9.58) |
| 200 |
213.10 |
106.55(0.27) |
179.60 |
89.80(4.00) |
196.18 |
98.09(5.75) |
200.51 |
100.25(5.56) |
182.69 |
91.35(5.68) |
| Black soil |
0 |
ND |
|
ND |
|
ND |
|
ND |
|
ND |
|
| 50 |
47.56 |
95.12(4.36) |
50.78 |
101.56(11.50) |
40.37 |
82.60(0.02) |
50.18 |
100.35(6.98) |
40.33 |
82.10(0.40) |
| 200 |
213.65 |
106.80(0.00) |
181.92 |
90.96(11.00) |
206.03 |
103.02(6.96) |
209.31 |
104.65(6.46) |
196.38 |
98.19(7.18) |
| Sample |
Spiked (ng L−1) |
Detected (μg L−1)/recovery (% RSD, n = 3) |
| BDE-47 |
BDE-117 |
BDE-85 |
BDE-153 |
BDE-138 |
| Red soil |
0 |
ND |
|
ND |
|
ND |
|
ND |
|
ND |
|
| 50 |
41.86 |
83.72(2.32) |
50.63 |
101.26(15.52) |
43.27 |
86.54(5.67) |
50.24 |
100.48(11.66) |
50.95 |
101.90(18.36) |
| 200 |
177.52 |
88.76(6.21) |
181.71 |
90.85(5.36) |
199.96 |
99.98(4.13) |
216.90 |
108.45(11.93) |
214.94 |
107.47(8.35) |
| Yellow-brown soil |
0 |
ND |
|
ND |
|
ND |
|
ND |
|
ND |
|
| 50 |
45.01 |
90.02(10.06) |
51.92 |
103.85(12.25) |
51.43 |
102.85(0.42) |
47.50 |
95.00(16.32) |
52.60 |
105.20(16.05) |
| 200 |
181.68 |
90.84(4.96) |
184.70 |
92.35(3.67) |
203.05 |
101.53(5.31) |
208.10 |
104.00(14.00) |
171.80 |
85.90(0.74) |
| Black soil |
0 |
ND |
|
ND |
|
ND |
|
ND |
|
ND |
|
| 50 |
40.18 |
80.40(0.00) |
52.85 |
105.70(3.96) |
43.47 |
86.93(1.48) |
48.86 |
97.72(4.25) |
53.73 |
107.50(3.50) |
| 200 |
195.89 |
97.94(6.78) |
201.61 |
100.81(4.48) |
222.24 |
108.10(2.00) |
208.48 |
104.20(2.1) |
217.23 |
108.60(0.40) |
4. Conclusions
A green HS-SPME method combined with GC-ECD for rapidly simultaneous determination of ten trace medium and low brominated diphenyl ethers in soil pore water was successfully developed. Many extraction conditions of the developed method were optimized, including desorption time, coating thickness, ionic strength, temperature, and stirring and extraction time. The pH and DOM also were also thoroughly investigated as potential interference factors. The method developed for determination of trace levels of MALBDEs has the advantages of free-pre-treatment, free-solvent, low limit of detection and excellent recovery and reproducibility, while avoiding direct contact of the fiber coating with the matrix. However, the LOD of this method could be further reduced still by adjusting the conditions investigated in this study.
Acknowledgements
This study was financially supported by the National Key Basic Research Program of China (2014CB441105), the National Natural Science Foundation of China (41271464, 41671236 and 21377138), Natural Science Foundation of Jiangsu Province (BK20131463), and the “135” Plan and Frontiers Program of the Institute of Soil Science, Chinese Academy of Sciences (ISSASIP1614 and ISSASIP1618).
References
- M. Frederiksen, K. Vorkamp, M. Thomsen and L. E. Knudsen, Int. J. Hyg. Environ. Health, 2009, 212, 109–134 CrossRef CAS PubMed.
- A. P. Vonderheide, K. E. Mueller, J. Meija and G. L. Welsh, Sci. Total Environ., 2008, 400, 425–436 CrossRef CAS PubMed.
- Y. Li, T. Lin, L. Hu, J. Feng and Z. Guo, Environ. Int., 2016, 92–93, 507–514 CrossRef CAS PubMed.
- A. Bacaloni, L. Callipo, E. Corradini, P. Giansanti, R. Gubbiotti, R. Samperi and A. Lagana, J. Chromatogr. A, 2009, 1216, 6400–6409 CrossRef CAS PubMed.
- C. Chevrier, C. Warembourg, G. Le Maner-Idrissi, A. Lacroix, V. Dardier, S. Le Sourn-Bissaoui, F. Rouget, C. Monfort, E. Gaudreau, F. Mercier, N. Bonvallot, P. Glorennec, G. Muckle, B. Le Bot and S. Cordier, Neurotoxicology, 2016, 54, 81–88 CrossRef CAS PubMed.
- Y. Pan, D. C. W. Tsang, Y. Wang, Y. Li and X. Yang, Chem. Eng. J., 2016, 297, 74–96 CrossRef CAS.
- I. T. Cousinsa, A. J. Beckb and K. C. Jonesa, Sci. Total Environ., 1999, 228, 5–24 CrossRef.
- Y. Li, S. Niu, R. Hai and M. Li, Environ. Sci. Pollut. Res. Int., 2015, 22, 1133–1143 CrossRef CAS PubMed.
- M. H. Wu, J. C. Pei, M. Zheng, L. Tang, Y. Y. Bao, B. T. Xu, R. Sun, Y. F. Sun, G. Xu and J. Q. Lei, Chemosphere, 2015, 118, 87–95 CrossRef CAS PubMed.
- Y. Hong, D. Wetzel, E. L. Pulster, P. Hull, D. Reible, H. M. Hwang, P. Ji, E. Rifkin and E. Bouwer, Environ. Monit. Assess., 2015, 187, 646 CrossRef PubMed.
- L. J. Carter, E. Harris, M. Williams, J. J. Ryan, R. S. Kookana and A. B. Boxall, J. Agric. Food Chem., 2014, 62, 816–825 CrossRef CAS PubMed.
- Y. Li, G. Wei, J. Hu, X. Liu, X. Zhao and X. Wang, Anal. Chim. Acta, 2008, 615, 96–103 CrossRef CAS PubMed.
- M. Polo, G. Gomez-Noya, J. B. Quintana, M. Llompart, C. Garcia-Jares and R. Cela, Anal. Chem., 2004, 76, 1054–1062 CrossRef CAS PubMed.
- L. Sanchez-Prado, C. Gonzalez-Barreiro, M. Lores, M. Llompart, C. Garcia-Jares and R. Cela, Chemosphere, 2005, 60, 922–928 CrossRef CAS PubMed.
- J. X. Wang, D. Q. Jiang, Z. Y. Gu and X. P. Yan, J. Chromatogr. A, 2006, 1137, 8–14 CrossRef CAS PubMed.
- É. A. Souza-Silva, R. Jiang, A. Rodríguez-Lafuente, E. Gionfriddo and J. Pawliszyn, TrAC, Trends Anal. Chem., 2015, 71, 224–235 CrossRef.
- A. R. Ghiasvand and S. Hajipour, Talanta, 2016, 146, 417–422 CrossRef CAS PubMed.
- D. A. Lambropoulou, I. K. Konstantinou and T. A. Albanis, J. Chromatogr. A, 2007, 1152, 70–96 CrossRef CAS PubMed.
- M. T. O. Jonker, S. A. Van der heijden, J. P. Kreitinger and S. B. Hawthorne, Environ. Sci. Technol., 2007, 41, 7472–7478 CrossRef CAS PubMed.
- T. L. Terlaak, S. O. Agbo, A. Barendregt and J. L. M. Hermens, Environ. Sci. Technol., 2006, 40, 1307–1313 CrossRef CAS.
- F. Jia, X. Cui, W. Wang, L. Delgado-Moreno and J. Gan, Environ. Pollut., 2012, 167, 34–40 CrossRef CAS PubMed.
- L. Wang, Z. Zhang, X. Xu, D. Zhang, F. Wang and L. Zhang, Talanta, 2015, 142, 97–103 CrossRef CAS PubMed.
- M. Xie, Z. Y. Yang, L. J. Bao and E. Y. Zeng, J. Chromatogr. A, 2009, 1216, 4553–4559 CrossRef CAS PubMed.
- Z. Y. Yang, E. Y. Zeng, H. Xia, J. Z. Wang, B. X. Mai and K. A. Maruya, J. Chromatogr. A, 2006, 1116, 240–247 CrossRef CAS PubMed.
- S. Huang, F. Zhu, R. Jiang, S. Zhou, D. Zhu, H. Liu and G. Ouyang, Talanta, 2015, 136, 198–203 CrossRef CAS PubMed.
- M. Mei, X. Huang, J. Yu and D. Yuan, Talanta, 2015, 134, 89–97 CrossRef CAS PubMed.
- M. Kazemipour, M. Behzadi and R. Ahmadi, Microchem. J., 2016, 128, 258–266 CrossRef CAS.
- H. Lord and J. Pawliszyn, J. Chromatogr. A, 2000, 902, 17–63 CrossRef CAS PubMed.
- M. Zhang, Q. Zhen, H. Wang, M. Guo, S. Zhou, X. Wang and X. Du, Talanta, 2016, 158, 214–221 CrossRef CAS PubMed.
- A. M. Gioacchini, M. Menotta, E. Polidori, G. Giomaro and V. Stocchi, J. Mass Spectrom., 2002, 37, 1229–1235 CrossRef CAS PubMed.
- C. T. Huang, Y. Y. Su and Y. Z. Hsieh, J. Chromatogr. A, 2002, 977, 9–16 CrossRef CAS PubMed.
- A. Zhao, X. Wang, M. Ma, W. Wang, H. Sun, Z. Yan, Z. Xu and H. Wang, Microchim. Acta, 2012, 177, 229–236 CrossRef CAS.
- H. Liu, M. Zhang, X. Wang, Y. Zou, W. Wang, M. Ma, Y. Li and H. Wang, Microchim. Acta, 2011, 176, 303–309 CrossRef.
- X. Liu, J. Li, Z. Zhao, W. Zhang, K. Lin, C. Huang and X. Wang, J. Chromatogr. A, 2009, 1216, 2220–2226 CrossRef CAS PubMed.
- M. K. Tian and X. L. Feng, Chin. J. Chem., 2008, 26, 1251–1256 CrossRef CAS.
- J. Llorca-Porcel, G. Martínez-Sánchez, B. Álvarez, M. A. Cobollo and I. Valor, Anal. Chim. Acta, 2006, 569, 113–118 CrossRef CAS.
- H. Y. Xu, J. W. Zou, Q. S. Yu, Y. H. Wang, J. Y. Zhang and H. X. Jin, Chemosphere, 2007, 66, 1998–2010 CrossRef CAS PubMed.
- S. A. Tittlemier, T. Halldorson, G. A. Stern and G. T. Tomy, Environ. Toxicol. Chem., 2002, 21, 1804–1810 CrossRef CAS PubMed.
- H. Kuramochi, K. Maeda and K. Kawamoto, Chemosphere, 2007, 67, 1858–1865 CrossRef CAS PubMed.
- E. Braekevelt, S. A. Tittlemier and G. T. Tomy, Chemosphere, 2003, 51, 563–567 CrossRef CAS.
|
| This journal is © The Royal Society of Chemistry 2017 |
Click here to see how this site uses Cookies. View our privacy policy here. 
 Open Access Article
 This Open Access Article is licensed under a
  *a,
Yang Songa,
Wenxiang Hec,
Chenggang Gua,
Fang Wanga,
Xinglun Yanga,
Mao Yea,
Rongting Jiab and
Xin Jiang*a
*a,
Yang Songa,
Wenxiang Hec,
Chenggang Gua,
Fang Wanga,
Xinglun Yanga,
Mao Yea,
Rongting Jiab and
Xin Jiang*a