
 Open Access Article
 This Open Access Article is licensed under a Creative Commons Attribution-Non Commercial 3.0 Unported Licence
Hydrogenation of 3-hydroxypropanal into 1,3-propanediol over bimetallic Ru–Ni catalyst†
Li-Jun Li‡
a,
Wen-Jun Yi‡a,
Tian-Wei Liua,
Chen Huanga and
Zi-Sheng Chao *ab
*ab
aCollege of Chemistry and Chemical Engineering, Hunan University, Changsha, 410082, China. E-mail: zschao@yahoo.com; chao_zs@aliyun.com; Fax: +86-731-88713257; Tel: +86-731-88713257
bCollege of Materials Science and Engineering, Changsha University of Science & Technology, Changsha, Hunan 410114, China
First published on 22nd June 2017
Abstract
A series of Ni-based catalysts, including Ru/SiO2, Ni/SiO2 and Ru–Ni/SiO2, were prepared and employed in the hydrogenation of 3-hydroxypropanal (3-HPA) to 1,3-propanediol (1,3-PDO). The catalysts were systematically characterized by means of XRD, TEM, HRTEM, SEAD, XPS, H2-TPD, H2-TPR and N2-physisorption. It was indicated that the introduction of Ru onto the Ni/SiO2 not only increased the porosity of catalyst and the degree of dispersion of Ni species but also promoted the reduction of Ni2+ to Ni0 and the generation of active hydrogen species. The catalytic performance evaluation showed that the Ru–40Ni/SiO2 catalyst, among all others, could provide the largest yield of 1,3-PDO (above 99.0%) and highest TOF (4.70 × 10³ S−1). The optimized reaction conditions over the Ru–40Ni/SiO2 catalyst had been established as follows: reaction temperature = 80 °C, H2 pressure = 2.0 MPa and LHSV = 0.4 h−1. In consideration of its extremely low H2 pressure and very high yield of 1,3-PDO for the hydrogenation of 3-HPA, to the best of our knowledge, the Ru–40Ni/SiO2 catalyst appeared to be the most efficient catalyst among all others reported in the literature. The good performance enabled the Ru–40Ni/SiO2 catalyst to be very promising in its industrial application.
1. Introduction
1,3-Propanediol (1,3-PDO) is an important organic intermediate in chemical industries and has found versatile applications in the fields such as resins, adhesives, solvents, cosmetics, detergents, biocides, and feedstuffs.1 Most importantly, 1,3-PDO is the key raw material for the manufacture of polytrimethylene terephthalate (PTT).2,3 Two routes have been reported in the literature for the production of 1,3-PDO, biological and chemical ones. The first route involved the bioconversion of renewable resources (glucose, glycerol, etc.) to 1,3-PDO.3,4 This route, however, was associated with a few drawbacks, e.g., long reaction time, low 1,3-PDO yield,5 complicated purification of 1,3-PDO from fermentation broth and large discharge of waste water,6 largely restraining its development in industry. The second route involved either the hydrogenolysis of glycerol or the hydrogenation of 3-hydroxypropanal (3-HPA) to 1,3-PDO. The hydrogenolysis of glycerol always operated under harsh reaction conditions and provided a very low yield of 1,3-PDO,7,8 and accordingly, it is still far from industrial application. This method has not been applied in industry up till now. In contrast, the hydrogenation of 3-HPA could be conducted under relatively warm reaction conditions and provides a very high yield of 1,3-PDO, and in fact, it is currently the predominant method for the industrial production of 1,3-PDO.There have been a few reports in the literature on catalysts for the hydrogenation of 3-HPA,9–13 and these could be classified mainly into three groups. The first group comprised noble metal catalysts. For example, 2% Pt/TiO2 and 5% Ru/SiO2 catalysts provided, respectively, a 98.7% yield of 1,3-PDO at 15.0 MPa (ref. 9) and an 89.0% yield of 1,3-PDO at 4.0 MPa.10 The main issues associated with these catalysts were the high operation pressure and/or the relatively large usage of noble metals. The second group included RANEY® Ni and nickel alloy catalysts.11,12 Although a yield as high as 99.5% of 1,3-PDO could be achieved over these catalysts, the hard separation of the catalyst fine powder and reaction products and thus the difficulty in the recycling use of the catalyst and low purity of product still remained. The third group comprised supported transition metal oxide catalysts, in particular, nickel oxide. For instance, a yield of ca. 81.0% over an Ni/SiO2–Al2O3 catalyst was obtained at 15.0 MPa.13 Compared to the first and second groups of catalysts, the third group usually provided a relatively low yield of 1,3-PDO. There is no doubt that the development of a low-cost and highly effective catalyst is currently highly desired.
As is well known, bimetallic catalysts,14,15 particularly those consisting of noble and transition metals, may sometimes give a superior activity, selectivity and deactivation resistance, relative to the corresponding monometallic catalysts. For instance, Ru–Ni catalysts have been widely employed in reactions such as the methanation of CO16–19 and CO2,20,21 the hydrogenolysis of n-butane22 and the hydrogenation of D-glucose to sorbitol,23 exhibiting a much better catalytic performance than both the Ru and Ni catalysts.
These were proved to benefit from the optimization of the pore structure and the promotion of both the dispersion and reducibility of active metal species by the addition of noble metals to a Ni-based catalyst.16–18,20,21,23–26 To the best of our knowledge, bimetallic Ru–Ni catalysts have never been tested in the hydrogenation of 3-HPA.
In this study, a series of Ru/SiO2, Ni/SiO2 and Ru–Ni/SiO2 catalysts were employed, for the first time, for the hydrogenation of 3-HPA to 1,3-PDO. The catalysts were characterized using a series of techniques and their performances were evaluated under various conditions. In addition, the structure–activity relationship is discussed for a better insight into the catalyst.
2. Experimental
2.1. Chemicals
Ruthenium chloride hydrate (RuCl3·xH2O, Ru > 37 wt%), nickel nitrate hexahydrate (Ni(NO3)2·6H2O) and colloidal silica solution (commercial grade, SiO2·nH2O, 30.0 wt%, Na2O type, pH ≈ 10) were purchased from Sinopharm Chemical Reagent limited corporation. All chemicals were used without further purification.2.2. Catalyst preparation
Monometallic catalysts were prepared using a procedure described as follows: calculated amounts of RuCl3·xH2O and colloidal silica solution were mixed at room temperature with strong stirring for 8 h. The resultant mixture was dried overnight at 120 °C and then calcined in ambient air by increasing the temperature to 550 °C at 10 °C min−1 and holding that temperature for 4 h. This generated the Ru/SiO2 catalyst, in which the molar percentage of ruthenium was 1%. A series of Ni-based catalysts were also prepared using the same procedure as above, except that RuCl3·xH2O was replaced with Ni(NO3)2·6H2O. The obtained Ni-catalysts are denoted as yNi/SiO2 (y = 20 or 40), where y refers to the molar percentage of nickel.The bimetallic catalyst was prepared using the procedure described as follows: calculated amounts of RuCl3·xH2O, Ni(NO3)2·6H2O and colloidal silica solution were mixed at room temperature with strong stirring for 8 h. Then the resultant mixture was dried overnight at 120 °C and calcined in ambient air by increasing the temperature to 550 °C at 10 °C min−1 and holding that temperature for 4 h. This generated the Ru–40Ni/SiO2 catalyst, in which the molar percentages of ruthenium and nickel were 1% and 40%, respectively.
For the purpose of comparison, an unsupported SiO2 catalyst was prepared using the following procedure: a certain amount of colloidal silica solution (30.0 wt%) was dried overnight at 120 °C and then calcined in ambient air by increasing the temperature to 550 °C at 10 °C min−1 and holding that temperature for 4 h. The obtained catalyst is denoted as SiO2.
Before being employed for the hydrogenation of 3-HPA to 1,3-PDO, all the catalysts were pressed into small discs and then crushed and sieved to 20–40 mesh.
Reduced catalysts were prepared using the following procedure: the catalysts were reduced in an ambient hydrogen atmosphere by increasing the temperature to 550 °C at 10 °C min−1 and holding that temperature for 4 h. After that, the catalyst was cooled to room temperature under a hydrogen atmosphere.
2.3. Catalyst characterization
X-ray diffraction spectroscopy (XRD) was performed with a Bruker D8 Advance X-ray diffractometer under the following conditions: Cu target Kα radiation (λ = 1.54187 Å); scanning voltage 40 kV; scanning current 40 mA; scanning speed 6° min−1; scanning step 0.02°. The crystal size of the Ni particles was calculated using the Scherrer equation with the peak at 2θ = 44.4°.27Transmission electron microscopy (TEM), high resolution transmission electron microscopy (HRTEM) and selected area electron diffraction (SAED) were performed with a JEM-2100F transmission electron microscope operated at an acceleration voltage of 200 kV. Before determination, the specimen was dispersed into ethanol using ultrasonic treatment and then the resultant suspension was dropped onto a carbon-coated copper grid.
H2 temperature programmed desorption (H2-TPD) was performed using a Quantachrome Autosorb-1 instrument equipped with a thermal conductivity detector (TCD). The catalyst specimen (500 mg) was placed in a quartz reactor and reduced by increasing the temperature from room temperature to 550 °C at 10 °C min−1 and holding that temperature for 4 h in a stream of 10% H2/Ar with a flow rate of 40 mL min−1. Then, the catalyst was cooled to 40 °C and exposed to a stream of 10% H2/Ar with a flow rate of 40 mL min−1 till the saturation adsorption of H2 was reached. After that, the catalyst was purged with N2 at room temperature for 30 min to remove the physically adsorbed H2. The desorption of H2 was carried out in a stream of N2 with a flow rate of 30 mL min−1 from 40 °C to 600 °C at a heating rate of 10 °C min−1. The amount of desorbed hydrogen was determined using TCD. The calibration of hydrogen uptake was done by injecting a certain volume of pure hydrogen into the inlet stream of the reducing gas. On the basis of the peak area of the H2-TPD profile and the standard calibration process, the hydrogen uptake was estimated, assuming that one H atom was adsorbed per metal atom.28 This enabled the degree of dispersion to be calculated, according to eqn (1):26
| D% = 1.17X/wf | (1) |
The average crystallite diameter, d, was calculated from the degree of dispersion, assuming that the crystals were all spherical and possessed the same dimensions,26 as shown by eqn (2):
| d (nm) = 97.1/(D%) | (2) |
N2 physisorption was carried out with a Quantachrome Autosorb-1 automated physisorption and chemisorption analyzer at liquid N2 temperature. Before the measurements, the catalyst was degassed at 150 °C for 2 h under a vacuum of 4 × 10⁻⁴ Pa. The BET method was employed to calculate the specific surface area, with a correlation coefficient above 0.9999. The total pore volume was recorded at P/Po = 0.99. The pore size distribution was determined using the standard Barrett–Joyner–Halenda (BJH) method.
H2 temperature programmed reduction (H2-TPR) was conducted using a Quantachrome Autosorb-1 instrument equipped with a thermal conductivity detector (TCD). The catalyst specimen (50 mg) was placed in a quartz reactor, pretreated in a flow of N2 (40 mL min−1) at 400 °C for 30 min and then cooled down to 50 °C in a flow of N2 (40 mL min−1). After that, the catalyst was exposed to a flow of 10% H2/Ar with a flow rate of 40 mL min−1 while the temperature was raised from 100 °C to 700 °C at a rate of 10 °C min−1 and the signal was simultaneously recorded using TCD.
X-ray photoelectron spectroscopy (XPS) was performed using a K-Alpha XPS system with a monochromatic Al Kα X-ray source and a charge neutralizer. The binding energies (B.E.) of O 1s, Ru 3d and Ni 2p3/2 core-levels were recorded. The B.E. were referenced to the C 1s peak at 284.8 eV for surface adventitious carbon. In order to determine the nature and chemical state of the specific species present in the specimen, the peak was deconvolved and fitted using a non-linear least squares fitting program with a mix of Gaussian and Lorentzian shapes and a Shirley baseline.29–34
2.4. Hydrogenation of 3-HPA to 1,3-PDO
The reaction was performed in a fixed-bed flow-type stainless reactor, which was mounted in a tubular electric heater. The catalyst (1.0 g) was loaded in the middle of the reactor, and the upper space of the catalyst bed in the reactor was filled with inert quartz granulates (10–20 mesh). The catalyst was first in situ activated by reducing in a hydrogen atmosphere at 550 °C for 4 h, and then it was cooled to a preset temperature in the range of 40–150 °C. Then, a flow of H2 at a certain pressure in the range of 1.0–7.0 MPa and a stream of reactant, i.e., 10 wt% aqueous solution of 3-HPA, were simultaneously introduced into the reactor. The flow rates of the reactant and H2 were regulated so that the liquid hourly space velocity (LHSV) had a certain value in the range of 0.2–0.8 h−1. The reaction was thus conducted under the above conditions. The effluent from the bottom of the reactor was passed through a gas–liquid separator cooled with ice water. The liquid products were collected for analysis.Qualitative and quantitative analysis of the liquid products mixture was carried out with a Varian Saturn 2200/CP 3800 GC/MS instrument equipped with a flame ionization detector (FID) and two CP-Wax 52CB fused silica capillary columns (15 m × 0.32 mm).
The conversion of 3-HPA (X3-HPA), selectivity to 1,3-PDO (S1,3-PDO), yield of 1,3-PDO (Y1,3-PDO) and turnover frequency (TOF)35–37 were, respectively, calculated using eqn (3)–(6):
 | (3) |
 | (4) |
| Y1,3-PDO (mol%) = X3-HPA × S1,3-PDO/100 | (5) |
 | (6) |
3. Results and discussion
3.1. Characterization
The XRD patterns of the reduced and used catalysts are shown in Fig. 1. The broad diffraction peak at 2θ = 22° present in Fig. 1a indicates that the SiO2 in all the catalysts possesses the typical amorphous character.16 The weak diffraction peak at 2θ = 44.0° over both the reduced (Fig. 1b) and used (Fig. 1f) Ru/SiO2 catalysts is attributed to metallic Ru.38 This peak of metallic Ru is, however, hard to be observed over the reduced and used Ru–40Ni/SiO2 catalysts (Fig. 1e and i). This may be due to the fact that the Ru species has been incorporated into the silica network39 or the Ru crystals have very small dimensions (<4 nm) and thus are unable to be detected using XRD.22,24,40 The above result also indicates that no change occurred for Ru after the reduced catalyst was used in the reaction. The diffraction peaks at 2θ = 44.3°, 51.6° and 76.3° are present over the 20Ni/SiO2, 40Ni/SiO2 and Ru–40Ni/SiO2 (Fig. 1c–e and g–i) catalysts, and they are attributed to metallic Ni (JCPDS no. 04-0850). The intensity of these three peaks increases obviously with increasing content of Ni in the catalyst and decreased largely over the used catalysts relative to the corresponding reduced ones (cf. Fig. 1c–e and g–i). The weak diffraction peaks at 2θ = 37.3°, 43.3° and 62.9° are present for the used 20Ni/SiO2 and 40Ni/SiO2 catalysts (Fig. 1g and h), with their intensity increasing with the increase in Ni content of the catalyst, but they are absent over the corresponding reduced ones (Fig. 1c and d). These three peaks are attributed to cubic NiO (JCPDS no. 47-1049). Furthermore, these peaks for cubic NiO are absent for the used Ru–40Ni/SiO2 catalyst. This result indicates that, during the reaction, a proportion of metallic Ni species have been transformed into NiO species over the catalysts containing no Ru, but the above transformation of Ni species can be inhibited due to the loading of Ru onto the catalyst. The reason for the above transformation of the Ni species is most probably due to the fact that there is interaction between the Ni species and SiO2 network, forming the Si–O–Ni species. During the reaction, the Si–O–Ni species can be hydrolyzed into Si–OH and Ni(OH)x by the water in 3-HPA solution, and the dehydrogenation of Ni(OH)x leads to the formation of NiO species. However, the presence of Ru can easily initiate the generation of active H species at a relatively low temperature, and this kind of active H species is transferred onto the NiO species via a hydrogen spill-over process, and thus enables the NiO species to be reduced to metallic Ni species during the hydrogenation of 3-HPA to 1,3-PDO. In this sense, the presence of Ru stabilizes the metallic Ni species, avoiding the transformation of metallic Ni into NiO.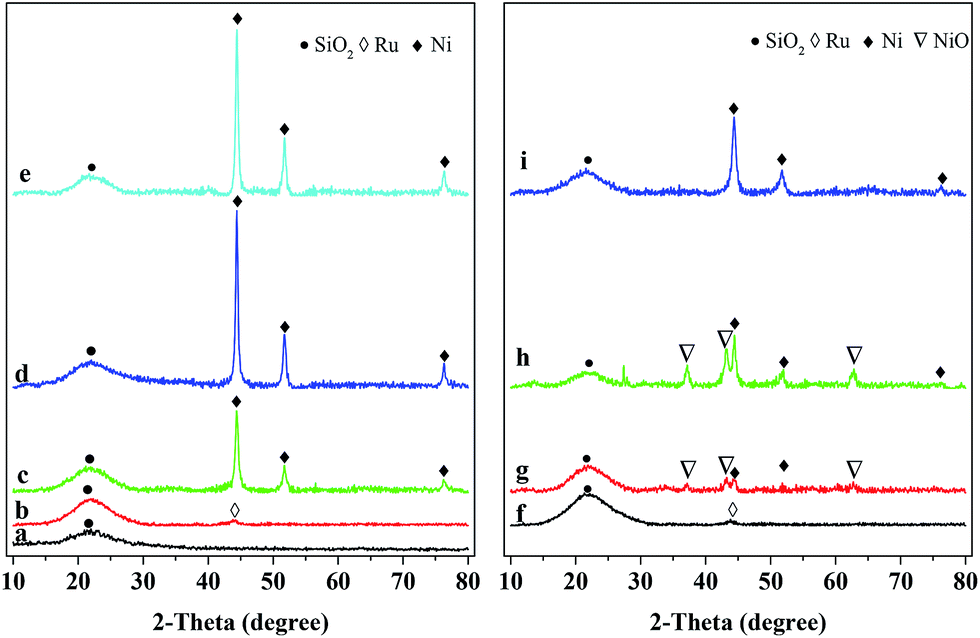 | ||
| Fig. 1 XRD patterns of reduced (left) and used (right) catalysts. (a) SiO2, (b) Ru/SiO2, (c) 20Ni/SiO2, (d) 40Ni/SiO2, (e) Ru–40Ni/SiO2, (f) Ru/SiO2, (g) 20Ni/SiO2 (h) 40Ni/SiO2, (i) Ru–40Ni/SiO2. (f–h) were all used for 4 h and (i) for 132 h, respectively. | ||
Fig. 2 shows the TEM micrographs and particle size distributions for various reduced catalysts. One can see that the particles of the 40Ni/SiO2 catalyst are aggregated to a larger extent and possess a broader size distribution as well as a larger average size, relative to those of the 20Ni/SiO2 catalyst (cf. Fig. 2a–d). Compared to the 40Ni/SiO2 catalyst, both the extent of aggregation and average size of the particles becomes smaller and the particle size distribution narrower for the Ru–40Ni/SiO2 catalyst (cf. Fig. 2c–f). The above result is due to the fact that the increase in the Ni content leads to the generation of larger Ni particles over the SiO2 support; however, the sintering of Ni particles is inhibited, to some extent, by the presence of Ru.16
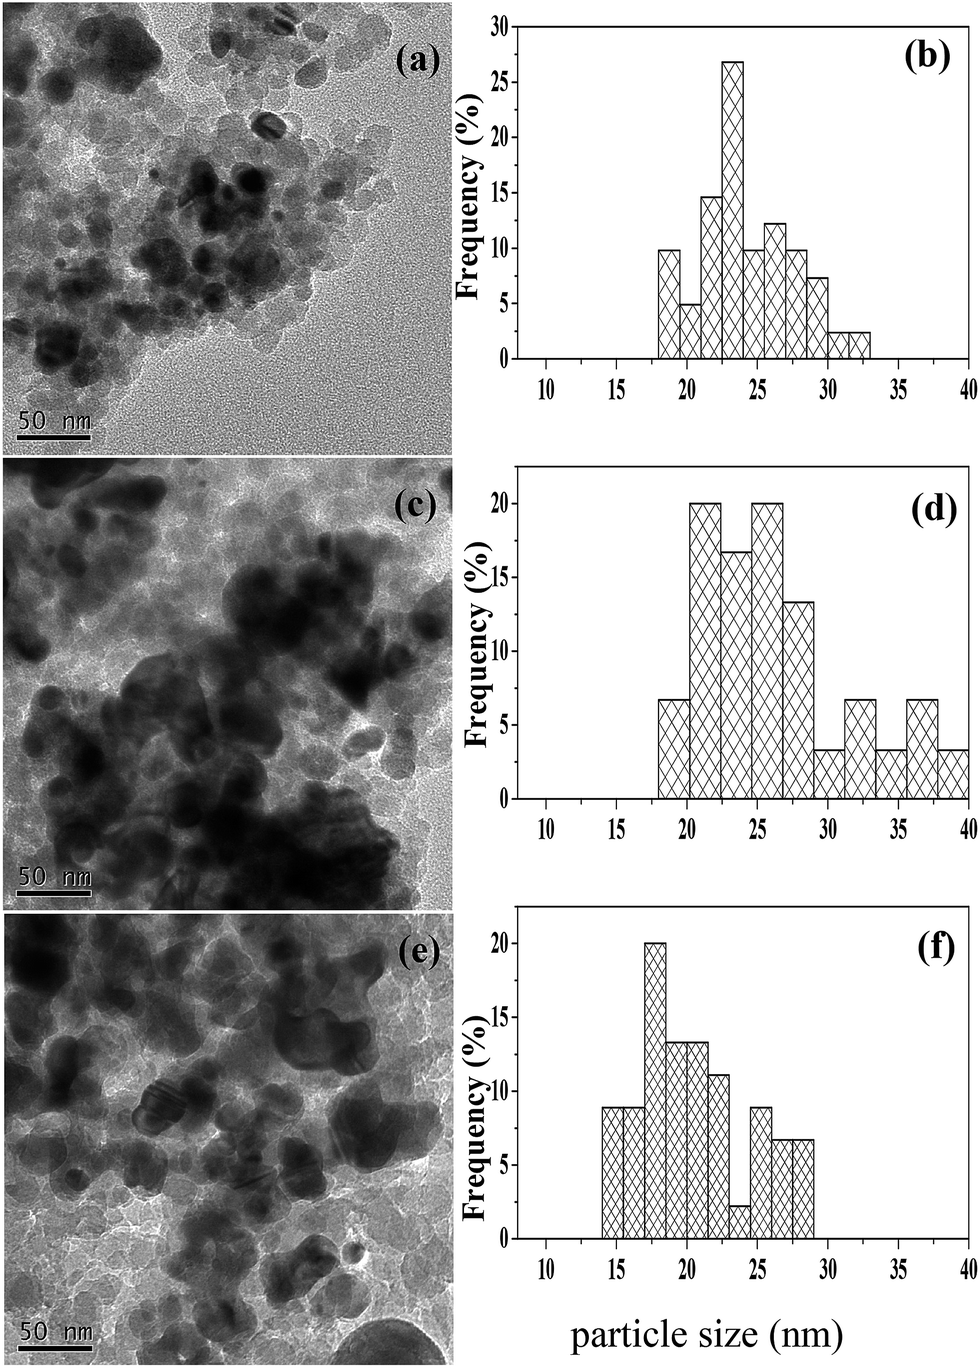 | ||
| Fig. 2 TEM micrographs (left) and particle size distributions (right) for the various reduced catalysts. (a, b) 20Ni/SiO2; (c, d) 40Ni/SiO2; (e, f) Ru–40Ni/SiO2. | ||
Fig. 3 shows the HRTEM micrograph and SAED pattern for the reduced Ru–40Ni/SiO2 catalyst. One can see that the micrograph (Fig. 3a) comprises mainly the lattice fringes with d = 0.21 nm and a small amount of lattice fringes with d = 0.20 nm, which can be attributed to the Ru (101) crystalline plane (JCPDS 06-0663) and Ni (111) crystalline planes (JCPDS 04-0850), respectively. In a few areas, the lattice fringes for the Ru (101) and Ni (111) are overlapped, indicating that the Ru particles are in close contact with the Ni particles. The SAED pattern (Fig. 3b) provides additional evidence for the presence of cubic Ni and cubic Ru in the catalyst.
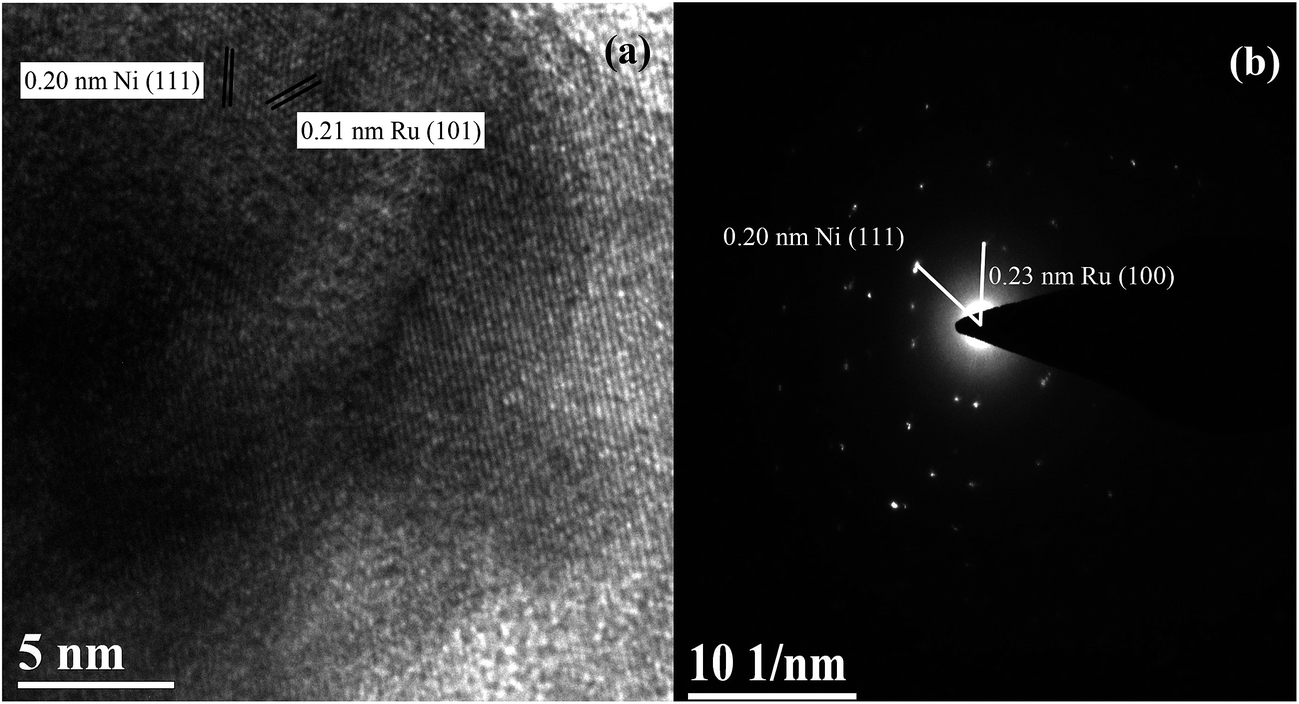 | ||
| Fig. 3 HRTEM micrograph (a) and SAED pattern (b) for the reduced Ru–40Ni/SiO2 catalyst. | ||
Table 1 shows the degree of dispersion (D) and average particle size (d) of Ni over various reduced catalysts. For the yNi/SiO2 (y = 20 or 40) catalyst, the degree of dispersion of Ni decreases and the average particle size of Ni increases with increasing Ni content in the catalyst. In comparison with the 40Ni/SiO2 catalyst, the degree of dispersion of Ni becomes larger and the average particle size of Ni smaller over the Ru–Ni/SiO2 catalyst. This indicates that the presence of Ru leads to an increase in the degree of dispersion of Ni and the decrease in the formation of larger Ni particles.23 This result is consistent with that derived from the TEM determination.
Fig. 4 shows the N2 adsorption–desorption isotherms and pore size distribution profiles for the reduced and used catalysts. One can see that the isotherms for all the catalysts belong to the type IV and possess an H2 hysteresis, according to the IUPAC classification,41 indicating the presence of mesopores in the catalysts.42–44 The pore size distributions for all the catalysts are unimodal and relatively narrow in the range of 2.5–30 nm, indicating a relatively high monodispersity of mesopores.42,43 The most frequent pore size (DMP) increases with the loading of Ni and the further loading of Ru. This is due to the fact that small amounts of Ni and/or Ru have been incorporated into the silica network and thus hindered the sintering of catalyst particles.39 Compared to the reduced catalysts, the used catalysts have only a very small change in the DMP, except for the used Ru–40Ni/SiO2 catalyst, which possesses an obviously larger DMP than the corresponding reduced one.
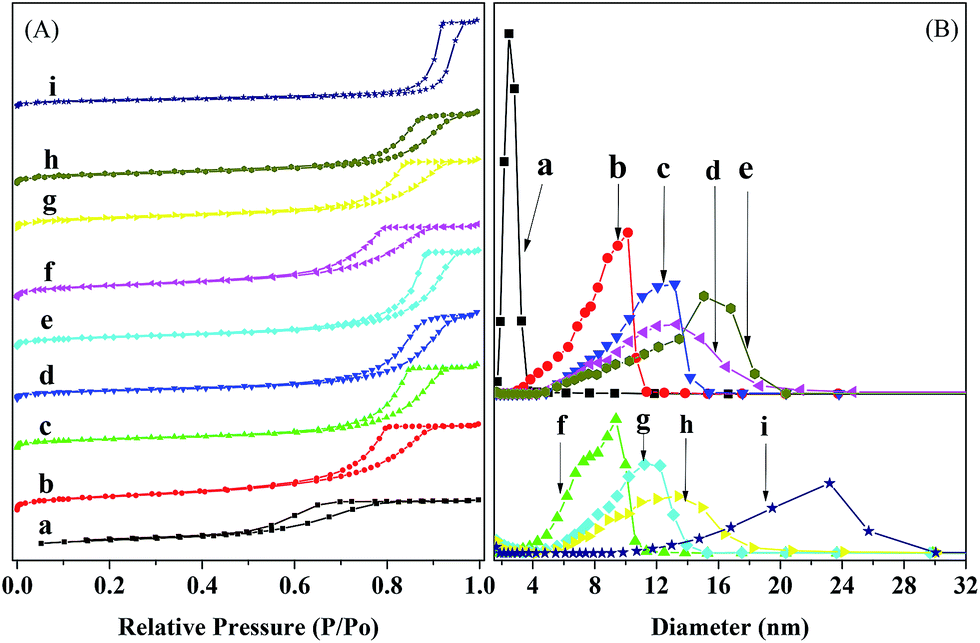 | ||
| Fig. 4 N2 adsorption–desorption isotherms (A) and pore size distributions (B) for the reduced and used catalysts. (a) SiO2, (b) Ru/SiO2, (c) 20Ni/SiO2, (d) 40Ni/SiO2, (e) Ru–40Ni/SiO2, (f) used Ru/SiO2, (g) used 20Ni/SiO2 (h) used 40Ni/SiO2, (i) used Ru–40Ni/SiO2. (f–h) were all used for 4 h and (i) for 132 h. | ||
Table 2 lists the textural properties of the reduced and used catalysts. One can see that the reduced Ru/SiO2 and Ru–40Ni/SiO2 possess a larger specific surface area (SBET), total pore volume (Vtotal) and most frequent pore size (DMP) than the corresponding reduced SiO2 and 40Ni/SiO2, respectively. This shows that the loading of Ru increases the porosity of the catalyst. This is due to the fact that Ru can be incorporated into the silica network prepared via a sol–gel process,39 and thus a proportion of the Si–O–Si structure is replaced with a Si–O–Ru–O–Si structure, which not only hinders the sintering of catalyst particles45 but also enables the catalyst particles to be assembled into the mesoporous structure with a higher SBET and Vtotal and DMP. Compared to the reduced SiO2, the SBET is decreased and both the Vtotal and DMP are increased with the loading of Ni onto the silica (the reduced 20Ni/SiO2 and 40Ni/SiO2 catalysts), particularly for the higher loading of Ni. This is due to the fact that the deposition and aggregation of Ni particles increases the size of the catalyst particles and thus decreases the SBET of Ni–SiO2 catalyst;46 furthermore, the presence of Ni particles also roughens the surface of the silica particles, and the assembly leads to the formation of a mesoporous structure with a larger Vtotal and DMP. Compared to the reduced yNi/SiO2 catalysts (y = 20 or 40), the used ones possess a larger SBET but a smaller porosity (Vtotal and DMP). This is due to the fact that, as has been pointed out in the XRD characterization, a proportion of Ni species can be hydrolyzed into Ni(OH)x, which is partially soluble in water. This may decrease, to some extent, the aggregation of Ni particles and thus increase the SBET of catalyst. In addition, the dissolved Ni(OH)x may be re-deposited into the pores of catalyst, decreasing the pore volume and average pore size. Compared to the reduced Ru/SiO2 catalyst, the SBET, Vtotal and DMP all decreased over the used Ru/SiO2 catalyst. Similarly, the used Ru–40Ni/SiO2 catalyst possesses a smaller SBET and Vtotal relative to the reduced Ru–40Ni/SiO2 catalyst. This is due to the fact that the Si–O–Ru–O–Si structure is partially destroyed via the reduction of the Ru species during the hydrogenation reaction, and this causes, to some extent, sintering of the catalyst particles. However, it was also found that the used Ru–40Ni/SiO2 catalyst possesses an abnormally larger DMP than the reduced Ru–40Ni/SiO2 catalyst, the reason for which is still unclear. One possibility may be related to the obviously long TOS of the used Ru–40Ni/SiO2 catalyst (132 h), relative to the used 40Ni/SiO2 catalyst (4 h). The deposition of byproducts with high molecular weights on the surface and also in the pores of the Ru–40Ni/SiO2 catalyst leads not only to the irregular aggregation of catalyst particles, generating large voids among the catalyst particles, but also to occupation of the pores of the catalyst, decreasing SBET and Vtotal.
| Catalyst | SBETa (m2 g−1) | Vtotalb (cm3 g−1) | DMPc (nm) |
|---|---|---|---|
| a SBET, specific surface area.b Vtotal total pore volume.c DMP, most frequent pore size.d The catalyst was used for 4 h.e The catalyst was used for 132 h. | |||
| SiO2 | 136.2 | 0.24 | 2.5 |
| Ru/SiO2 | 154.8 | 0.39 | 10.1 |
| 20Ni/SiO2 | 98.6 | 0.38 | 13.2 |
| 40Ni/SiO2 | 93.2 | 0.39 | 13.3 |
| Ru–40Ni/SiO2 | 107.2 | 0.44 | 15.1 |
| Used Ru/SiO2d | 136.5 | 0.33 | 9.4 |
| Used 20Ni/SiO2d | 113.1 | 0.32 | 11.2 |
| Used 40Ni/SiO2d | 98.9 | 0.32 | 13.4 |
| Used Ru–40Ni/SiO2e | 66.4 | 0.39 | 23.2 |
Fig. 5 shows the H2-TPR profiles for the various unreduced catalysts. The broad peaks in the profiles have been deconvolved and fitted to the component peaks, and the temperatures at the maxima and the area percentages of the peaks, corresponding to the reduction temperatures and percentage contents of Ni species, are summarized in Table S1 (ESI†). One can see from Fig. 5 that all the catalysts show three reduction peaks. Over the 20Ni/SiO2 catalyst, the reduction peaks appear at 382.8 °C, 450.3 °C and 585.7 °C, which can, respectively, be ascribed to the small NiO particles (S-NiO),47 the NiO particles weakly interacting with SiO2 (W-NiO–SiO2),48 and the NiO particles strongly interacting with SiO2 (S-NiO–SiO2).49 Over the 40Ni/SiO2 catalyst, the reduction peaks appear at 306.0 °C, 381.0 °C and 453.5 °C, which can, respectively, be assigned to the large NiO particles (L-NiO),50 the S-NiO, and the W-NiO–SiO2. Pawelec et al.51 reported that larger NiO particles possessed a smaller interface with the SiO2 surface and thus resulted in a weaker interaction between NiO particles and SiO2 support, enabling the nickel species to be more easily reduced. As found from the above characterizations using XRD, H2-TPD and TEM, the 40Ni/SiO2 catalyst possesses a larger average size of Ni particles than the 20Ni/SiO2 catalyst. Therefore, the increase in the average size of the Ni particles accounts for the above variations in both the reduction temperature and composition of the Ni species for the 40Ni/SiO2 catalyst relative to the 20Ni/SiO2 catalyst. Over the Ru–40Ni/SiO2 catalyst, the reduction peaks appear at 177.0 °C, 299.0 °C and 355.5 °C, which can, respectively, be attributed to the highly dispersed RuO2 species (HD-RuO2),52 the S-NiO, and the W-NiO–SiO2. It has been identified (see Table 1 and Fig. 1) that the Ru–40Ni/SiO2 catalyst possesses a smaller average size of Ni particles than the 40Ni/SiO2 catalyst. Therefore, both the peaks for the L-NiO and S-NiO–SiO2 disappear, and also the reduction temperatures for the S-NiO and W-NiO–SiO2 should be higher over the Ru–40Ni/SiO2 catalyst relative to the 40Ni/SiO2 catalyst. However, the reduction temperature for the S-NiO and W-NiO–SiO2 over the Ru–40Ni/SiO2 catalyst are, in fact, abnormally lower than over the 40Ni/SiO2 catalyst, and this is due to the presence of Ru species, which causes the inter-particle hydrogen spillover from Ru particles to Ni particles.16,18,20,23,25 As for the hydrogen spillover, Ru species are first reduced to Ru0 by H2, while H2 molecules are dissociated on the surface of Ru0 to form the active hydrogen species; then, the active hydrogen species can be transferred to the neighboring Ni species in close proximity due to the contact between the Ru0 and NiO particles and/or the contact of SiO2 with both the Ru0 and NiO particles, and this enables the Ni species to be easily reduced to Ni0 at an obviously lower temperature, relative to the normal reduction of NiO by H2 without hydrogen spillover.25 The presence of Ru0 and Ni0 and their contact with each other was evidenced in the above HRTEM characterization. In Table S1,† one can find that the percentage content of isolated NiO (L-NiO + S-NiO) over various catalysts has the order 40Ni/SiO2 > Ru–40Ni/SiO2 > 20Ni/SiO2 and that of the Ni species interacting with SiO2 (W-NiO–SiO2 + S-NiO–SiO2) shows the reverse order, i.e., 40Ni/SiO2 < Ru–40Ni/SiO2 < 20Ni/SiO2. This implies that the 40Ni/SiO2 catalyst possesses a lower degree of dispersion of Ni, relative to the 20Ni/SiO2 catalyst,53 and in fact, this was evidenced from the result listed in Table 1. The above result also indicates that the presence of Ru favors a high dispersion of Ni over SiO2 support via the interaction between the latter two.
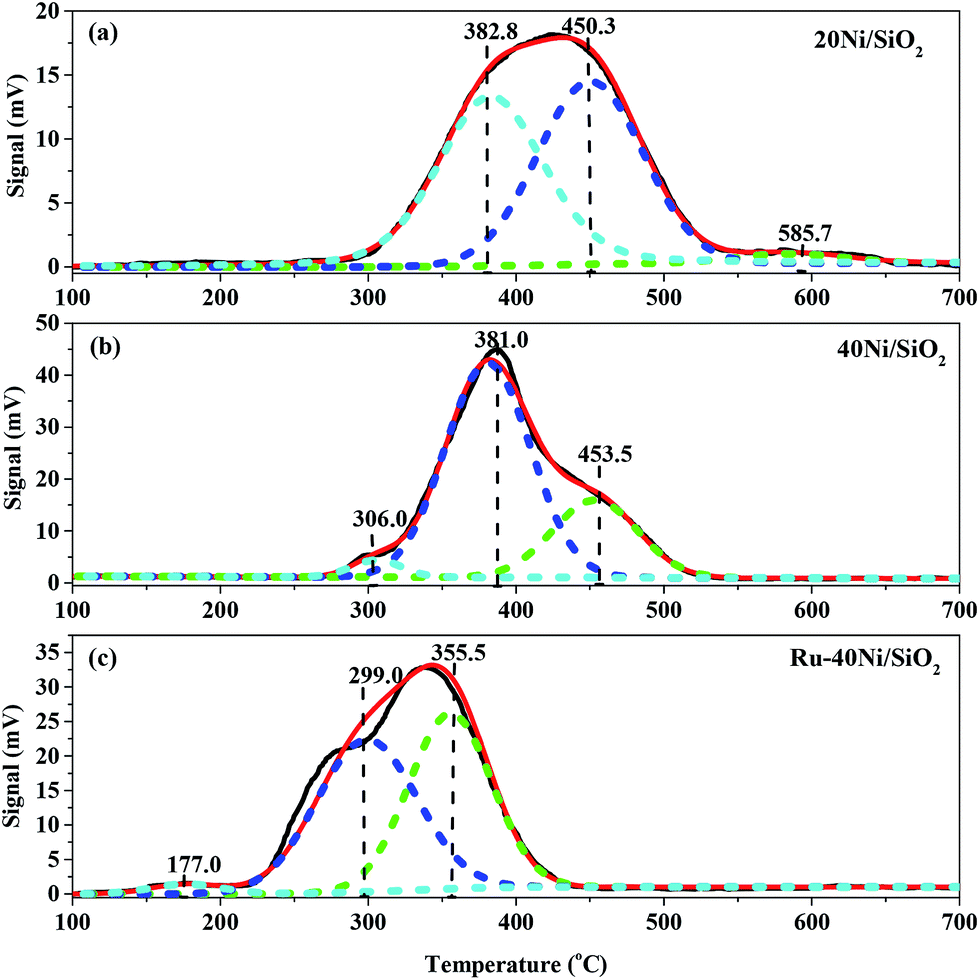 | ||
| Fig. 5 H2-TPR profiles for the various unreduced catalysts. (a) 20Ni/SiO2, (b) 40Ni/SiO2, (c) Ru–40Ni/SiO2. | ||
Fig. 6 shows the Ni 2p3/2 XPS spectra for the various unreduced catalysts, and the corresponding B.E. of the Ni species are summarized in Table S2.† One can see that all the catalysts exhibit a broad main peak with B.E. of ca. 855.0 eV and a shoulder peak with B.E. of 860.4–860.9 eV. The main peak is deconvolved and fitted into two components situating at B.E. = 854.1 ± 0.2 eV and 855.9 ± 0.2 eV, which can be attributed to Ni2+ species in bulk NiO16 and that interacting with SiO2 (Ni2+–SiO2),16 respectively, while the shoulder peak corresponds to the satellite of Ni 2p3/2 peak.29 It is found that, over all the catalyst, the Ni species consists of mainly isolated NiO and a relatively small amount of Ni2+ attached to SiO2. With increasing Ni content or loading of Ru in the catalyst, the content of NiO increases and that of Ni2+–SiO2 decreases. These results are consistent with those derived from the H2-TPR characterization. Fig. S1† shows the O 1s and Ru 3d XPS spectra for the various unreduced catalysts. One can see that the O 1s spectra for all the 20Ni/SiO2, 40Ni/SiO2 and Ru–40Ni/SiO2 catalysts exhibit a main peak at B.E. = 532.0–532.4 eV and a shoulder at B.E. = 529.5–529.8 eV, while the Ru/SiO2 catalyst displays only a peak at 532.6 eV. The peak at B.E. = 532.0–532.6 eV can be ascribed to the lattice oxygen in SiO2 (ref. 32 and 33) and that at 529.5–529.8 eV to the lattice oxygen in nickel oxide.34 The Ru 3d spectrum for the Ru/SiO2 catalyst exhibits two weak peaks at B.E. = 281.2 and 285.2 eV, being attributed to Ru 3d5/2 and Ru 3d3/2, respectively, and a strong peak at 284.8 eV is related to the C 1s of surface carbonaceous contamination,30–32 while that for the Ru–40Ni/SiO2 catalyst also displays the C 1s peak at 284.8 eV. The failure to identify the Ru 3d peak over the Ru–40Ni/SiO2 catalyst may be due to the fact that the Ru content is too low on the surface of the catalyst to be detected using XPS. The possible reasons are as follows: (i) the Ru content in the bulk sample is quite low; (ii) the Ru species is incorporated into the silica network; and (iii) the Ru species is coated with the Ni species.21
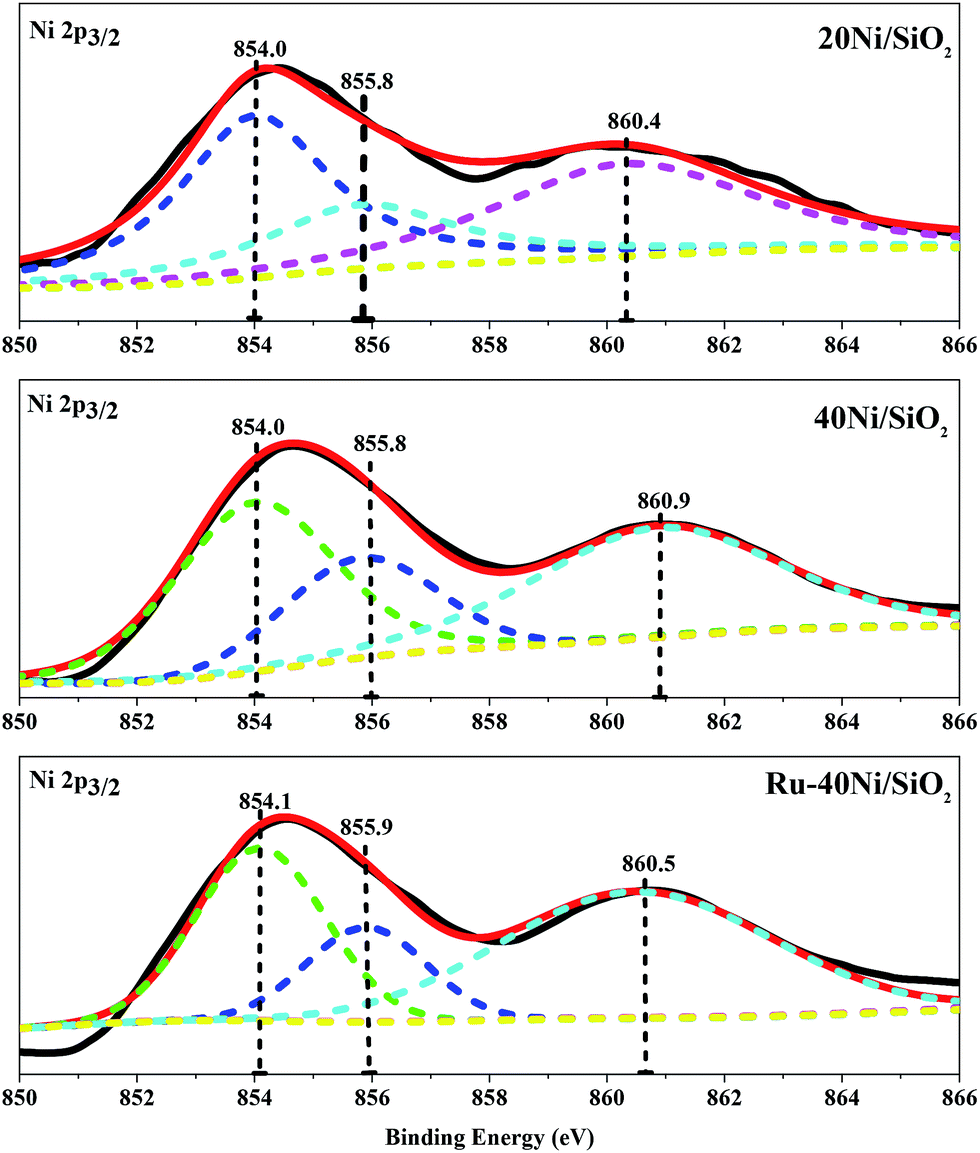 | ||
| Fig. 6 Ni 2p3/2 XPS spectra for the various unreduced catalysts. | ||
3.2. Structure–activity relationship in the hydrogenation of 3-HPA over various catalysts
Several possible reactions were supposed to happen during the hydrogenation of 3-HPA as follows.54 Of these, reactions (8)–(10), and (12) are reversible, while (7), (11) and (13) are irreversible.As the mechanism of the hydrogenation of 3-HPA has always been thought to follow the Langmuir–Hinshelwood mechanism,55 in which the reactants (3-HPA and H2) are absorbed and then activated to form the target product (1,3-PDO), the ability to adsorb and active the reactants is the most significant property for the catalyst. In particular, the activation of H2 is an important process in the hydrogenation of 3-HPA.56
Main reaction
| 3-HPA + H2 → 1,3-PDO | (7) |
Side reactions
| 3-HPA ↔ acrolein + H2O | (8) |
| 3-HPA + H2O ↔ 3-HPA-hydrate | (9) |
| 3-HPA ↔ 3-HPA-dimer | (10) |
| 3-HPA + acrolein → 4-oxa-1,7-heptanedial | (11) |
| 4-oxa-1,7-heptanedial ↔ 4-hydroxy-3-formylteteahydropyran | (12) |
| 4-oxa-1,7-heptanedial + H2 → 4-oxa-1,7-heptanediol | (13) |
The conversion of 3-HPA (X3-HPA), selectivity to 1,3-PDO (S1,3-PDO), yield of 1,3-PDO (Y1,3-PDO) and TOF over the various catalysts for the hydrogenation of 3-HPA to 1,3-PDO are listed in Table 3. One can see that the TOF over the Ru/SiO2 catalyst is higher than over the 20Ni/SiO2 catalyst, indicating a larger efficiency of the Ru species than the Ni species in catalyzing the hydrogenation of 3-HPA to 1,3-PDO. However, due to the much lower loading of Ru, relative to that of Ni, over SiO2, there is only a limited amount of active sites available for the conversion of 3-HPA over the Ru/SiO2 catalyst, and this leads to a lower conversion of 3-HPA, selectivity to 1,3-PDO and yield of 1,3-PDO over Ru/SiO2 catalyst than over the 20Ni/SiO2 catalyst. Compared to the 20Ni/SiO2 catalyst, the conversion of 3-HPA and TOF are lower but the selectivity to 1,3-PDO and yield of 1,3-PDO are both larger over the 40Ni/SiO2 catalyst. This is due to the fact that, on the one hand, the 20Ni/SiO2 catalyst possesses a smaller average size of Ni particle, higher degree of dispersion of Ni and larger specific surface area, as well as comparable pore volume and average pore size (see Tables 1 and 2), relative to the 40Ni/SiO2 catalyst, enabling more 3-HPA to be adsorbed and activated over the former catalyst than over the latter catalyst; on the other hand, the 20Ni/SiO2 catalyst contains more Ni species interacting with SiO2 (W-NiO–SiO2 + S-NiO–SiO2) than the isolated NiO species (L-NiO + S-NiO), relative to the 20Ni/SiO2 catalyst, leading to an increased difficulty for the reduction of Ni species (higher reduction temperature), as shown in Table S1,† and thus for the activation of H2. Therefore, there would be a surplus of activated 3-HPA but a deficiency of activated H2 over the 20Ni/SiO2 catalyst, and this increases the extent of the side reactions described in eqn (7)–(13) and thus decreases the selectivity to 1,3-PDO relative to the 40Ni/SiO2 catalyst. Nevertheless, the higher degree of dispersion of Ni over the 20Ni/SiO2 catalyst than over the 40Ni/SiO2 catalyst means that there are relatively more active Ni species available for the conversion of 3-HPA to 1,3-PDO, leading to a higher TOF over the former catalyst than over the latter catalyst. Compared to the 40Ni/SiO2 catalyst, the Ru–40Ni/SiO2 catalyst exhibits a higher conversion of 3-HPA, selectivity to 1,3-PDO, yield of 1,3-PDO and TOF. This is due to the fact that, compared to the 40Ni/SiO2 catalyst, the Ru–40Ni/SiO2 catalyst possesses a smaller average size and thus a higher degree of dispersion of Ni particles (see Table 1) to provide more exposed active sites, and also, a higher porosity (specific surface area, pore volume and average pore size; see Table 2) to provide more access and space for both the fast diffusion of reactants (3-HPA and hydrogen species) and products; in addition, the presence of Ru enables the generation of active hydrogen species via a hydrogen spillover process that favors both the reduction of Ni species to active Ni0 at relatively low temperatures (see Fig. 5) and the hydrogenation of 3-HPA to 1,3-PDO at a high conversion and selectivity. Among all the others, the Ru–40Ni/SiO2 catalyst possesses the best performance and the largest efficiency for the hydrogenation of 3-HPA to 1,3-PDO, providing a 99.3% conversion of 3-HPA, 99.7% selectivity to 1,3-PDO and 99.0% yield of 1,3-PDO at a TOF of 4.70 × 10³ S−1.
| Catalyst | X3-HPA (mol%) | S1,3-PDO (mol%) | Y1,3-PDO (mol%) | TOF (×103 S−1) |
|---|---|---|---|---|
| a X3-HPA: conversion of 3-HPA. S1,3-PDO: selectivity to 1,3-PDO. Y1,3-PDO: yield of 1,3-PDO. Reaction conditions: T = 80 °C, P = 2.0 MPa, LHSV = 0.4 h−1, time on stream (TOS) = 2 h. | ||||
| Ru/SiO2 | 32.52 | 56.16 | 18.26 | 3.80 |
| 20Ni/SiO2 | 73.26 | 62.60 | 45.86 | 3.71 |
| 40Ni/SiO2 | 62.83 | 93.50 | 58.74 | 2.84 |
| Ru–40Ni/SiO2 | 99.30 | 99.71 | 99.01 | 4.70 |
The above results indicate that, while a smaller average size of Ni particles and thus a higher degree of dispersion of Ni species over the Ni/SiO2 catalyst provides more active sites for the activation of 3-HPA, it is, however, unfavorable for the activation of H2. This leads to an insufficient amount of activated hydrogen relative to the amount of activated 3-HPA and accordingly a relatively high conversion of 3-HPA but a low selectivity to 1,3-PDO over the Ni/SiO2 catalyst. The introduction of Ru onto the Ni/SiO2 catalyst not only promotes the ability for the activation of H2 but also provides an additional number of active sites and increases the porosity of catalyst. This ensures that a high conversion of 3-HPA at a high selectivity to 1,3-PDO can be achieved over the Ru–Ni/SiO2 catalyst. Therefore, a matching between the abilities of catalyst for the activation of 3-HPA and H2 is vital in the hydrogenation of 3-HPA to 1,3-PDO. Based on the above discussions, a possible mechanism for the hydrogenation of 3-HPA to 1,3-PDO over the Ru–Ni/SiO2 catalyst has been proposed, as shown in Scheme 1.
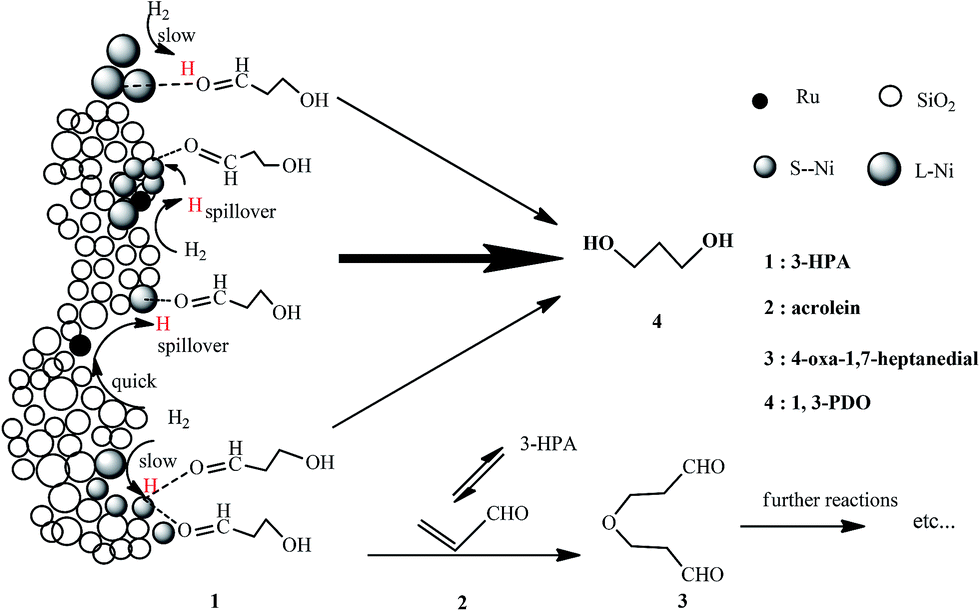 | ||
| Scheme 1 Possible mechanism for the hydrogenation of 3-HPA to 1,3-PDO over the Ru–Ni/SiO2 catalyst. | ||
3.3. Optimization of the reaction conditions
Fig. 7 shows the effect of reaction conditions, including reaction temperature, H2 pressure, LHSV of 3-HPA and time on stream (TOS), on the hydrogenation of 3-HPA over the Ru–40Ni/SiO2 catalyst.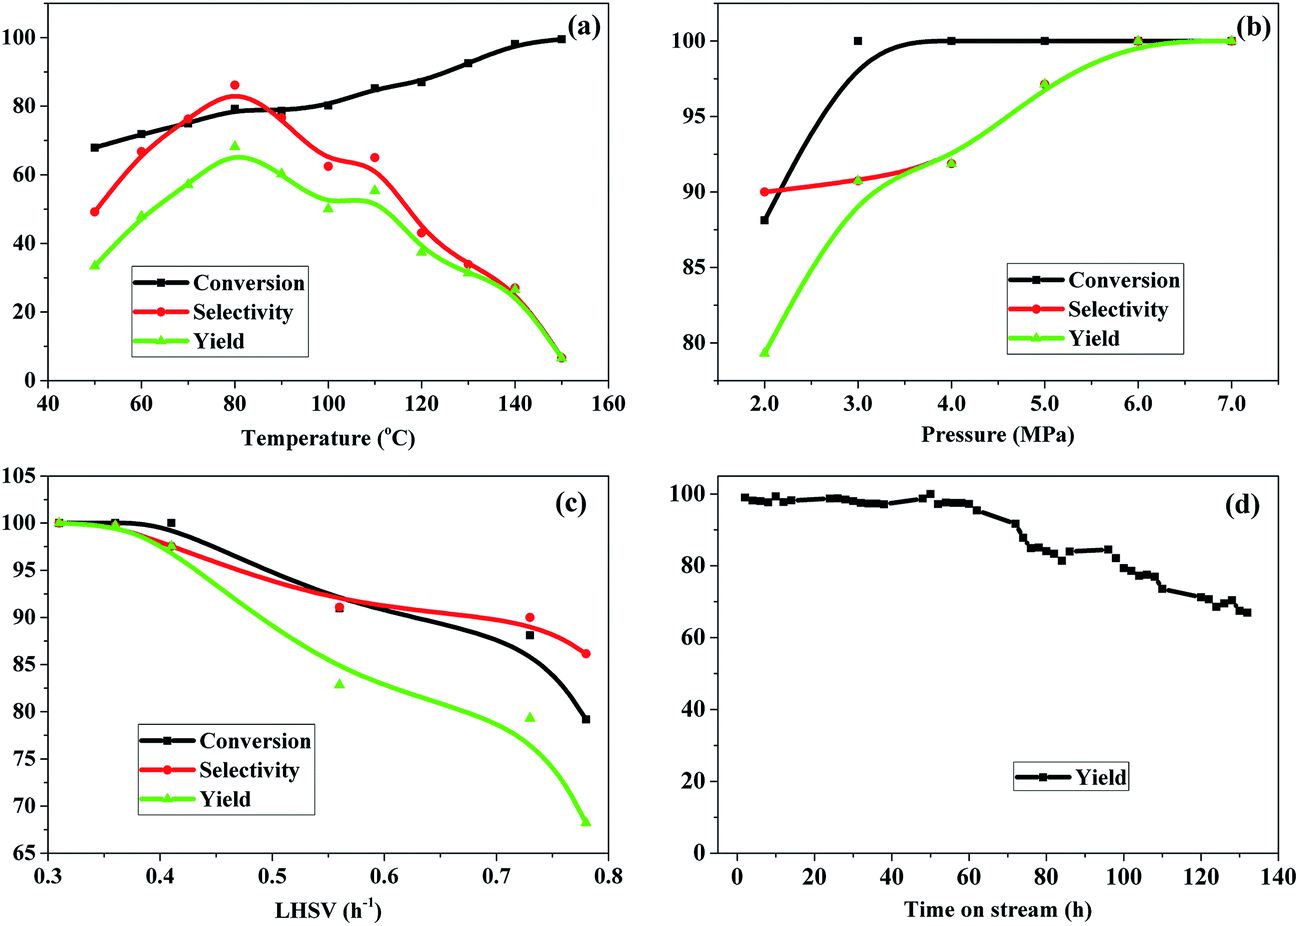 | ||
| Fig. 7 Effect of reaction conditions on the hydrogenation of 3-HPA over the Ru–40Ni/SiO2 catalyst. (a) Reaction conditions: P = 2.0 MPa, LHSV = 0.73 h−1; (b) reaction conditions: T = 80 °C, LHSV = 0.73 h−1; (c) reaction conditions: T = 80 °C, P = 2.0 MPa; (d) reaction conditions: T = 80 °C, P = 2.0 MPa, LHSV = 0.4 h−1. | ||
Fig. 7a shows the effect of reaction temperature. One can see that, with increasing reaction temperature, the conversion of 3-HPA increases approximately linearly. This is due to the fact that the increase in the reaction temperature promotes the mass transfer rate and also favors the activation of reactants.56 The selectivity to 1,3-PDO increased first, achieving its maximum at 80 °C, and then decreased as the reaction temperature increased. This result can be explained by the fact that both the rates for the hydrogenation reaction and the hydrogen mass transfer can be accelerated by increasing the reaction temperature; however, the hydrogenation of 3-HPA to 1,3-PDO is an exothermic reaction, and accordingly, it is suppressed at too high temperatures. Moreover, high temperatures also promote the side reactions, leading to a decrease in the selectivity to 1,3-PDO.56,57 Therefore, the optimal reaction temperature is 80 °C, taking into consideration both the high conversion of 3-HPA and the high selectivity to 1,3-PDO.
Fig. 7b shows the effect of H2 pressure. It can be seen that, on increasing the pressure from 2.0 MPa to 3.0 MPa, both the conversion of 3-HPA and selectivity to 1,3-PDO increase; on further increasing the pressure from 3.0 MPa to 7.0 MPa, the conversion of 3-HPA increases only slightly and the selectivity to 1,3-PDO increases obviously. The yield of 1,3-PDO increases from 77.4% to 100% with the pressure increasing from 2.0 MPa to 7.0 MPa. This indicates that the increase in the H2 pressure has a positive effect on the conversion of 3-HPA and the selectivity to 1,3-PDO.58 This is due to the fact that, as is well known, the gas–liquid–solid mass transfer resistance of hydrogen constitutes a very important limiting factor for many hydrogenation reaction, and therefore, an increase in the H2 pressure promotes the accessibility of H2 at the active sites of the catalyst, favoring the hydrogenation conversion of 3-HPA to 1,3-PDO.59 In particular, it should be noted that a relatively high conversion of 3-HPA (ca. 88.0%) at a high selectivity to 1,3-PDO (ca. 90.0%) has been achieved at appreciably low H2 pressures (2.0 MPa), and moreover, a nearly complete conversion of 3-HPA at ca. 100% selectivity to 1,3-PDO can be achieved over the Ru–40Ni/SiO2 catalyst. The relatively low H2 pressure employed in this work is of significant importance for industrial applications of the hydrogenation of 3-HPA to 1,3-PDO, since a lower reaction pressure implies lower requirements for both facilities and energy consumption.
Fig. 7c shows the effect of LHSV. It can be seen that the conversion of 3-HPA, selectivity to 1,3-PDO and yield of 1,3-PDO are all nearly 100% at LHSV = 0.3 h−1, and these decrease slightly in the range of LHSV = 0.3–0.4 h−1 and more obviously at LHSV > 0.41 h−1. This result indicates that a lower LHSV is favorable for the conversion of 3-HPA and the selectivity to 1,3-PDO, and a higher LHSV, which corresponds to a shorter residence time, leading to an insufficient contact between the reactants and catalyst, inhibiting the hydrogenation of 3-HPA to 1,3-PDO.58 From the above results, it can be established that the optimized conditions for the hydrogenation of 3-HPA to 1,3-PDO over the Ru–40Ni/SiO2 catalyst are temperature = 80 °C, H2 pressure = 2.0 MPa and LHSV = 0.4 h−1, considering the production capacity, requirements for facilities, and energy consumption.
Fig. 7d shows the yield of 1,3-PDO as a function of time on stream (TOS). One can see that the yield of 1,3-PDO is initially ca. 100% and this high level can be maintained for a TOS up to 60 h. On prolonging the TOS, the yield of 1,3-PDO decreases gradually, however, a ca. 70% yield of 1,3-PDO can be still reached after 132 h. The decrease in the yield of 1,3-PDO at a relatively long TOS is due to the deposition of byproducts with high molecular weights not only on the surface but also in the pores of the catalyst, which was evidenced from the N2-physisorption determination (see Table 2).
Table 4 lists a comparison of the yield of 1,3-PDO in this work and those in the literature10,13 under different conditions. One can see that the Ru–40Ni/SiO2 catalyst employed in this work provided the largest yield of 1,3-PDO among all the other catalysts reported in the literature. Considering the extremely low pressure (2.0 MPa) and high yield of 1,3-PDO, the catalyst developed in this work can be reasonably expected to possess a very large potential for its industrial application.
4. Conclusions
The bimetallic Ru–Ni/SiO2 catalyst possessed different textural and structural properties and presented an obviously high performance for the hydrogenation of 3-HPA to 1,3-PDO, relative to the corresponding monometallic catalysts. This was evidenced by the facts outlined as follows:(1) The introduction of Ru species increased the porosity of the catalyst due to the formation of a Si–O–Ru–O–Si structure. This favored both the diffusion of reactants and products and provided more available active sites, and thus increased both the yield of 1,3-PDO and the lifespan of the catalyst; (2) the presence of Ru species decreased the average size of the Ni particles and thus increased the degree of dispersion of Ni species via promotion of the interaction between Ni and the SiO2 support. This provided more active sites for the hydrogenation of 3-HPA to 1,3-PDO; (3) the great ability for the activation of H2 over the Ru species enabled the Ni species to be more easily reduced at relatively low temperatures and also the active hydrogen to be generated via a hydrogen spillover process. This helped the Ni species to be stabilized in the Ni0 state and thus increased both the conversion of 3-HPA and the selectivity to 1,3-PDO; (4) the Ru–40Ni/SiO2 provided a yield above 99.0% of 1,3-PDO at 2.0 MPa of H2 pressure, with this high level of yield being maintained for at least 60 h.
In summary, the Ru–Ni/SiO2 catalyst exhibited several merits, such as a high yield of 1,3-PDO, a relatively long lifespan, a low operation pressure of H2 and a small consumption of noble metal (1 mol% Ru). This enabled the Ru–Ni/SiO2 catalyst to be superior to other catalysts for the hydrogenation of 3-HPA to 1,3-PDO reported in the literature and thus possesses a very large potential for industrial application.
Acknowledgements
This work was supported by the National Natural Science Foundation of China (Grant No. 21376068), Program for New Century Excellent Talents in University, the Ministry of Education of P. R. China, and the Program for Fu-Rong Scholar in Hunan Province, P. R. China.References
- A. P. Zeng and H. Biebl, Adv. Biochem. Eng./Biotechnol., 2002, 74, 239–259 CrossRef CAS PubMed.
- D. R. Kelsey, US Pat., 6,093,786, 2000-07-25.
- C. S. Lee, M. K. Aroua, W. M. A. W. Daud, P. Cognet, Y. Pérès-Lucchese, P. L. Fabre, O. Reynes and L. Latapie, Renewable Sustainable Energy Rev., 2015, 42, 963–972 CrossRef CAS.
- M. A. Cervin, P. Soucaille and F. Valle, US Pat., 7,371,558, 2008-05-13.
- J. Oh, S. Dash and H. Lee, Green Chem., 2011, 13, 2004–2007 RSC.
- M. Schlaf, Dalton Trans., 2006, 39, 4645–4653 RSC.
- I. Furikado, T. Miyazawa, S. Koso, A. Shimao, K. Kunimori and K. Tomishige, Green Chem., 2007, 9, 582–588 RSC.
- S. Zhu, Y. Zhu, S. Hao, L. Chen, B. Zhang and Y. Li, Catal. Lett., 2012, 142, 267–274 CrossRef CAS.
- D. Arntz, T. Haas and A. Schafer-sindlinger, US Pat., 5,364,984, 1994-11-15.
- T. Haas, D. Yu, J. Sauer, D. Arntz, A. Freund and T. Tacke, US Pat., 6,232,511, 2001-05-15.
- T. Haas, G. Bohme and D. Arntz, US Pat., 5,284,979, 1994-02-08.
- T. Tsunoda and K. Nomura, US Pat., 6,911,566, 2005-06-28.
- D. Arntz and N. Wiegand, US Pat., 5,171,898, 1992-12-15.
- E. W. Zhao, R. Maligal-Ganesh, C. Xiao, T.-W. Goh, Z. Qi, Y. Pei, H. E. Hagelin-Weaver, W. Huang and C. R. Bowers, Angew. Chem., Int. Ed., 2017, 56, 3925–3929 CrossRef CAS PubMed.
- R. V. Maligal-Ganesh, C. Xiao, T. W. Goh, L.-L. Wang, J. Gustafson, Y. Pei, Z. Qi, D. D. Johnson, S. Zhang, F. Tao and W. Huang, ACS Catal., 2016, 6, 1754–1763 CrossRef CAS.
- C. Yuan, N. Yao, X. Wang, J. Wang, D. Lv and X. Li, Chem. Eng. J., 2015, 260, 1–10 CrossRef CAS.
- N. Yao, H. Ma, Y. Shao, C. Yuan, D. Lv and X. Li, J. Mater. Chem., 2011, 21, 17403–17412 RSC.
- S. Tada, R. Kikuchi, A. Takagaki, T. Sugawara, S. T. Oyama, K. Urasaki and S. Satokawa, Appl. Catal., B, 2013, 140–141, 258–264 CrossRef CAS.
- A. Zhao, W. Ying, H. Zhang, H. Ma and D. Fang, Catal. Commun., 2012, 17, 34–38 CrossRef CAS.
- C. Crisafulli, S. Scirè, S. Minicò and L. Solarino, Appl. Catal., A, 2002, 225, 1–9 CrossRef CAS.
- C. Crisafulli, S. Scirè, R. Maggiore, S. Minicò and S. Galvagno, Catal. Lett., 1999, 59, 21–26 CrossRef CAS.
- M. Cerro-Alarcón, A. Maroto-Valiente, I. Rodríguez-Ramos and A. Guerrero-Ruiz, Appl. Catal., A, 2004, 275, 257–269 CrossRef.
- A. Romero, A. Nieto-Márquez and E. Alonso, Appl. Catal., A, 2017, 529, 49–59 CrossRef CAS.
- S. Wang, Q. Yin, J. Guo, B. Ru and L. Zhu, Fuel, 2013, 108, 597–603 CrossRef CAS.
- K. Mori, K. Miyawaki and H. Yamashita, ACS Catal., 2016, 6, 3128–3135 CrossRef CAS.
- D. L. Li, I. Atake, T. Shishido, Y. Oumi, T. Sano and K. Takehira, J. Catal., 2007, 250, 299–312 CrossRef CAS.
- G. Oh, S. Y. Park, M. W. Seo, Y. K. Kim, H. W. Ra, J.-G. Lee and S. J. Yoon, Renewable Energy, 2016, 86, 841–847 CrossRef CAS.
- X. K. Li, W. J. Ji, J. Zhao, S. J. Wang and C. T. Au, J. Catal., 2005, 236, 181–189 CrossRef CAS.
- V. V. Kaichev, A. Y. Gladky, I. P. Prosvirin, A. A. Saraev, M. Hävecker, A. Knop-Gericke, R. Schlögl and V. I. Bukhtiyarov, Surf. Sci., 2013, 609, 113–118 CrossRef CAS.
- I. M. Kodintsev, S. Trasatti, M. Rubel, A. Wieckowski and N. Kaufher, Langmuir, 1992, 8, 283–290 CrossRef CAS.
- H. Y. H. Chan, C. G. Takoudis and M. J. Weaver, J. Catal., 1997, 172, 336–345 CrossRef CAS.
- M. Reinikainen, M. K. Niemelä, N. Kakuta and S. Suhonen, Appl. Catal., A, 1998, 174, 61–75 CrossRef CAS.
- A. A. Khassin, T. M. Yurieva, M. P. Demeshkina, G. N. Kustova, I. S. Itenberg, V. V. Kaichev, L. M. Plyasova, V. F. Anufrienko, I. Y. Molina, T. V. Larina, N. A. Baronskaya and V. N. Parmon, Phys. Chem. Chem. Phys., 2003, 5, 4025–4031 RSC.
- T. Robert, M. Bartel and G. Offergeld, Surf. Sci., 1972, 33, 123–130 CrossRef CAS.
- A. P. Jia, S. Y. Jiang, J. Q. Lu and M. F. Luo, J. Phys. Chem. C, 2010, 114, 21605–21610 CAS.
- X. Chen, M. Li, J. Guan, X. Wang, C. T. Williams and C. Liang, Ind. Eng. Chem. Res., 2012, 51, 3604–3611 CrossRef CAS.
- M. Sudhakar, V. V. Kumar, G. Naresh, M. L. Kantam, S. K. Bhargava and A. Venugopal, Appl. Catal., B, 2016, 180, 113–120 CrossRef CAS.
- F. Su, F. Y. Lee, L. Lv, J. Liu, X. N. Tian and X. S. Zhao, Adv. Funct. Mater., 2007, 17, 1926–1931 CrossRef CAS.
- T. Lopez, P. Bosch, M. Asomoza and R. Gomez, J. Catal., 1992, 133, 247–259 CrossRef CAS.
- C. Xiao, T.-W. Goh, Z. Qi, S. Goes, K. Brashler, C. Perez and W. Huang, ACS Catal., 2016, 6, 593–599 CrossRef CAS.
- K. S. W. Sing, D. H. Everett, R. A. W. Haul, L. Moscou, R. A. Pierotti, J. Rouquerol and T. Siemieniewska, Pure Appl. Chem., 1985, 57, 603–619 CrossRef CAS.
- L. He, Y. Xiong, M. Zhao, X. Mao, Y. Liu, H. Zhao and Z. Tang, Chem.–Asian J., 2013, 8, 1765–1767 CrossRef CAS PubMed.
- J. S. Hu, L. L. Ren, Y. G. Guo, H. P. Liang, A. M. Cao, L. J. Wan and C. L. Bai, Angew. Chem., 2005, 117, 1295–1299 CrossRef.
- L. He, Y. Liu, J. Liu, Y. Xiong, J. Zheng, Y. Liu and Z. Tang, Angew. Chem., Int. Ed., 2013, 52, 3741–3745 CrossRef CAS PubMed.
- R. D. Gonzalez, T. Lopez and R. Gomez, Catal. Today, 1997, 35, 293–317 CrossRef CAS.
- B. H. Chen, W. Liu, A. Li, Y. J. Liu and Z. S. Chao, Dalton Trans., 2015, 44, 1023–1038 RSC.
- M. Che, Z. X. Cheng and C. Louis, J. Am. Chem. Soc., 1995, 117, 2008–2018 CrossRef CAS.
- F. Pompeo, N. N. Nichio, M. G. González and M. Montes, Catal. Today, 2005, 107–108, 856–862 CrossRef CAS.
- J. W. E. Coenen, Appl. Catal., 1989, 54, 65–78 CrossRef CAS.
- K. Q. Sun, E. Marceau and M. Che, Phys. Chem. Chem. Phys., 2006, 8, 1731–1738 RSC.
- B. Pawelec, S. Damyanova, K. Arishtirova, J. L. G. Fierro and L. Petrov, Appl. Catal., A, 2007, 323, 188–201 CrossRef CAS.
- R. Lanza, S. G. Järås and P. Canu, Appl. Catal., A, 2007, 325, 57–67 CrossRef CAS.
- G. Poncelet, M. A. Centeno and R. Molina, Appl. Catal., A, 2005, 288, 232–242 CrossRef CAS.
- M. Besson, P. Gallezot, A. Pigamo and S. Reifsnyder, Appl. Catal., A, 2003, 250, 117–124 CrossRef CAS.
- G. Valerius, X. Zhu, H. Hofmann, D. Arntz and T. Haas, Chem. Eng. Process., 1996, 35, 11–19 CrossRef.
- X. D. Zhu, G. Valerius, H. Hofmann, T. Haas and D. Arntz, Ind. Eng. Chem. Res., 1997, 36, 2897–2902 CrossRef CAS.
- J. P. Arhancet, P. Himelfarb, J. B. Powell, R. A. Plundo, M. S. Kazi and W. J. Carrick, US Pat., 6,342,464, 2002-01-29.
- X. D. Zhu and H. Hofmann, Appl. Catal., A, 1997, 155, 179–194 CrossRef.
- X. D. Zhu and H. Hofmann, Chem. Eng. Technol., 1997, 20, 131–137 CrossRef CAS.
Footnotes |
| † Electronic supplementary information (ESI) available. See DOI: 10.1039/c7ra01184a |
| ‡ These authors contributed equally to this work. |
| This journal is © The Royal Society of Chemistry 2017 |