
 Open Access Article
 This Open Access Article is licensed under a
 Creative Commons Attribution 3.0 Unported Licence
Electrodeposition: a versatile, efficient, binder-free and room temperature one-step process to produce MnO2 electrochemical capacitor electrodes†
R. Della Noce *a,
S. Eugénioa,
T. M. Silvaab,
M. J. Carmezimac and
M. F. Montemora
*a,
S. Eugénioa,
T. M. Silvaab,
M. J. Carmezimac and
M. F. Montemora
aCentro de Química Estrutural-CQE, Departament of Chemical Engineering, Instituto Superior Técnico, Universidade de Lisboa, 1049-001 Lisboa, Portugal. E-mail: rodrigo.noce@tecnico.ulisboa.pt
bDepartment of Mechanical Engineering, GI-MOSM, Instituto Superior de Engenharia de Lisboa, 1950-062 Lisboa, Portugal
cESTSetúbal, Instituto Politécnico de Setúbal, 1959-007 Setúbal, Portugal
First published on 26th June 2017
Abstract
The use of room temperature cathodic electrodeposition to produce MnO2 electrochemical capacitor electrodes is demonstrated. By employing a permanganate-based bath, birnessite-type MnO2 electrodes are directly obtained with no further heat treatment. Moreover, a crystalline/amorphous structural transition is observed as the applied current density is increased up to 50 mA cm−2.
1. Introduction
Manganese oxides are multifunctional materials that display a myriad of applications in advanced catalysis,1 Li-ion rechargeable batteries,2,3 microbial fuel cells,4,5 and electrochemical capacitors.6,7 They have been produced by a variety of chemical and physical methods such as hydrothermal synthesis,8 sol–gel process,9 physical vapor deposition (PVD),10 chemical vapor deposition (CVD),11 and electrodeposition.12 Among these techniques, electrodeposition has stood out mainly owing to its cost-effectiveness, relatively low temperature operating conditions, lower energy and space requirement, and easily maintained equipment. In fact, Dini showed that PVD processes may be as much as ten times more costly than electrodeposition.13 Electrodeposition also allows the deposition of the active material directly on the current collector, eliminating the need for binders and extra-process steps. Furthermore, thickness, and structural and morphological properties of the deposits can be tailored by relatively simple parameters such as potential, current density, bath concentration, pH, and temperature.The fabrication of electrodeposited manganese oxides, in particular MnO2, has been demonstrated by two main routes:6,14
(1) Anodic deposition: by employing sulfate-, nitrate or acetate-based baths according to the following reaction:
| MnO2 + 4H+ + 2e− ⇌ Mn2+ + 2H2O E0 = 1.224 V | (1) |
| MnO4− + 2H2O + 3e− ⇌ MnO2 + 4OH− E0 = 0.595 V | (2) |
| Mn2+ + 2OH− → Mn(OH)2 | (3) |
After subsequent heat treatment, which in general is done at about 300 °C,16 to dehydrate the manganese hydroxide, MnO2 is finally obtained.
In this work, the use of room temperature cathodic electrodeposition to produce MnO2 electrochemical capacitor (EC) electrodes is reported. By employing permanganate (MnO4−)-based bath, birnessite-type MnO2 electrodes are directly obtained with no further heat treatment. Although, some papers have described the production of MnO2 EC electrodes by this method,12,14,17 as far as we know, the influence of the applied current density on the structure and capacitive performance of MnO2 electrodes has not yet been described. Here, it is demonstrated by means of X-ray diffractometry (XRD) that a crystalline/amorphous structural transition is observed as the applied current density is increased up to 50 mA cm−2.
2. Experimental
2.1. MnO2 electrodeposition
MnO2 was galvanostatically electrodeposited onto stainless steel (AISI 304, Goodfellow) from a bath composed of 0.01 M KMnO4 and 0.1 M Na2SO4. The bath pH was set to 7 by adding dilute NaOH. Analytical grade chemicals were used to prepare all solutions. The MnO2 deposits were obtained by using a Gamry Interface 5000E potentiostat/galvanostat at room temperature. A three-electrode conventional cell was used for all electrochemical experiments. The applied current density (ic) was varied from 0.5 up to 50 mA cm−2 maintaining the same charge density (2 C cm−2). The mass of MnO2 deposits was directly measured using an electronic microbalance (Sartorius, model MC 5 d = 0.01/0.1 mg). The mass loading of the active material was obtained in all cases by subtracting the substrate mass from the total weight. In general, the mass loading of the deposits ranged from 0.3 to 1.45 mg.2.2. Morphological and structural characterization
The morphology of the deposits was characterized by scanning electron microscopy (SEM) using a JEOL model JSM-7001F field emission gun SEM equipped with energy dispersive X-ray spectroscopy (EDX). The X-ray diffractometry (XRD) measurements were performed using Cu Kα radiation (1.5418 Å) in a Bruker AXS D8 Advance instrument at 0.002° s−1 scan rate, a slow scan rate to avoid peak widening. Raman spectra were acquired (Horiba LabRAM HR800 Evolution) using the radiation source with a solid-state laser operating at 532 nm with an output power of 20 mW. The Raman band of a silicon wafer at 520 cm−1 was used to calibrate the spectrometer. The spectra were collected between 200 and 800 cm−1 with the sample exposed to the air under ambient conditions and obtained with an acquisition time of 30 s and 15 accumulations. A spectrograph with a 600 lines per mm grating was used. A 50 times objective lens focused the laser beam on the sample surface.2.3. Electrochemical characterization
The electrochemical performance of MnO2/SS electrodes was assessed by cyclic voltammetry (CV) and chronopotentiometry (charge–discharge curves). A platinum plate and a saturated calomel electrode (SCE) were used as counter and reference electrodes, respectively. All the experiments were performed in freshly prepared 1 M Na2SO4 electrolyte at room temperature. Charge–discharge curves were conducted in a potential range from −0.1 to 0.9 V applying a specific current of 1 A g−1. Furthermore, a long-term cycling test constituted of 5000 cycles at 5 A g−1 was carried out to verify the MnO2/SS electrode (ic = 50 mA cm−2) stability. No conditioning was performed prior to the long-term cycling test.3. Results and discussion
Fig. 1 displays the potential vs. time (E × t) profiles for the galvanostatic electrodeposition of MnO2 onto SS by applying different current densities in the range 0.5 to 50 mA cm−2. The potential increases with ic, reaching a maximum of about 5 V at ic = 50 mA cm−2. When ic = 0.5 mA cm−2, no MnO2 deposition takes place and then, it can be inferred that MnO2 is only formed for higher ic values.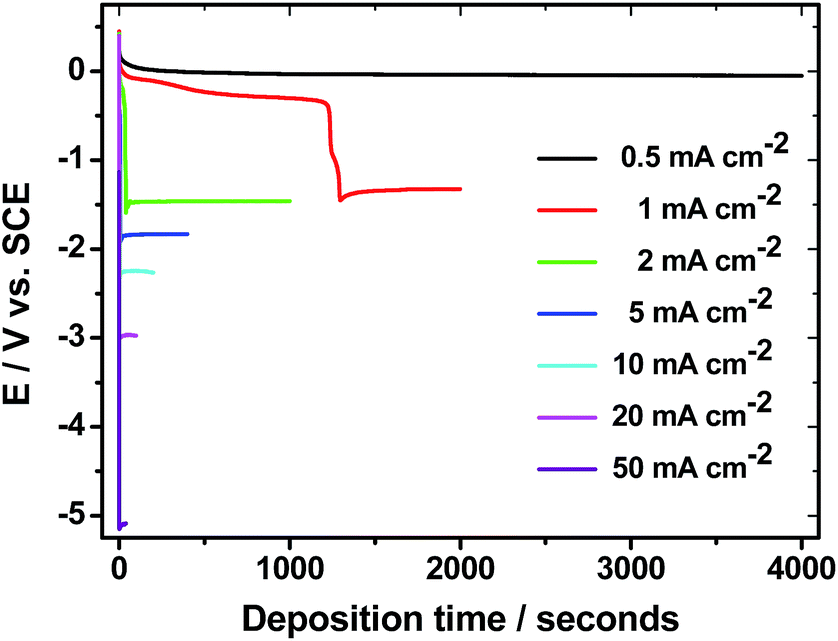 | ||
| Fig. 1 E–t profiles for the electrodeposition of MnO2 onto SS by applying different applied current densities. Total charge density: 2 C cm−2. | ||
By using Faraday's law of electrolysis, it is possible to estimate the global current efficiency of the MnO2 electrodeposition process as follows:18
| m = QM/(Fz) | (4) |
![[thin space (1/6-em)]](https://www.rsc.org/images/entities/char_2009.gif) 485 C mol−1, M (g mol−1) is the molecular weight of MnO2 and z is the number of electrons transferred from Mn7+ to Mn4+. As the mass of the deposits is known, the current efficiency of the MnO2 electrochemical process can be calculated as summarized in Table 1.
485 C mol−1, M (g mol−1) is the molecular weight of MnO2 and z is the number of electrons transferred from Mn7+ to Mn4+. As the mass of the deposits is known, the current efficiency of the MnO2 electrochemical process can be calculated as summarized in Table 1.
| i/mA cm−2 | Deposited mass/mg | CE/% | Thickness/μm | Thickness (SEM)/μm |
|---|---|---|---|---|
| 1 | 1.45 | 96.6 | 1.15 | — |
| 2 | 1.05 | 69.9 | 0.83 | 6.4 |
| 5 | 0.80 | 53.3 | 0.64 | 3.9 |
| 10 | 0.65 | 43.3 | 0.52 | 2.3 |
| 20 | 0.50 | 33.3 | 0.40 | 2.0 |
| 50 | 0.30 | 20.0 | 0.25 | 0.9 |
As expected, increasing ic leads to a decrease of the current efficiency due to the increase of hydrogen evolution reaction. The deposit obtained at 1 mA cm−2 shows a current efficiency close to 100%. In fact, in industrial electroplating processes, a high current efficiency is always desirable in order to minimize the electricity consumption. Considering the MnO2 density as 5.03 g cm−3, the deposits thickness can be also obtained (Table 1). For the same reason, i.e. hydrogen evolution reaction, the deposits thickness decreases as ic increases, ranging from ca. 1.2 μm to 250 nm. Nevertheless, for these thicknesses calculations is assumed that the formed films are not porous which is not verified when SEM images (Fig. 2 and 3) are analyzed. For this reason, cross-section SEM images of the MnO2/SS electrodes have been performed to obtain more realistic values of the deposits thickness, which are also displayed in Table 1. In this case, the values of thickness range from approximately 6.4 to 0.9 μm for the deposits obtained at ic = 2 and 50 mA cm−2, respectively. These values are different from those previously obtained from MnO2 density consideration and can be explained based on the porosity of the deposits. The same trend, i.e. the deposits thickness decreases as ic increases, is observed in the case of the thicknesses estimation by cross-section SEM images of the MnO2/SS electrodes. If thicker films are desirable, porous substrates can be employed. Indeed, Su and Zhitomirsky19 have recently demonstrated that MnO2 electrodes with mass loading of 13 mg cm−2 can be successfully electrodeposited by utilizing a porous Ni plaque as substrate. Most of works related to MnO2 and other ECs electrodes has been devoted to obtain high mass loadings (on the order of 10 mg cm−2)20 materials required for commercial applications, nevertheless, thin films EC electrodes technology has successfully emerged in last decades. In this sense, electrodeposited thin films electrodes have been utilized in semiconductor devices, integrated circuit fabrication, and multilayer ceramic substrates. In these cases, it is difficult to obtain large specific capacitance (SC) values (e.g. > 0.1 mF cm−2) with electrostatic capacitor technology but quite easy with using EC technology. Voltage in such circuits is relatively low in which an aqueous electrolyte device as a single cell, especially if of the asymmetric design, will have sufficient operating voltage. In addition, the most popular process nowadays used to make EC electrodes (both in laboratory and in industry) is slurry coating, which is limited in its minimum thickness to the size of particles in the slurry, typically 1 to 5 micrometers. By employing electrodeposition, much thinner electrodes, even approaching few nanometers thickness, can be obtained. Therefore, electrodeposition can be considered as an efficient and versatile technique to produce either thin or thick MnO2 EC electrodes by simply modulating the applied current density. In order to analyze the morphology of MnO2/SS electrodes, scanning microscopy electron (SEM) has been employed. Fig. 2 depicts the top-view SEM images of MnO2 electrodeposits obtained at various ic. Microspheres are noticed along the whole deposit which are indeed composed of nanoflakes, as shown in Fig. 1S,† under high magnification. In fact, MnO2 nanoflakes electrodes have been obtained by anodic electrodeposition as recently reported by Mai et al.21 Moreover, it is clear that a grain refinement occurs as ic increases leading to the formation of reduced grains at higher ic values (see Fig. 2S in ESI†).
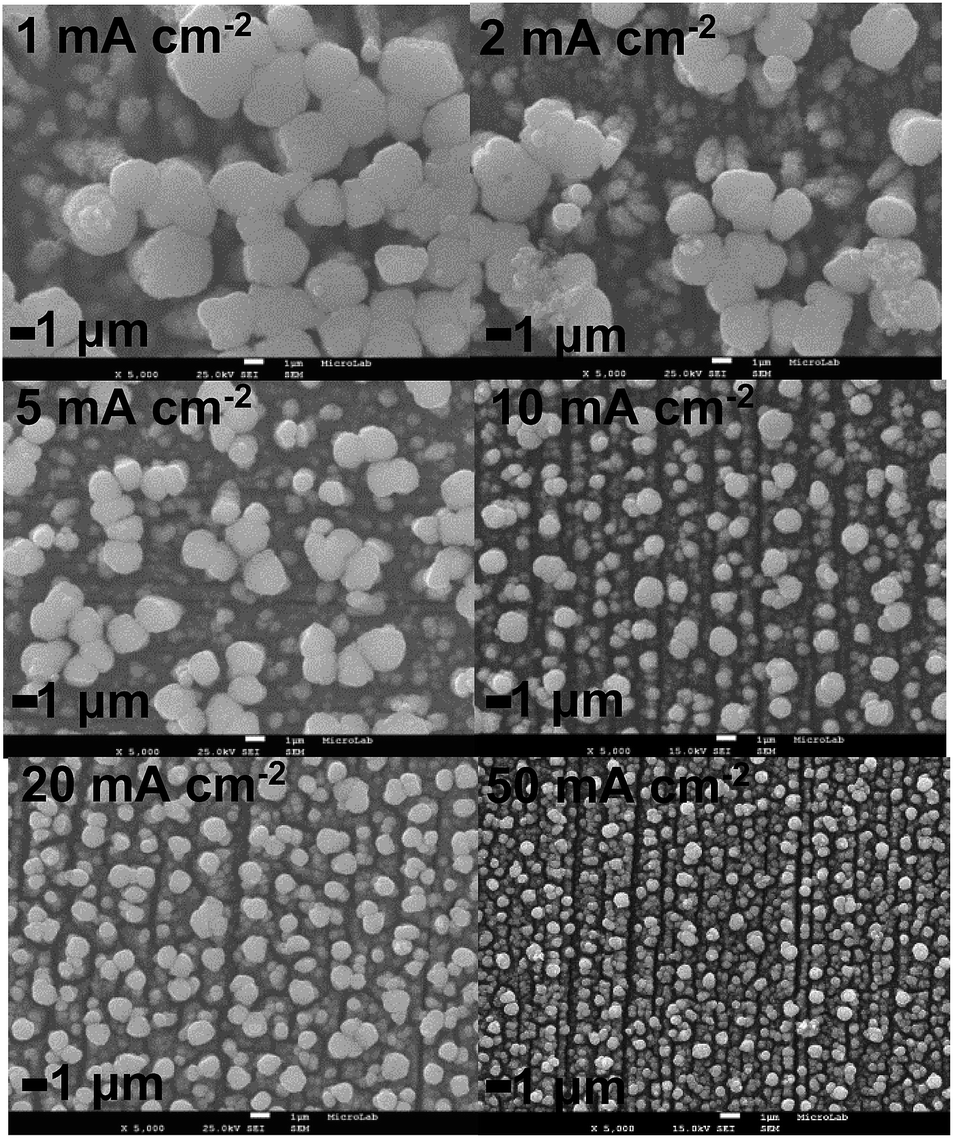 | ||
| Fig. 2 Top-view SEM images of MnO2/SS electrodes obtained at various ic. | ||
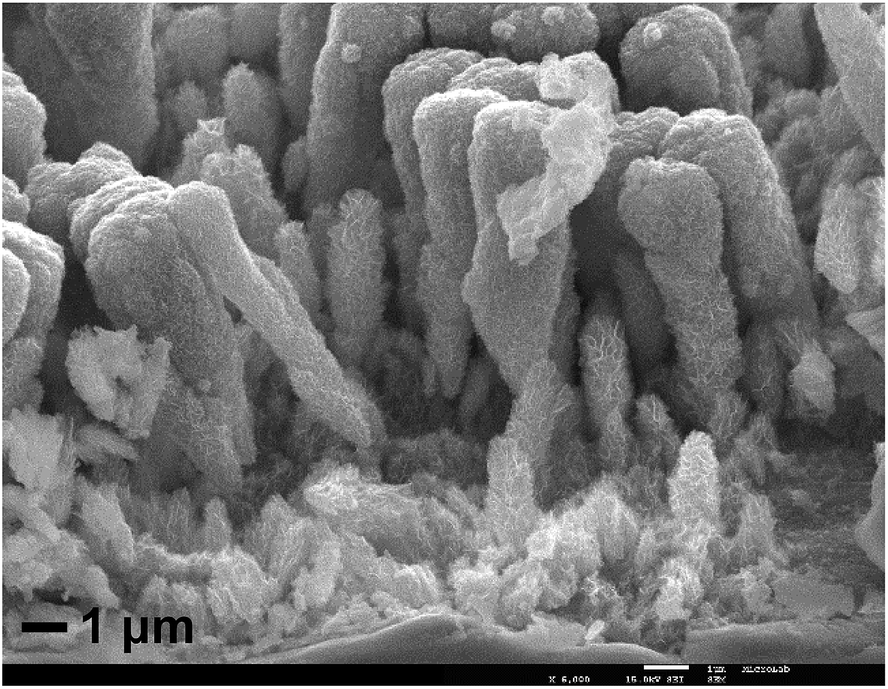 | ||
| Fig. 3 Cross-section SEM image of MnO2/SS electrode obtained at 2 mA cm−2. | ||
As mentioned above, cross-section SEM images have been acquired in order to estimate the deposits thickness. Fig. 3 illustrates the cross-section SEM image of MnO2/SS electrode obtained at 2 mA cm−2. The average thickness in this case is about 6.4 μm. The average thickness values for the deposits obtained in the range 2–50 mA cm−2 are listed in Table 1.
XRD and Raman Spectroscopy have been utilized to determine the structure of the MnO2/SS electrodes. Fig. 4a shows the XRD patterns of MnO2/SS electrodes obtained for ic values in the range 1–50 mA cm−2. The samples obtained at ic < 20 mA cm−2 exhibit two main peaks at 12.4° and 24.8°, and one broad peak at 36.9° which correspond to (001), (002) and (020) planes of the δ-MnO2 (JCPDS no. 18-0802) confirming the Na-birnessite structure formation.12,22 It is important to highlight that the Na-birnessite structure, obtained in this work, is only stabilized by the presence of Na+ cations which is present in the electrochemical bath. If no Na2SO4 is initially present, amorphous electrodeposits are achieved as illustrated in Fig. 3S,† for a sample prepared under the same conditions except the Na2SO4 addition to the bath. This observation is in full agreement with the work reported by Tanimoto et al.12 that obtained K-birnessite MnO2 electrodes from a MnO4-based bath containing K+ ions. In addition, the XRD patterns show an amorphous (absence of long range order) state for the samples obtained at ic = 20 and 50 mA cm−2. This is attributed to the effect of grain refinement (decreased particle size) as ic increases, as confirmed by SEM analysis (Fig. 2), which leads to diffraction peak broadening that, ultimately, are not detectable anymore by XRD. The crystalline or amorphous nature of the electrodeposited materials might influence the capacitive performance of the electrodes as will be described below. With regard to the Raman spectra, depicted in Fig. 4b, four major vibrational features corresponding to MnO2 are observed at 297, 498, 576 and 638 cm−1. The band at 576 cm−1 is related to the Mn–O stretching vibration in the basal plane of [MnO6] sheets while the band located at 638 cm−1 is attributed to the symmetric Mn–O stretching vibration of MnO6 groups.23 The bands at 297 and 498 cm−1 are of weak intensity as previously reported by Julien et al.,23 and may not be visible depending on the preparation method.
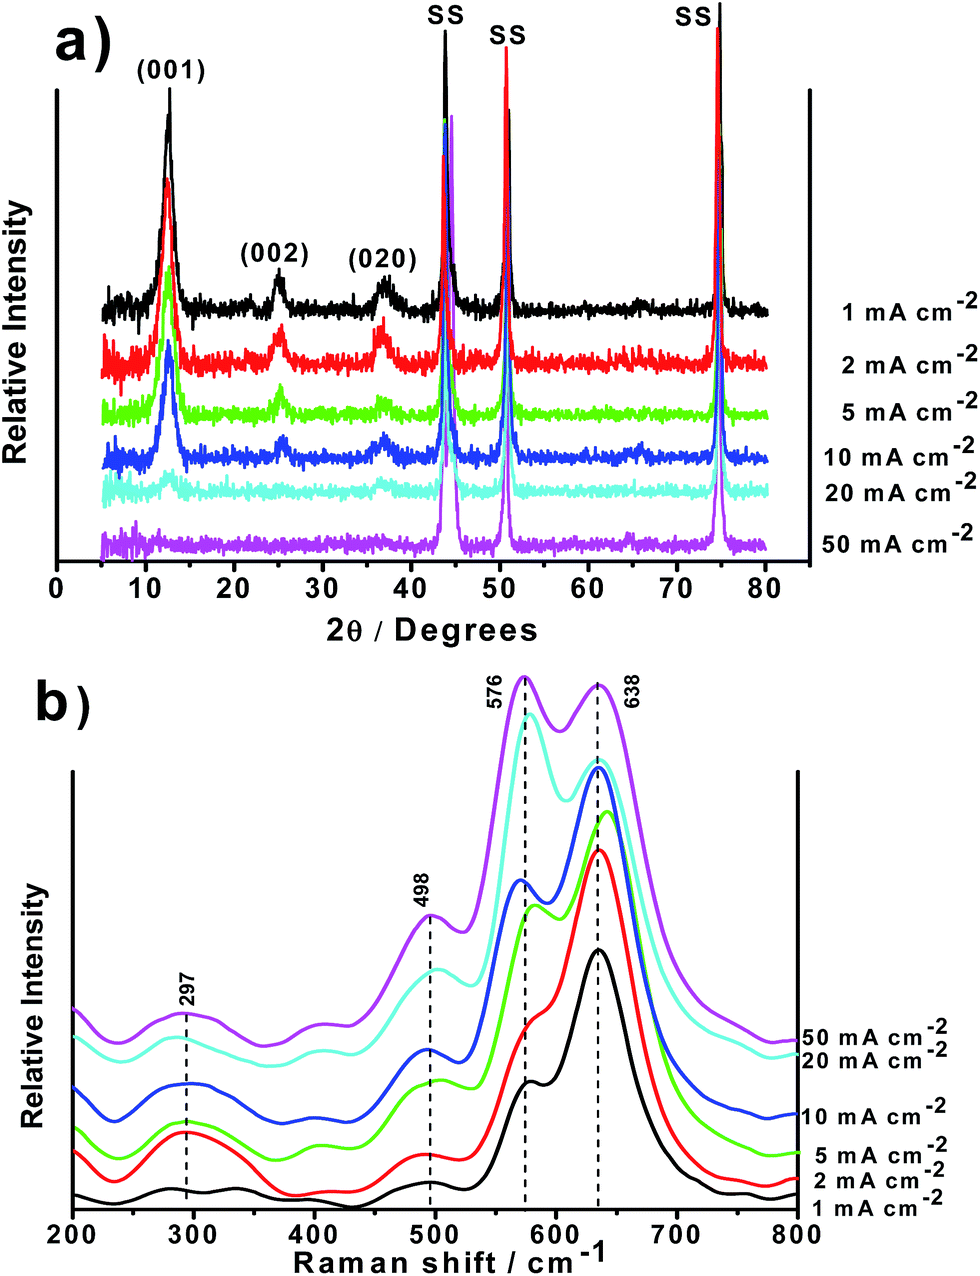 | ||
| Fig. 4 XRD patterns (a) and Raman spectra (b) of birnessite-type MnO2/SS electrodes obtained at various ic. | ||
The capacitive performance of the prepared MnO2/SS electrodes has been analyzed by cyclic voltammetry and chronopotentiometry (charge–discharge curves) in 1 M Na2SO4 solution. Fig. 5a exhibits the cyclic voltammograms (CVs) of the different MnO2/SS electrodes in 1 M Na2SO4. All CVs show a near-rectangular shape typical of MnO2 materials with a working potential window of 1.1 V. In addition, it is noticed that the specific current increases as ic also increases. This is an indication of higher electrochemical activity which in turn leads to higher materials specific capacitance (inset of Fig. 5b). Knowing the potential limits from CVs, charge–discharge curves have been performed. A characteristic charge–discharge curve of MnO2/SS electrode obtained at ic = 50 mA cm−2 is illustrated in Fig. 5b. All curves, regardless ic, present the same behavior, a near-triangular curve, with an operating working potential of 1 V, which is representative of pseudocapacitive materials such as MnO2 and RuO2.24 The materials SC calculated from charge–discharge curves, shown in the inset of Fig. 4b, exhibits values from 170 up to 300 F g−1 depending on ic. These SC values are comparable to those found in literature for similar synthetic conditions.14,25 For instance, Jacob and Zhitomirsky showed that electrodeposited MnO2 films, prepared by cathodic reduction of KMnO4 solutions, with thickness ranging from 0.1 to 2 μm, display SC values up to 279 F g−1.14 In other work, the same group studied the effect of heat treatment on the MnO2/SS electrodes obtained by cathodic electrodeposition at 2 mA cm−2. The highest SC of ∼353 F g−1 was obtained for the 45 μg cm−2 film at a scan rate of 2 mV s−1. The capacitance decreased with increasing scan rate and film thickness. Heat treatment at 200 °C resulted in the reduced porosity and enhanced crystallinity of the films. Compared to the as-prepared films, the films heat treated at 200 °C exhibited lower SC at scan rates below 10 mV s−1 and higher SC at scan rates above 10 mV s−1.25
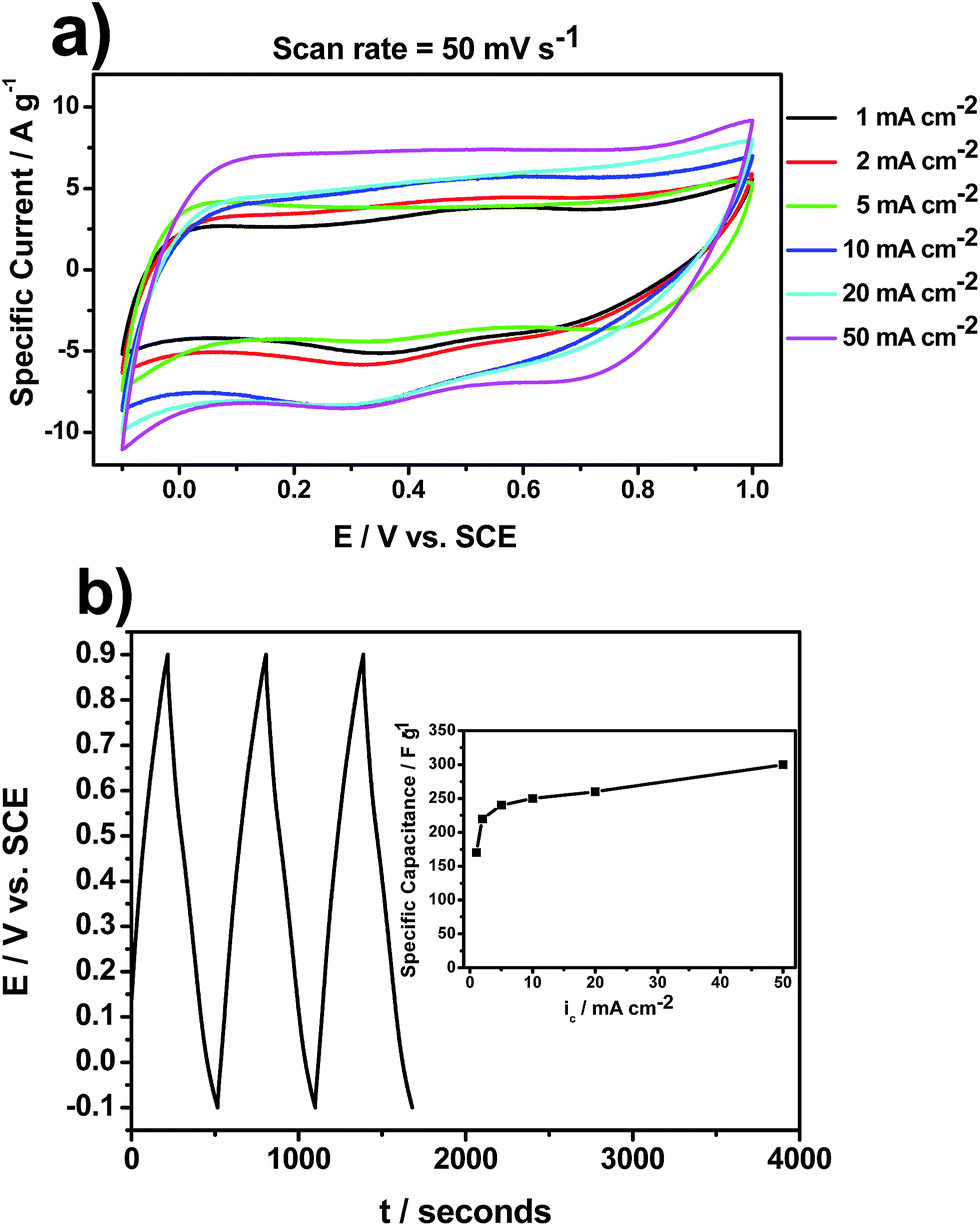 | ||
| Fig. 5 CVs of MnO2/SS electrodes obtained at various ic (a). Typical charge–discharge curve for MnO2/SS electrode obtained at ic = 50 mA cm−2 (b). Inset shows the variation of specific capacitance as function of ic for all studied MnO2/SS electrodes. Electrolyte: 1 M Na2SO4. | ||
It is evident that the deposits thickness plays an important role on SC since MnO2 displays in general poor electrical conductivity,6 hence, a decrease in film thickness leads to an increase in SC. As a matter of fact, it has been demonstrated that MnO2 thin films can display high gravimetric capacitances, e.g. in some cases higher than 2000 F g−1, which strongly depends on the preparation method.26 The SC value in MnO2 films has been depicted to decrease with increasing film thickness, mostly owing to a combination of reduced electrolyte access and increased distance from the current collector, which lead to increased electrical resistance.27 Additionally, the grain refinement and more amorphous structure that occurs in the electrodeposited films with increasing ic also contributes to the higher SC values achieved. It has been reported that the NiO SC from bulk contribution may be at least three times larger in amorphous than in crystalline films for the same surface area.28 Therefore, in the case of MnO2-based materials, besides thickness (mass loading), is also important to tailor the crystallinity to exploit their full potential in order to increase SC.
Besides SC, which plays a pivotal role to increase EC's energy density, two other important parameters to evaluate ECs performance are the rate capability and cyclability. Fig. 6a displays the rate capability for all prepared MnO2/SS electrodes performed from 1 to 10 A g−1. In all cases, there is a considerable decrease in SC as the current density increases which seems to be more pronounced in the samples prepared at low values of ic. For example, in the case of the sample prepared at 50 mA cm−2, about 60% of its SC is retained while for ic = 1 mA cm−2 the SC retention is only 45%.
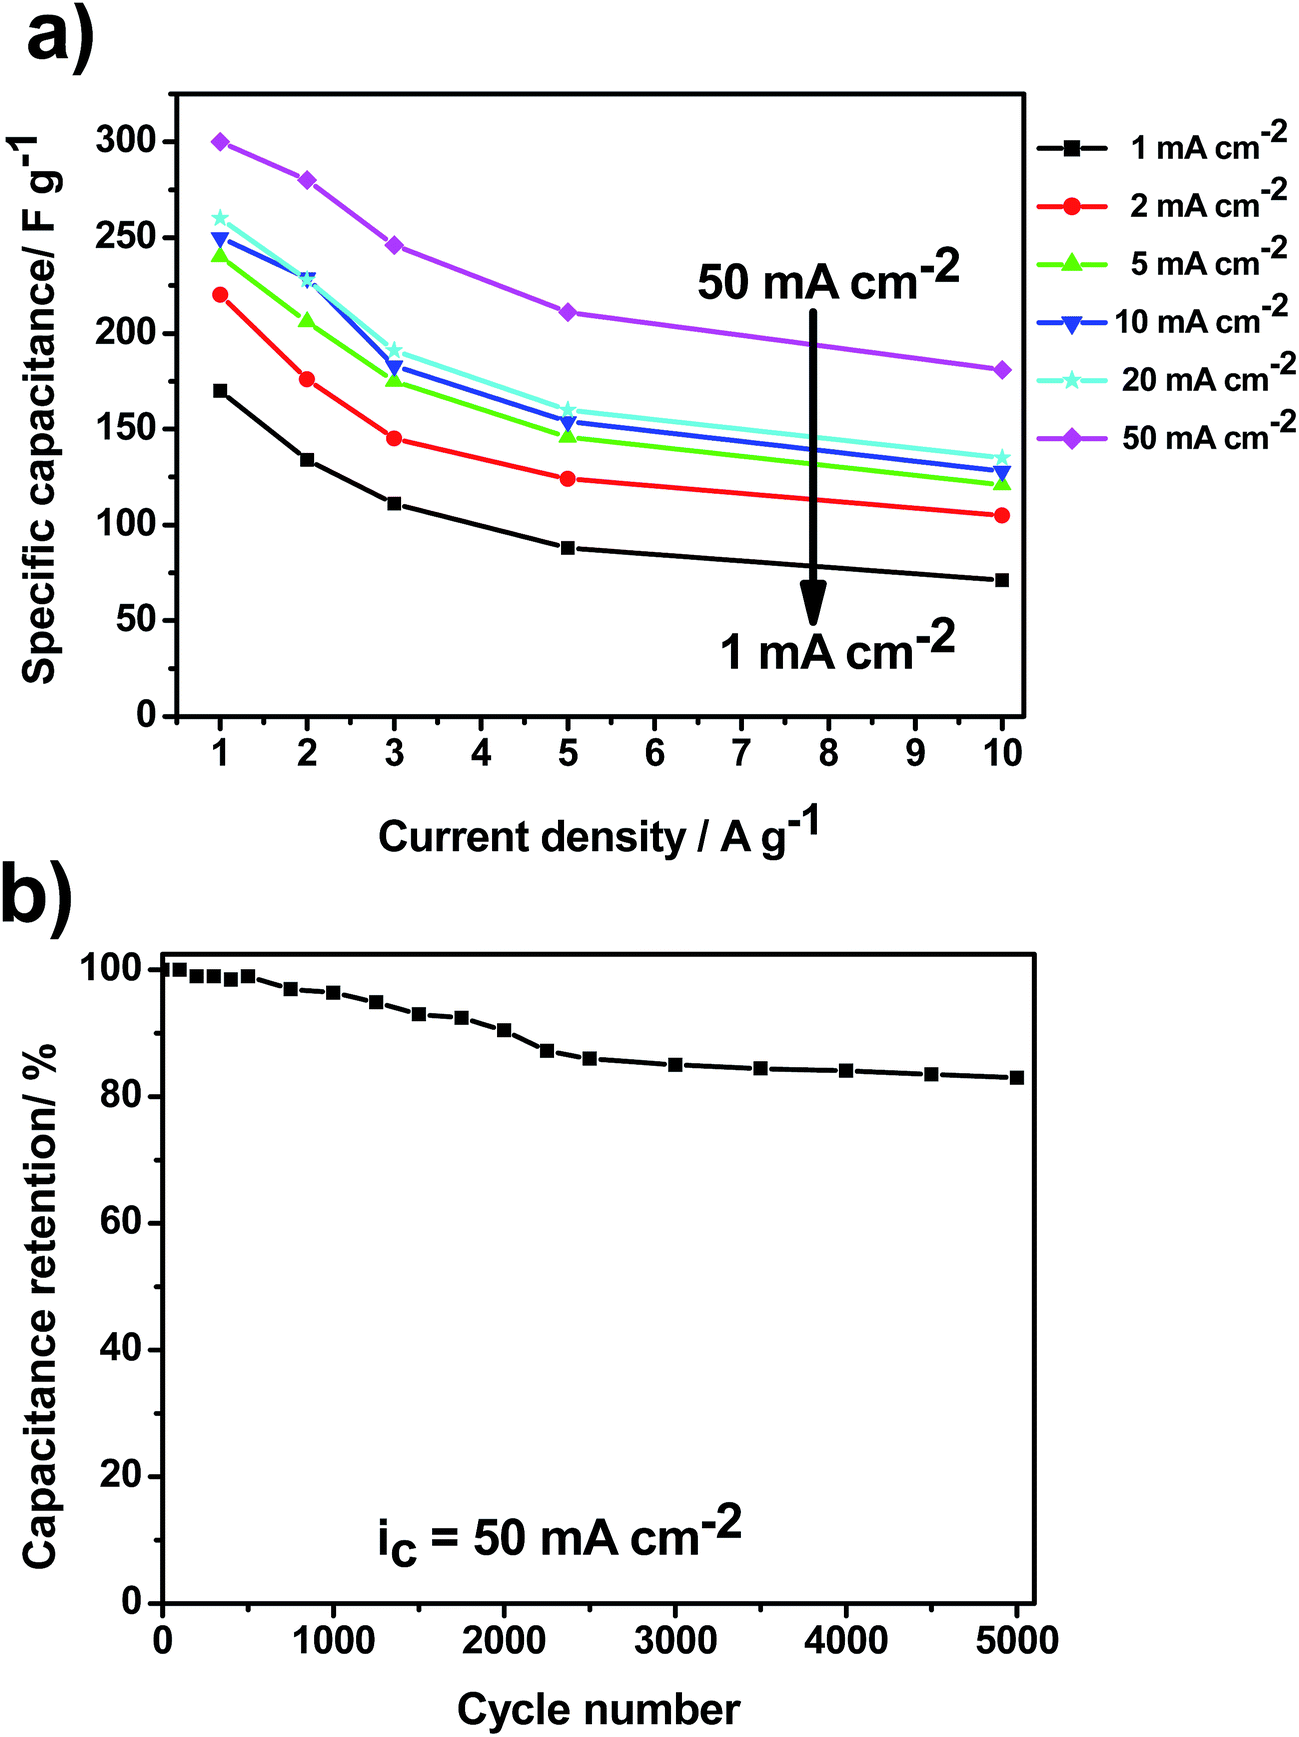 | ||
| Fig. 6 Rate capability at various current densities for all prepared MnO2/SS electrodes (a). Capacitance retention as a function of cycle number for the MnO2/SS electrode prepared at 50 mA cm−2 by applying 5 A g−1 (b). | ||
As mentioned above, this is due to the MnO2 poor electrical conductivity that directly affects the electrodes SC. If one desires to circumvent this MnO2 drawback, in order to obtain high performance EC materials, three well-established strategies might be used:6 (1) production of mixed oxides: transition metal elements, such as Ni, Cu, Fe, V, Co, Mo and Ru, can be incorporated to MnO2 enhancing the electrical conductivity and charge-storage capability of the resulting mixed oxide, (2) MnO2 doping: MnO2 modified electrodes can be doped with small amount of other metallic elements, e.g., Al, Sn and Pb which leads to a significant increase on the electronic conductivity and, consequently, on the specific capacitance and rate capacity, and (3) formation of composite electrodes: utilization of porous architectures such as carbon nanofoams, templated mesoporous carbon and nanographite, to form MnO2/carbon-based composite electrodes. In this approach, carbon not only acts as the physical support of MnO2 but also gives rise to channels for charge transport. Its high electronic conductivity enhances the rate capability and power density at large charge/discharge currents.29 With regard to MnO2/SS electrodes cyclability, a long-term test performing 5000 cycles at 5 A g−1 has been carried out in 1 M Na2SO4 solution. Fig. 6b shows the capacitance retention as a function of cycle number for the sample obtained at 50 mA cm−2. Capacitance retention of ca. 83% is noticed after 5000 cycles indicating an excellent cycle life under the proposed experimental conditions.
4. Conclusions
In summary, the use of room temperature cathodic electrodeposition to produce MnO2 electrochemical capacitor electrodes has been demonstrated. By employing a permanganate-based bath, birnessite-type MnO2 electrodes are directly obtained with no further heat treatment. In addition, the influence of applied current density (ic) on the structure and capacitive performance of MnO2 electrodes has been studied. By simply modulating ic, either crystalline (δ-phase) or amorphous MnO2 electrodes are obtained. Specific capacitance values ranging from 170 up to 300 F g−1 at 1 A g−1 are achieved depending on ic. Electrodeposition has shown to be a versatile (thin or thick), efficient (high current efficiencies can be obtained), binder-free and room-temperature technique to produce MnO2 electrochemical capacitor electrodes.Acknowledgements
The authors would like to acknowledge FCT for financial support under the projects M-ERA.NET/0002/2012, M-ERA.NET/0004/2014 and PEst-OE/QUI/UI0100/2013. We also thank Prof. Teresa Duarte and Prof. Luis Santos (CQE/IST) for XRD and Raman facilities, respectively. We are indebted to Professor John Miller (JME, Inc., USA) that kindly reviewed the manuscript.References
- Y.-S. Ding, X.-F. Shen, S. Sithambaram, S. Gomez, R. Kumar, V. M. B. Crisostomo, S. L. Suib and M. Aindow, Chem. Mater., 2005, 17, 5382–5389 CrossRef CAS.
- A. R. Armstrong and P. G. Bruce, Nature, 1996, 381, 499–500 CrossRef CAS.
- F. Cheng, J. Zhao, W. Song, C. Li, H. Ma, J. Chen and P. Shen, Inorg. Chem., 2006, 45, 2038–2044 CrossRef CAS PubMed.
- M. Lua, S. Kharkwal, H. Y. Ng and S. F. Y. Li, Biosens. Bioelectron., 2011, 26, 4728–4732 CrossRef PubMed.
- X. Li, B. Hu, S. Suib, Y. Lei and B. Li, J. Power Sources, 2010, 195, 2586–2591 CrossRef CAS.
- W. Wei, X. Cui, W. Chena and D. G. Ivey, Chem. Soc. Rev., 2011, 40, 1697–1721 RSC.
- G.-R. Xu, X.-P. Min, Q.-L. Chen, Y. Wen, A.-P. Tang and H.-S. Song, J. Alloys Compd., 2017, 691, 1018–1023 CrossRef CAS.
- S.-K. Park, A. Jin, S.-H. Yu, J. Ha, B. Jang, S. Bong, S. Woo, Y.-E. Sung and Y. Piao, Electrochim. Acta, 2014, 120, 452–459 CrossRef CAS.
- A. Sarkar, A. K. Satpati, V. Kumar and S. Kumar, Electrochim. Acta, 2015, 167, 126–131 CrossRef CAS.
- Y. Chae, J. K. Lee and W. Choi, J. Electroanal. Chem., 2014, 730, 20–25 CrossRef CAS.
- K. Neishi, S. Aki, K. Matsumoto, H. Sato, H. Itoh, S. Hosaka and J. Koike, Appl. Phys. Lett., 2008, 93, 032106 CrossRef.
- T. Tanimoto, H. Abe, K. Tomono and M. Nakayama, ECS Trans., 2013, 50, 61–70 CrossRef.
- J. W. Dini, Plat. Surf. Finish., 1993, 80, 26–29 CAS.
- G. M. Jacob and I. Zhitomirsky, Appl. Surf. Sci., 2008, 254, 6671–6676 CrossRef CAS.
- CRC Handbook of Chemistry and Physics, ed. D. R. Lide, CRC Press/Taylor and Francis, Boca Raton, FL, 89th edn, 2009 Search PubMed.
- T. Yousefia, A. N. Golikand, M. H. Mashhadizadeh and M. Aghazadeh, J. Solid State Chem., 2012, 190, 202–207 CrossRef.
- M. A. Cheney, S. W. Joo, A. Banerjee and B.-K. Min, J. Colloid Interface Sci., 2012, 379, 141–143 CrossRef CAS PubMed.
- X. Hu, X. Lin, Z. Ling, Y. Li and X. Fu, Electrochim. Acta, 2014, 138, 132–138 CrossRef CAS.
- Y. Su and I. Zhitomirsky, Adv. Eng. Mater., 2014, 16, 760–766 CrossRef CAS.
- H. Wang, C. M. B. Holt, Z. Li, X. Tan, B. S. Amirkhiz, Z. Xu, B. C. Olsen, T. Stephenson and D. Mitlin, Nano Res., 2012, 5, 605–617 CrossRef CAS.
- L. Mai, H. Li, Y. Zhao, L. Xu, X. Xu, Y. Luo, Z. Zhang, W. Ke, C. Niu and Q. Zhang, Sci. Rep., 2013, 3, 1718 CrossRef.
- I. Atribak, A. Bueno-Lopez, A. Garcıa-Garcia, P. Navarro, D. Frıas and M. Montes, Appl. Catal., B, 2010, 93, 267–273 CrossRef CAS.
- C. Julien, M. Massot, R. Baddour-Hadjean, S. Franger, S. Bach and J. P. Pereira-Ramos, Solid State Ionics, 2003, 159, 345–356 CrossRef CAS.
- B. E. Conway, J. Electrochem. Soc., 1991, 138, 1539–1548 CrossRef CAS.
- J. Wei, N. Nagarajan and I. Zhitomirsky, J. Mater. Process. Technol., 2007, 186, 356–361 CrossRef CAS.
- A. Cross, A. Morel, A. Cormie, T. Hollenkamp and S. Donne, J. Power Sources, 2011, 196, 7847–7853 CrossRef CAS.
- J. N. Broughton and M. J. Brett, Electrochim. Acta, 2005, 50, 4814–4819 CrossRef CAS.
- Q. Lu, J. G. Chen and J. Q. Xiao, Angew. Chem., Int. Ed., 2013, 52, 1882–1889 CrossRef CAS PubMed.
- R. Della Noce, S. Eugénio, M. Boudard, L. Rapenne, T. M. Silva, M. J. Carmezim, S. W. Donne and M. F. Montemor, RSC Adv., 2016, 6, 15920–15928 RSC.
Footnote |
| † Electronic supplementary information (ESI) available: SEM images and XRD. See DOI: 10.1039/c7ra04481j |
| This journal is © The Royal Society of Chemistry 2017 |